Abstract
Carbohydrate-mediated interactions are involved in many cellular activities including immune responses and infections. These interactions are relatively weak, and as such, cells employ multivalency, i.e., the presentation of multiple monovalent carbohydrate ligands within a close proximity, for cooperative binding thus drastically enhanced binding affinity. In the past two decades, the field of glyconanomaterials has emerged where nanomaterials are used as multivalent scaffolds to present multiple copies of carbohydrate ligands on the nanomaterial surface. At the core of glyconanomaterial research is the ability to control and modulate multivalency through ligand display. For the quantitative evaluation of multivalency, the binding affinity must be determined. Quantification of the binding parameters provides insights for not only the fundamental glyconanomaterial – lectin interactions, but also the rational design of effective diagnostics and therapeutics. Several methods have been developed to determine the binding affinity of glyconanomaterials with lectins, including fluorescence competitive assays in solution or on microarrays, Förster resonance energy transfer, fluorescence quenching, isothermal titration calorimetry, surface plasmon resonance spectroscopy, quartz crystal microbalance and dynamic light scattering. This Feature Article discusses each of these techniques, as well as how each technique is applied to determine the binding affinity of glyconanomaterials with lectins, and the data analysis. Although the results differed depending on the specific method used, collectively, they showed that nanomaterials as multivalent scaffolds could amplify the binding affinity of carbohydrate-lectin interactions by several orders of magnitude, the extent of which depending on the structure of the carbohydrate ligand, the ligand density, the linker length and the particle size.
Table of Contents Entry
This Feature Article discusses the techniques we and others developed to determine the association/dissociation constants of the interactions between glyconanomaterials and lectins, which is critical in the quantitative evaluation of nanomaterials as multivalent scaffolds in enhancing the binding affinity of carbohydrate – lectin interactions.
1. Introduction
Cell surface is covered by a dense coating of glycoproteins and glycolipids, the so-called glycocalyx. On prokaryotic cells like bacteria, the glycocalyx serves multiple functions, including as the protective layer to avoid immune cell recognition, as the penetration barrier to antibiotics, as the signal to initiative pathogenicity and to establish infection by adhering to the host cells.1 In biofilms, glycocalyx-producing bacteria form a network of protective barriers that prevent the entry of antibiotics.2 On eukaryotic cells, the glycans on cell surface mediate cell-cell communications including adhesion, growth, signal transduction, and infections by pathogens.3 For instance, carbohydrate-mediated interactions have been identified as the primary mode of action that allow the attachment of bacteria to human cells, and in the general initiation of pathogenicity.4–5 SARS-Cov-2, the causative virus of COVID-19, invades human cells by attaching itself to the ACE2 receptor on the host cells through the spike protein, the receptor-binding domain of which is populated with N-linked glycopeptides.6
Lectins are carbohydrate-binding proteins that are ubiquitously found in plants, animals, bacteria and viruses.7 The binding affinity of lectins with monovalent carbohydrates is relative weak, with the dissociation constant (KD) in the range of 1 – 0.1 mM,8 compared to the nM affinity of enzyme-substrate or antibody-antigen interactions. As such, cells employ multivalency – the presentation of multiple glycans and lectins within a close proximity – for cooperative binding thus drastic enhanced binding affinity.9–11 For example, the influenza virus invades host cells through multivalent interactions between hemagglutinin, a lectin on the virus particle at the density of 600 – 1200 molecules/virus, and sialic acid residuals on the cell surface glycoproteins at the density of 0.50 – 2/nm2.12
Multivalent interactions require multiple carbohydrate ligands having proper ligand presentation and a lectin having two or more carbohydrate-binding sites. Lectins generally have multiple carbohydrate binding sites,13 and consequently, lectin binding to cells often leads to strong binding resulting from the crosslinking with the cell surface glycoproteins and glycolipids. The multivalent interactions have been investigated as a therapeutic strategy, for example, to develop inhibitors for carbohydrate-mediated diseases like infections.14 For the therapeutic candidates to be effective, the binding needs to be competitively strong compared to the native ligands. In this regard, the design of the multivalent scaffold is essential to ensure the proper ligand presentation for affinity enhancement.15–17
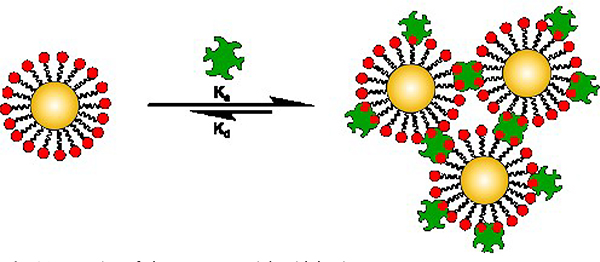
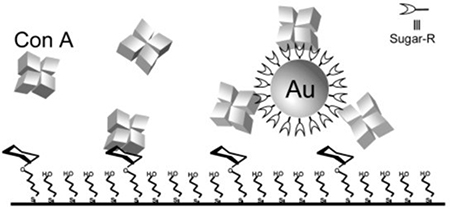
In the past two decades, the field of glyconanomaterials has emerged, where nanomaterials are used as multivalent scaffolds to present multiple copies of carbohydrate ligands on the nanomaterial.18 Depending on the size of the nanomaterials and the carbohydrate, hundreds and thousands of carbohydrate molecules can be presented on the nanomaterial. Thus, glyconanomaterials interact with multivalent lectins to form crosslinked agglomerates (Fig. 1), the affinity of which can be several orders of magnitude higher than the free carbohydrate. Glyconanomaterials have found utilities in sensing lectins, in vitro and in vivo sensing and imaging, as therapeutics for cancer and bacterial infections, and as vaccines.14, 19–28 At the core of glyconanomaterial research is the ability to control and modulate multivalency through ligand display.29 For both fundamental studies and applications, the binding affinity must be determined to quantitatively evaluate the affinity enhancement.
Fig. 1.
Interaction of glyconanomaterials with lectins.
We have developed several techniques to determine the binding affinity of glyconanomaterials with lectins, including fluoresecence-based competitive assays (in solution or on microarray), isothermal titration calorimetry (ITC), and dynamic light scattering (DLS). Förster resonance transfer (FRET), fluorescence quenching by gold nanoparticles, surface plasmon resonance (SPR) and quartz crystal microbalance (QCM) have also been used by other researchers for affinity determination. In the sections below, these techniques will be discussed including how they were used to determine the binding affinity of glyconanomaterials with lectins. Examples will be presented with regard to the experimental design, results and data analysis in the context of binding affinity as well as factors that impact the affinity enhancement.
2. Fluorescence
Fluorescence is a highly sensitive technique that can measure sample concentrations at ppb to ppt level.30 It is also versatile, and can be adapted to different settings in solution or in the solid state, allowing the direct visualization of biological processes as well as quantification of the ligand-receptor binding. If the lectin or the nanomaterial is not inherently fluorescent or the fluorescence is weak, a fluorescent tag is needed on either the lectin or the nanomaterial. Organic fluorophores are among the most popular as they can be obtained commercially in a variety of structures, functionalities, solubilities, and the emission profiles. The fluorophores are generally conjugated to nanomaterials or lectins through well-established coupling chemistries like the carboxy-amine amidation or the click reactions.
2.1. Solution-based fluorescence competition assay
Unless the nanomaterial itself is fluorescent, either the glyconanomaterial or the lectin needs be tagged with a fluorescent dye. To quantify the binding affinity of glyconanomaterials with lectins, the glyconanomaterial and the free carbohydrate as the competing ligand – one with fixed and the other with varying concentrations – are incubated together with the lectin. Two equilibria are established in the solution: lectin with glyconanomaterial and lectin with the free carbohydrate. Interactions of the lectin with the glyconanomaterial leads to the formation of glyconanomaterial-lectin crosslinks and subsequent agglomeration of the glyconanomaterial. Centrifugation would precipitate the agglomerates, leaving behind the unbound in the supernatant. By measuring the fluorescence intensity of the supernatant, a dose response curve can be constructed, from which the binding affinity can be derived.
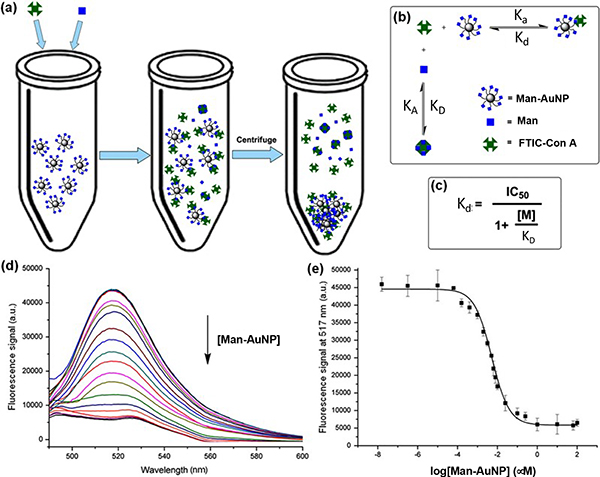
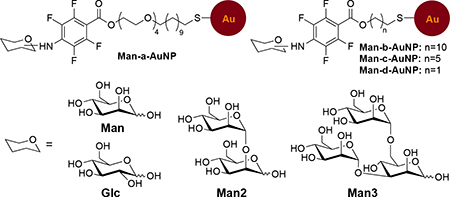
We employed the fluorescence competition assay to determine the apparent dissociation constant (Kd) between concanavalin A (Con A), a tetrameric plant lectin at pH>7,31 and carbohydrate-functionalized gold nanoparticles (glyco-AuNPs) synthesized by the photocoupling reaction developed in our laborabory.32–33 In the experiment, varying concentrations of D-mannose-functionalized AuNPs, Man-AuNPs, together with a fixed concentration of Man were incubated with fluorescein-tagged Con A (FITC-Con A), and the fluorescence of the supernatant was measured after the glyco-AuNP—FITC-Con A agglomerates and unbound glyco-AuNPs were removed by centrifugation (Fig. 2a). Fig. 2e is the dose-response curve obtained from Man-AuNPs. Fitting the curve with Cheng-Prusoff equation (Fig. 2c) gave Kd of 0.43 ± 0.044 nM. Taking into consideration of the ligand density determined by the anthrone-sulfuric acid assay (3,991 per AuNP), this represented a 274-fold affinity enhancement (EF) in the case of Man-AuNPs compared to that of Man with Con A (Entry 6, Table 1).
Fig. 2.
(a) Fluorescence competition assay to measure the binding affinity of Man-AuNPs with Con A. Man-AuNPs together with Man were incubated with FITC-Con A for 1 h. Fluorescence of the supernatant was measured after removing the bound FITC-Con A by centrifugation. (b) Two equilibria established in the system: Con A with Man-AuNPs and Con A with Man. (c) Cheng-Prusoff equation. IC50: concentration of Man-AuNPs displaying 50% of Man-FITC-Con A binding; [M]: concentration of Man, KD: dissociation constant of Man with Con A, and Kd: dissociation constant of Man-AuNPs with Con A. (d) Fluorescence spectra vs. concentration of Man-AuNPs. (e) Dose response curve of fluorescence vs. concentration of Man-AuNPs. Reproduced from ref. 33 with permission from The American Chemical Society, copyright 2010.
Table 1.
Binding affinity of glyco-AuNPs with Con A.33
 | |||||
|---|---|---|---|---|---|
| Entry | Glyco-AuNPs | Size (nm)c | Na | Kd (nM) | EFb |
| 1 | Man-a-AuNP | 22 ± 3.3 | 107 | 27.4 ± 2.3 | 160 |
| 2 | 22 ± 3.3 | 283 | 8.67 ± 0.87 | 192 | |
| 3 | 22 ± 3.3 | 544 | 1.93 ± 0.25 | 705 | |
| 4 | 22 ± 3.3 | 1444 | 1.33 ± 0.31 | 245 | |
| 5 | 22 ± 3.3 | 2275 | 1.01 ± 0.22 | 205 | |
| 6 | 22 ± 3.3 | 3991 | 0.43 ± 0.044 | 274 | |
| 7 | Man-b-AuNP | 22 ± 3.3 | 99 | 92 ± 12 | 52 |
| 8 | 22 ± 3.3 | 260 | 16.1 ± 5.5 | 112 | |
| 9 | 22 ± 3.3 | 549 | 12.3 ± 4.1 | 372 | |
| 10 | 22 ± 3.3 | 1196 | 10.8 ± 1.8 | 36 | |
| 11 | 22 ± 3.3 | 2090 | 7.1 ± 1.7 | 32 | |
| 12 | 22 ± 3.3 | 2824 | 4.0 ± 0.7 | 42 | |
| 13 | Man-a-AuNP | 22 ± 3.3 | 3991 | 0.43 ± 0.044 | 274 |
| 14 | Man-b-AuNP | 22 ± 3.3 | 2824 | 4.0 ± 0.72 | 42 |
| 15 | Man-c-AuNP | 22 ± 3.3 | 1959 | 15 ± 2.0 | 16 |
| 16 | Man-d-AuNP | 22 ± 3.3 | 1590 | 19 ± 2.2 | 16 |
| 17 | Man-b-AuNP | 7.2 ± 1.8 | 297 | 3.38 ± 0.67 | 468 |
| 18 | Man-b-AuNP | 14 ± 2.6 | 1127 | 3.14 ± 0.49 | 132 |
| 19 | Man-b-AuNP | 22 ± 3.3 | 2824 | 3.99 ± 0.81 | 42 |
| 20 | Man-b-AuNP | 30 ± 4.0 | 4486 | 24.8 ± 3.1 | 4.2 |
| 21 | Man-a-AuNP | 22 ± 3.3 | 3,991 | 0.43 ± 0.044 | 274 |
| 22 | Glc-a-AuNP | 22 ± 3.3 | 3,641 | 12.7 ± 2.5 | 39 |
N: number of carbohydrate ligands on AuNP, determined by anthrone-sulfuric acid assay
Enhancement factor EF = Kd/(KD × N). KD (Man-Con A) = 470 μM; KD (Glc-Con A) = 1.79 mM
Diameter of AuNPs was measured by TEM
Using this method, we studied how the ligand presentation impacted the binding affinity of glyco-AuNPs, including the ligand density, linker length, nanoparticle size, and ligand structure (Table 1).33 For the ligand density, we varied the number of carbohydrate ligands on AuNPs while keeping the particle size and linker the same. Results showed that Kd decreased with the ligand density (Entries 1–6, 7–12). However, when the number of surface ligands was taken into consideration, the enhancement factor (EF) increased with the ligand density, first reaching a maximum and then decreasing with further increase in the ligand density.
Of the linkers used in the study, the binding affinity increased with the length of the linker (Entries 13–16). Although the ligand density N also increased with the linker length, the enhancement factor EF, which takes into consideration of the number of ligands, clearly showed that the spacer linker affected the affinity enhancement. The longest linker having 4 CH2CH2O and 11 CH2 units gave an EF of 274 vs. 42 for the linker having just 11 CH2 units (Entry 13 vs. 14). The EF further decreased to 16 with the reduction of the linker length to 6 or 2 CH2 units (Entries 15, 16). The difference in Kd of Entries 15 and 16 was most likely due to the difference in the ligand density N. Long linkers are known to make the ligands more accessible for receptor binding. In the study of glycoside cluster effect, it was often observed that increasing the linker length between the monovalent subunits led to an increase in affinity, but the affinity enhancement decreased upon further increase in the spacer length, attributed to the entropic penalty especially for flexible linkers.8, 34 In our case, the long and flexible linker having 4 CH2CH2O and 11 CH2 units had the highest affinity and affinity enhancement, with a Kd of 0.43 nM and EF of 274. In our case, the ligands were tethered to the nanoparticles which imposed configurational restrictions on ligand organization. This could compensate for the entropic loss that negatively impacts the binding.
With regard to the particle size, the binding affinity of 7, 14 and 22 nm Man-b-AuNPs were similar (Entries 17–19), and was about 7 times higher than that of 30 nm Man-b-AuNPs (Entry 20). When taking into consideration of the ligand density, the affinity enhancement EF decreased with the particle size, with the 7 nm Man-b-AuNPs having the highest enhancement of 468 (Entry 17) despite of having the lowest number of Man on the AuNP. The surface curvature, which is inversely related to the particle diameter with that of a flat surface being 0, is the highest for the smallest AuNP. The ligands on high curvature surfaces are further apart from each other compared to surfaces with lower curvatures. This spatial arrangement reduces the steric hindrance and makes the surface ligands more accessible for binding with the lectin.
The impact of the ligand structure on the binding affinity can be seen by comparing the two Con A-binding monosaccharides, Man and D-glucose (Glc). Man is a stronger ligand for Con A, with about 4 times lower KD than Glc (Table 1). Conjugating Man or Glc on AuNP gave Man-AuNP and Glc-AuNP having similar ligand density (Entries 21, 22). However, the affinity enhancement EF of Man-AuNP was 30 times larger than Glc-AuNP with Con A. This indicates that the AuNP not only served as a multivalent scaffold to enhance the binding affinity of monovalent carbohydrates with lectin, but also to amplify the affinity difference by further increasing the affinity of the stronger ligand.
Having established the protocol, we tested another lectin cyanovirin-N (CV-N), a cyanobacterial lectin that inhibits viruses, including HIV, by binding to their high-mannose (HM) structures like Man9 on the envelop glycoprotein gp120 at nanomolar affinity.35 As HMs are difficult to obtain commercially or by synthesis, we set out to test whether affinity enhancement could be achieved by attaching the epitopes of HMs, α−1,2-Man2 or α−1,2-α−1,2-Man3, to nanoparticles. We conjugated Man2 and Man3 to 22 nm AuNPs, and determined the Kd of Man2-AuNPs and Man3-AuNPs with two CV-N variants, the wild-type CVNQ50C which contains one glycan binding site on Domain A and another on Domain B, and CVNMutDB which lacks the glycan binding site on domain B. In the assays, fluorescently-tagged CV-N variants were incubated with a fixed amount of Man2 or Man3 and varying concentrations of Man2-AuNPs or Man3-AuNPs. Fitting the dose-response curves gave the Kd of Man2-AuNPs and Man3-AuNPs with domains A and B (Table 2).
Table 2.
Dissociate constants of Man2, Man2-AuNPs, Man3 or Man3-AuNPs with domain A or B of CVNQ50C. The numbers in parentheses are the enhancement factors (EF=KD/(Kd × Number of Man2 on Man2-AuNP (or Man3 on Man3-AuNP), where KD is the dissociate constant of Man2/3 and Kd is the dissociate constant of Man2/3-AuNPs).35
| Domain A | Domain B | |
|---|---|---|
| Man2 | 700 ± 50 μM | 64 ± 4 μM |
| Man2-AuNP | 56.4 ± 7 nM (8.2) | 0.24 ± 0.1 nM (176) |
| Man3 | 3.4 ± 0.2 μM | 43 ± 2 μM |
| Man3-AuNP | 0.011 ± 0.007 nM (309) | 11.8 ± 2.3 nM (3.6) |
Several conclusions can be drawn from the results. (1) Conjugating Man2 and Man3 to AuNPs drastically increased the affinity of the free ligands with domains A and B. Man2-AuNPs bound domains A and B at 1.2 × 10⁴ and 2.7 × 10⁵ folds stronger than Man2, and Man3-AuNPs bound domain A and B at 3.1 × 10⁵ and 3.6 × 10⁴ folds stronger than Man3. (2) The affinity enhancement was higher for the better binding domain. For Man2, the stronger binding domain B gave an EF of 178 vs. 8.3 for the weaker binding domain A, whereas for Man3, the stronger binding domain A gave an EF of 340 vs. 3.8 for the weaker binding domain B. These results were consistent with our previous observations that AuNPs amplified the binding affinity of the stronger ligand than the weaker one (Entries 21 – 22, Table 1). (3) Affinity enhancement can indeed be achieved by conjugating the epitopes of HM, Man2 or Man3, to the nanoparticle scaffold. This greatly reduced the effort in the complex and lengthy synthesis of the higher carbohydrate structures like Man9.
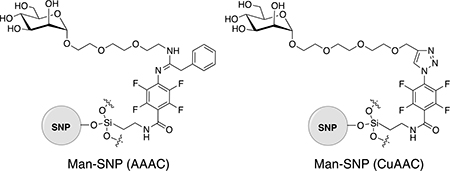
The assay applied to not only AuNPs, but also other nanoparticles. Using silica nanoparticles (SNPs, ~87 nm in diameter), we set out to test a new conjugation chemistry, perfluorophenyl azide-aldehyde-amine cycloaddition, for the synthesis of glyconanoparticles.36–38 The product, Man-SNP(AAAC), was compared with glyconanoparticles synthesized by the Cu-catalysed azide-alkyne cycloaddition (CuAAC) reaction, Man-SNP(CuAAC), with regard to the ligand density and the binding affinity (Table 3).38–39 The results showed that the binding affinity of Man-SNP(AAAC) with FITC-Con A was more than 4 times higher than Man-SNP(CuAAC) despite of the 2.5 times lower Man density on Man-SNP(AAAC) and similar linker structures.
Table 3.
| ||
|---|---|---|
| Ligand density (× 10−16 nmol/nm2)a | Kd (μM) | |
| Man-SNP(AAAC) | 2.5 ± 0.2 | 0.067 ± 0.005 |
| Man-SNP(CuAAC) | 6.4 ± 0.2 | 0.289 ± 0.003 |
determined by quantitative 19F qNMR.
2.2. Fluorescence competition assay on microarray
Microarrays are lab-on-a-chip devices where reactions or assays are carried out on a glass slide or a wafer that contain arrays of reagents in the form of printed spots created using a robotic printer. It provides a high-throughput way allowing thousands of assays to be carried out simultaneously. A variety of microarrays have been developed, for example, DNA, protein including lectin, and carbohydrate microarrays.40–44 In the microarray format, the ligand is immobilized on the solid substrate in an array, which is then treated with the analyte molecule in solution.45 For detection by fluorescence, the analyte is often tagged with a fluorophore. Upon interaction with the ligand on the microarray, the product becomes fluorescent, the intensity of which is related to concentration of the analyte and the binding kinetics.
We developed a super-microarray where the binding affinity was determined for different carbohydrates and lectins simultaneously on a single microarray.46 In a proof-of-concept study, we conjugated different carbohydrates (Man, Man2, Man3 and D-galactose (Gal)) to silica nanoparticles that were doped with FITC (FSNPs), and carried out the fluorescence competition assays on a lectin microarray created on an amine-modified glass slide by printing lectins using a robotic printer. A polydimethylsiloxane (PDMS) isolator was placed on the slide to create arrays of wells containing the lectin microarrays (Fig. 3A). This format, which consisted of arrays of wells whereas each well is a microarray by itself, is thus called the super-microarray. In this configuration, each well on the super-microarray was a lectin microarray, and fluorescence competition assays can be run simultaneously in all wells. In the experiment, carbohydrate-functionalized FSNPs (glyco-FSNPs) were incubated with varying concentrations of the free carbohydrate in the wells, followed by removing the excess reagents. The fluorescence intensities of all spots on the lectin microarrays, which correlated to the bound glyco-FSNPs, were obtained in a single scan using a microarray scanner, giving the readings for the entire super-microarray. Fig. 3Ba is the fluorescence image of a super-microarray containing lectins CVNQ50C, CVNMutDB, soybean agglutinin (SBA), Con A, peanut agglutinin (PNA) and bandeiraea simplicifolia Lectin I (BS-I), probed with Man2-FSNPs using Man2 as the competing ligand. The dose response curves for all 6 lectins were generated from this single super-microarray, from which Kd was obtained following the method in Fig. 2, as shown in the examples in Figs. 3B(b–d).
Fig. 3.
(A) Fabrication of super-microarray. (B) Fluorescence competition assays on the super-microarray: (a) fluorescence image after incubating the lectin super-microarray with Man2-FSNPs and varying concentrations of Man2; fluorescence intensity vs. Man2 concentration for (b) CVNMutDB, and (d) Con A. The insert in (b) was the fluorescence image of the spots corresponding to the data points on the graph. Reproduced from ref. 46 with permission from ELSEVIER, copyright 2013.
The binding affinity of glyco-FSNPs with lectins, in the range of nM – pM, are again 3 – 5 orders of magnitude higher than those of the free ligands (Table 4).46 The affinity enhancement, however, was much lower than previously observed. Except for Man3, the EF of all other glyco-FSNPs was <1. Several factors can contribute to this. In microarray, lectins were tethered to a solid surface, and as such, not all binding sites on the lectin was available for interactions with the glyco-NPs. This effectively reduced the multivalency effect as compared to in solutions where all binding sites on the lectin are available. Secondly, the solid substrate can introduce steric hindrance to further reduce the accessibility of lectin for binding with glyco-NPs. Thirdly, the SNPs in this case were much larger (~100 nm) than the AuNPs in previous examples (< 30 nm). In line with the results in Table 1 that the affinity enhancement decreased with the particle size, the larger SNPs are expected to have lower EF. These factors, taken together, contributed the lower affinity enhancement obtained from the super-microarray.
Table 4.
Dissociation constants of free carbohydrates, and glyco-FSNP with lectins obtained from lectin super-microarray.46
| CVNQ50C | CVNMutDB | Con A | PNA | Ligand Densitya | |
|---|---|---|---|---|---|
| Man3-FSNP | 1.7 nM | 0.43 nM | 8.3 pM | -- | 24,800 |
| Man3 | 16 μM | 3.4 μM | 3.0 μM | -- | |
| EF | 0.4 | 0.3 | 15 | ||
| Man2-FSNP | 17 nM | 589 nM | 5.4 nM | -- | 27,200 |
| Man2 | 90 μM | 757 μM | 24 μM | -- | |
| EF | 0.2 | 0.5 | 0.2 | ||
| Man-FSNP | -- | -- | 13.7 nM | -- | 55,200 |
| Man | -- | -- | 470 μM | -- | |
| EF | 0.6 | ||||
| Gal-FSNP | -- | -- | -- | 114 nM | 54,000 |
| Gal | -- | -- | -- | 1050 μM | |
| EF | 0.2 |
determined by anthrone-sulfuric acid method.
2.3. Förster resonance energy transfer (FRET)
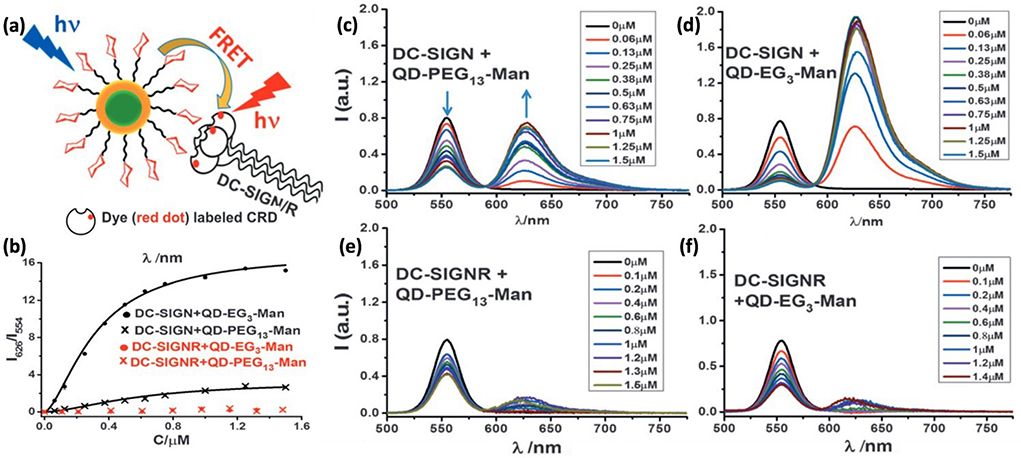
FRET is a photophysical phenomenon which involves the transfer of energy from an excited (donor) to an acceptor fluorophore through a distance within the range of 1 – 10 nm.47 Taking advantage of the inherent luminescent property of quantum dots (QD), Zhou and coworkers employed FRET to determine the binding affinity between Man-QDs and the tetrameric dendritic cell receptor DC-SIGN or the endothelial cell receptor DC-SIGNR (Fig. 4a).48 Both lectins play key roles in promoting HIV/Ebola infection by binding to Man-containing glycans on the virus.
Fig. 4.
(a) FRET probing multivalent interactions between Man-QDs and DC-SIGN/R. CRD: carbohydrate recognition domain. (b) FRET ratio vs. concentration of DC-SIGN/R, and fitting to the Hill equation. (c-f) Fluorescence spectra of Man-QDs after binding with Atto 594-labeled DC-SIGN/R. Reproduced from ref. 48 with permission from Wiley-VCH, copyright 2016.
In the experiment, DC-SIGN/R were labeled with the Atto 594 dye. The Atto 594 – QD pair has the necessary Förster radius (4.7 – 5.0 nm) to enable the FRET process. When DC-SIGN/R bound to Man-QDs, fluorescence quenching of QDs was observed at 554 nm, and at the same time, Atto 594 FRET signal was amplified at 626 nm resulting from the FRET mechanism (Fig. 4c–f). The FRET ratio (I626/I554) correlated to the number of proteins bound to QDs. By plotting I626/I554 vs. the concentration of DC-SIGN/R and fitting the data to the Hill equation, Kd was obtained (Fig. 4b). Two Man-QDs having ethylene oxide linker of different lengths were synthesized, QD-PEG3-Man (~8.9 nm, EG:) and QD-PEG13-Man (~9.6 nm). The obtained apparent Kd for DC-SIGN interactions with QD-PEG3-Man and QD-PEG13-Man were 0.32 ± 0.07 and 0.6 ± 0.1 μM, respectively. In a subsequent study, the authors improved the method and reported Kd of 35 ± 7 nM for QD-PEG3-Man with DC-SIGN.49 Additional Kd values were also reported, including QD-PEG3-DiMan and QD-PEG11-DiMan with DC-SIGNR at 62 ± 8 nM and 633 ± 77 nM, respectively (DiMan: Man-α−1,2-Man).
2.4. Fluorescence quenching
Fluorescence quenching has also been used to determine the binding affinity of glyco-AuNP-lectin interactions by taking advantage of the fluorescence quenching ability of gold surfaces. When the fluorescent donor is in close proximity to the quencher, fluorescence quenching takes place. While most organic molecules quench through FRET, quenching by AuNPs occurs through nano-surface energy transfer (NSET), which covers a wider distance range than FRET.50
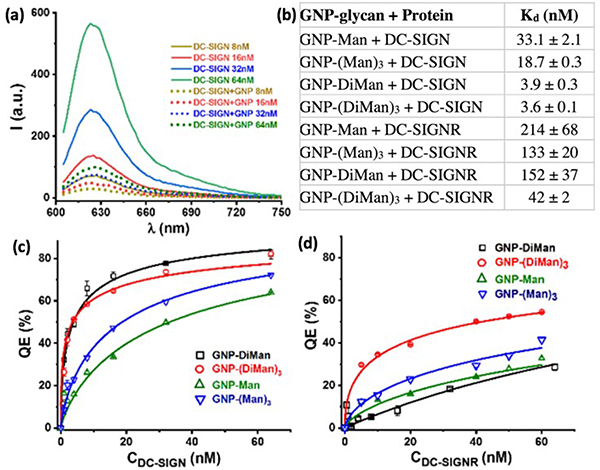
Zhou and coworkers employed fluorescence quenching to determine Kd of DC-SIGN and DC-SIGN/R lectins with glyco-AuNPs, including Man-AuNP, (Man)3-AuNP, DiMan-AuNP and (DiMan)3-AuNP.51 The DC-SIGN/R lectin was labeled with Atto 594 which acted as the fluorescent donor. When AuNP was in close proximity to Atto-594, quenching took place (Fig. 5a). By plotting the quenching efficiency (QE) vs. the lectin concentration and fitting the data to the Hill equation, Kd was obtained (Fig. 5c, d). Results showed much enhanced binding affinity of the lectins for glyco-AuNPs, with Kd in the range of nM (Fig. 5b). For example, Kd of DiMan-AuNPs with DC-SIGN, at 3.9 nM, was ~250,000 times stronger than the monovalent DiMan – DC-SIGN complex. Also, DC-SIGN bind glyco-AuNPs stronger than DC-SIGNR. DiMan-AuNP and (DiMan)3-AuNP were stronger binder, especially to DC-SIGN.
Fig. 5.
(a) (a) Fluorescence spectra of varying concentrations of Atto-594-labeled DC-SIGN without (solid lines) and with (dotted lines) 1 equivalent of DiMan-AuNP at 590 nm excitation. (b) Kd of different DC-SIGN/R and glyco-AuNP pairs. (c) QE (%) vs. DC-SIGN concentration fitted to the Hill equation. (d) QE (%) vs. DC-SIGNR concentration fitted to the Hill equation. Reproduced from ref. 51 with permission from The American Chemical Society, copyright 2020.
3. ITC
ITC measures the heat absorbed or released during biomolecular interactions. It involves a series of titrations in which one binding ligand (titrant) is added in aliquots into the sample cell containing its binding partner at a constant temperature. The heat released or absorbed is measured against a reference cell that contains only the medium, from which a complete thermodynamic parameters of the binding event can be derived, including enthalpy (ΔH), entropy (ΔS), the binding constant, stoichiometry (n), and the presence/absence of cooperative interactions.52–54 ITC is a label free, non-destructive technique that does not require the ligands or substrates to be chemically modified by a fluorescent tag or immobilization on a solid substrate. As such, it measures the binding parameters in the native state of biomolecules, and is applicable to a wide range of samples including optically dense solutions. The use of ITC has been broadened since the last two decades, as highly sensitive instruments that can detect heat from binding events on the nanomole levels became available. State-of-art ITC instruments require only μg of samples while provides high detection sensitivity (kD: mM-pM).55 Despite these advantages, ITC can suffer from the formation of aggregates during the titration, especially in multivalent ligands, resulting in misleading data which hinders the extraction of correct thermodynamic parameters. Additionally, because the evolution of heat is universal in molecular interactions, any processes that can release or absorb heat will contribute to the isotherm, thus complicating the data analysis.
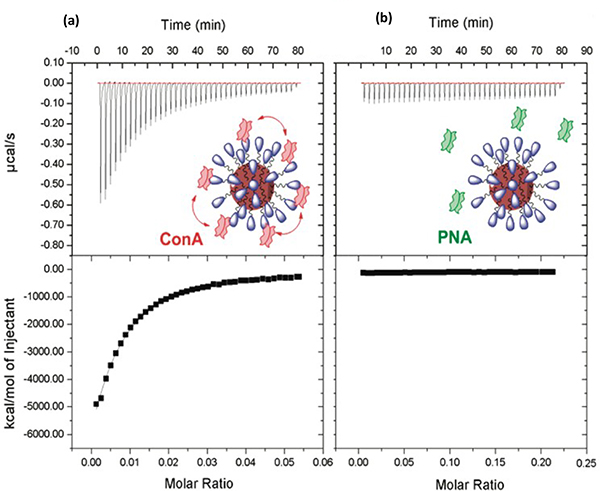
We employed ITC to determine the binding affinity between Con A and glyco-AuNPs.56 In a study to test our photocoupling chemistry, Man, Gal and Man2 were conjugated to AuNPs. The resulting glyco-AuNPs were placed in the ITC cell while aliquots of the lectin solution were injected into the sample cell from the syringe. This arrangement avoids the potential issue of glyco-AuNPs adhering to the syringe wall.
Fig. 6a is an example of the obtained ITC isotherm of Man-AuNP with Con A, showing that the heat released increased with each injection of Con A. The thermogram was not the ideal sigmoidal, most likely due to the low concentration of Man-AuNPs. For non-interacting lectin like PNA, no detectable changes were observed during the titration of PNA to Man-AuNP (Fig. 6b).
Fig. 6.
ITC titration graphs of Man-AuNP with (a) Con A, (b) PNA. The solid squares were experimental data, and lines were theoretical fits. Reproduced from ref. 56 with permission from The American Chemical Society, copyright 2012.
Table 5 summarizes the binding data of different glyco-AuNPs with lectins obtained from ITC. The results again showed a 3−5 order of magnitude affinity enhancement of glyco-AuNPs over the free ligands. The negative enthalpy change (ΔH < 0) implied that the glyco-AuNP − lectin interaction was an exothermic process with an unfavorable entropic contribution (ΔS < 0) and an overall negative ΔG. The number of binding sites on glyco-AuNPs (N), which is the number of functional valences on the particle that are available for binding with the lectin, was smaller than the number of carbohydrate ligands that were immobilized on the particle surface (e.g., 306 vs. 3600). Thus, only a subset of the available ligands on the GNP participated in the lectin binding. This is not surprising as the surface ligands need to be in the correct spatial arrangements and density in order for all ligands to participate in the binding.
Table 5.
Thermodynamic parameters and binding affinity of glycol-NP - lectin interactions measured by ITC.56
| Entry | GNP | Ligand density | Lectin | ΔH (× 104 KJ mol−1) | -TΔS (× 104 KJ mol−1) | ΔG (KJ mol−1) | n | Na | Kd (nM)b | KD(μM)c | EF |
|---|---|---|---|---|---|---|---|---|---|---|---|
| 1 | Man-AuNP | 3,600 | Con A | −10.8 | 10.8 | −39 | 0.00327 | 306 | 122 | 470 | 1.1 |
| 2 | Man2-AuNP | 1,400 | CVNMutDB | −0.67 | 0.66 | −44 | 0.00625 | 160 | 17 | 757 | 31 |
| 3 | Man2-AuNP | 110 | Con A | −3.06 | 3.05 | −39 | 0.0121 | 83 | 175 | 24 | 1.2 |
| 4 | Man2-AuNP | 260 | Con A | −2.84 | 2.83 | −40 | 0.0101 | 99 | 83 | 24 | 1.1 |
| 5 | Man2-AuNP | 1,400 | Con A | −4.64 | 4.63 | −43 | 0.00478 | 209 | 35 | 24 | 0.5 |
Number of binding sites on glyco-AuNP N = 1/n
Kd: dissociation constant of glyco-AuNP with lectin
KD: dissociation constant of the free carbohydrate ligand with lectin
We also investigated the effect of the ligand density on the binding affinity using ITC (Table 5). The affinity with Con A as well as the number of binding sites on Man2-AuNPs (N) increased with increasing ligand density (Entries 3–5). At low ligand density, increasing the number of Man2 on Man2-AuNP from 110 (Entry 3) to 260 (Entry 4) resulted in an increase in binding affinity (Kd from 175 to 83 nM), roughly in proportion to the ligand density. The affinity enhancement (EF) and the thermodynamic parameters were similar, with a slightly favourable ΔG (−40 kJ/mol for Entry 4 vs. −39 kJ/mol for Entry 4), primarily from the gain in entropy. Further increase in the ligand density to 1,400 improved ΔG to −43 kJ/mol, primarily from the gain in enthalpy (Entry 5). The entropic change, at −TΔS of 4.63 ✕ 104 kJ/mol, was however unfavourable for the higher ligand density compared to the lower ones. The binding affinity, although higher (2.4 times from 83 to 35 nM), was not in proportion to the increase in the ligand density (5.4 times from 260 to 1,400). This was also reflected in a lower EF of 0.5.
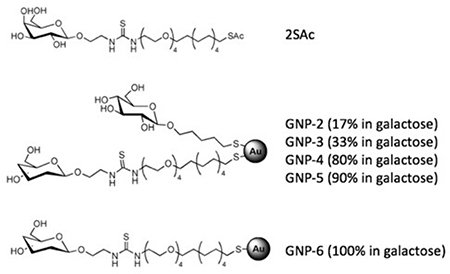
Reynolds et al. used ITC to study the interaction of Gal-AuNPs with PA-IL, a tetrameric lectin isolated from Pseudomonas aeruginosa.57 The glyco-NPs with a core size of 1.2–1.7 nm were synthesized by in situ reduction of HAuCl4 with NaBH4 in the presence of thiol-derivatized Gal having either a (CH2)5 or (CH2CH2O)4(CH2)11 linker. A thiol-derivatized Glc was added to vary the Gal density on Gal-AuNPs. Aliquots of PA-IL were titrated into the Gal-AuNPs solution in the ITC cell, and the results were fitted into a single-site binding model to obtain the thermodynamic parameters and the binding constants (Table 6). The data showed that conjugation of Gal to AuNPs resulted in a more favourable entropic contribution (-TΔS=6.7±6.7 ✕ 104 kJ/mol) compared to the free ligand SAc (-TΔS=43±3 ✕ 104 kJ/mol). Despite a decrease in the enthalpy, this led to an overall lower ΔG thus higher binding affinity of Gal-AuNPs with PA-IL than the free ligand SAc. Increasing the Gal density on the AuNP from 17% (GNP-2) to 33% (GNP-3) increased the binding affinity from 5.8 to 0.76 μM, and the increase was dominated by the enthalpic contribution. Further increasing the ligand density to 100% Gal increased the affinity to 0.05 μM, due to a large gain in entropy.
Table 6.
Thermodynamic parameters and binding affinity of Gal-AuNPs with PA-IL measured by ITC.57
 | |||||||
|---|---|---|---|---|---|---|---|
| Ligand | Ka [106 M−1] | Kd [μM] | n [stoichiometry] | ΔG [kJ mol−1] | ΔH [kJmol−1] | -TΔS [kJmol−1] | β |
| 2SAc | (0.007 ± 0.001) | 141 | 1[a] | (−22.0 ±0.4) | (−65±3) | (43 ±3) | 1 |
| GNP-2 | (0.17 ±0.03) | 5.8 | (1.2±0.2) | (−29.9 ±0.4) | (−37±7) | (6.7 ±6.7) | 24 |
| GNP-3 | (1.3 ±0.8) | 0.76 | (0.76±0.04) | (−34 ±3) | (−54±9) | (20 ±12) | 185 |
| GNP-6 | (20 ±2) | 0.05 | (2.1 ±0.6) | (−41.7 ±0.3) | (−18±5) | (−23±5) | 2824 |
n: Stoichiometry, refers to the number of Gal binding sites per PA-IL.
4. SPR
SPR is an optical detection technique, based on the interactions of light with the surface plasmon, the free electrons propagating parallel at close to the surface of a metal. When the frequency of incident photons matches the natural oscillation frequency of the surface plasmon, resonance occurs where energy is transferred, producing an absorption and the peak position is sensitive to the changes in the refractive index at or near the metal surface.58 The change can be used to monitor molecular interactions between the analyte molecules in the solution and the ligands immobilized on the sensor chip, which is often a gold film or a metal film coated with carboxymethylated dextran layer for the ease of immobilization.59 Signals are defined as resonance/response units (RU), with 1 RU equivalent to a change in 10−4 angle. By monitoring RU vs. time, parameters such as the association and dissociation rates as well as Kd (dissociation constant) and Ka (association constant) can be obtained from the sensogram.
SPR is a label-free detection method, and therefore, the analyte or ligand does not need to have radioactive, optical or enzymatic labels.60 Since the incident light is reflected off from the sensor chip without perforating through the sample solution, SPR can be applied to colored or turbid sample solutions. The SPR sensor is equipped with a flow cell, which allows the analytes to be present in their native states while monitoring the binding kinetics in real-time. As such, SPR has become a popular method to study binding affinity and kinetic parameters of biochemical interactions, including protein-protein, protein-DNA, enzyme-substrate/inhibitor, receptor-drug, antibody-antigen, lipid membrane-protein, protein-polysaccharide, cell/virus-protein interactions.61–62 The detection limit of 10 pg/mL has been reported for SPR biosensors, whereas detection sensitivity depends on the molecular weight, binding affinity and surface coverage of ligand molecules.62 As SPR is an indirect technique, any events that lead to changes in the physiochemical environment at the sensor surface will contribute to the SPR signal. These include non-specific interactions of any species in the solution with the sensor surface, changes in the viscosity of the solvent, and fluctuation in the temperature, etc.
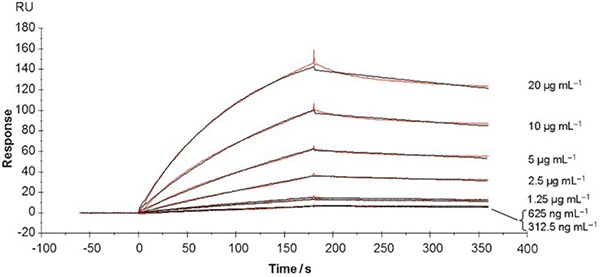
Reynolds et al. employed SPR to study the binding kinetics and to determine the binding affinity of Gal-AuNPs with PA-IL.57 PA-IL was immobilized on the SPR sensor chip, and the kinetics of the binding interactions with Gal-AuNPs was monitored. After injection of Gal-AuNPs, the interaction with the immobilized PA-IL led to an increase in the signal – this was the association stage (0 – 180 s, Fig. 7). At the steady-state stage, i.e., the saturation of PA-IL by Gal-AuNPs, the association and dissociation came to an equilibrium. After this point, the dissociation stage started (180 – 360 s, Fig. 7). Fig. 7 are the sensograms monitoring the association and dissociation kinetics of the binding between GNP-6 and different concentrations of Gal-AuNPs. By fitting the data with a one-site binding model, the association (ka) and dissociation (kd) rates were obtained, from which Kd was computed (Kd = kd/ka) (Table 7).
Fig. 7.
SPR sensograms monitoring the association (0–180 s) and dissociation of (180 – 360 s) of GNP-6 binding with PA-IL. Reproduced from ref. 57 with permission from Wiley-VCH, copyright 2012.
Table 7.
Binding kinetics and binding constants of Gal-AuNPs with PA-IL obtained from SPR.57
| ka (103 M−1 s−1) | kd (10−6 s−1) | Ka (109 M−1) | Kd (nM) | |
|---|---|---|---|---|
| GNP-2 | 16 | 291 | 0.05 | 20 |
| GNP-3 | 69 | 249 | 0.28 | 3.6 |
| GNP-4 | 69 | 41 | 1.67 | 0.6 |
| GNP-5 | 25 | 0.08 | 306 | 0.003 |
| GNP-6 | 25 | 783 | 0.03 | 33 |
The binding affinity generally increased with increasing Gal density on Gal-AuNPs, except for the highest density GNP-6. The 6 times increase in affinity when the Gal density increased from 17% (GNP-2) to 33% (GNP-3) mostly came from an increase in the association rate ka as the dissociation rate kd was similar for both. Further increase in binding affinity with increasing Gal density was the result of significant decrease in the dissociation rate, attributed to the decrease in entropic penalties as the ligands left the binding sites. The highest Gal density (i.e., GNP-6) did not give the highest affinity. While the association rate of GNP-6 was similar to GNP-5, the dissociation rate was almost 5 orders of magnitude faster. The authors attributed this to the subtle incompatibility in protein-receptor structural complementarity that exaggerated enthalpic penalties.57
Lin et al. carried out SPR competition binding assays to determine the binding affinity between Con A and glyco-AuNPs, synthesized by conjugating thiol-derivatized Man, Glc or Gal to 6 and 20 nm AuNPs.63 The sensor surface was a self-assembled monolayer consisting of 20% thioMan and 80% thiobutanol. The sensor was treated with varying concentrations of Con A together with glyco-AuNPs, where Kd was determined from the SPR response curve (Table 8).
Table 8.
Kd of glyco-AuNPs with Con A obtained from SPR competition binding assays.63
 | |||||
|---|---|---|---|---|---|
| Entry | glyco-AuNPs | Ligand | AuNP Size (nm) | linker | Kd (M) |
| 1 | 6-m-AuNP | Man | 6 | 8.8 ×10⁻⁸ | |
| 2 | s-20-m-AuNP | Man | 20 | 2.3 ×10⁻⁹ | |
| 3 | l-20-m-AuNP | Man | 20 | 3.5 ×10⁻⁹ | |
| 4 | 6-g-AuNP | Glc | 6 | 1.6 ×10⁻⁷ | |
Consistent with many results discussed earlier, conjugation of carbohydrate ligands to AuNPs amplified the binding affinity by 4–6 orders of magnitude. It is evident that the binding affinity was affected by the particle size and the linker. The 20 nm Man-AuNPs was 3 times better in binding with Con A compared to the 6 nm Man-AuNPs (Entry 2 vs. 1). Of the linkers studied, increasing the spacer length resulted in ~50% increase in affinity (Entry 3 vs. 2).
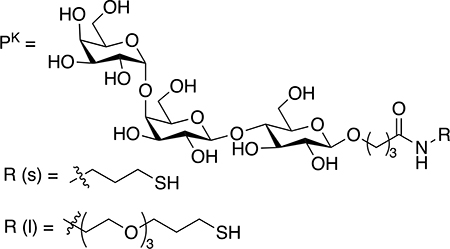
In a subsequent study, Chen and co-workers carried out similar SPR competition binding assays to determine the Kd of globotriose (Pk) conjugated on AuNPs with the B5 subunit of Shiga-like toxin I (B-Slt), a pentameric protein containing 3 binding sites in each monomer.64 The Pk-AuNPs showed a significantly enhanced affinity for B-Slt, by up to 108 folds compared to the free Pk (Table 9). The authors then studied the impact of the linker length, ligand presentation and nanoparticle size on the binding affinity. The data showed that the longer linker resulted in higher binding affinities for both the free ligands (Entry 2 vs. 3) and Pk-AuNPs (Entry 7 vs. 4, Entry 8 vs. 5, Entry 9 vs. 6). Pk-AuNPs having a longer linker also had a higher Pk density than their shorter linker counterparts, which provided more ligands to interact with the B-Slt protein. The impact of nanoparticle size was opposite to what we observed. In this case, the affinity enhancement EF was higher for larger AuNPs than the smaller ones for both the short (Entries 4–6) and the long linker (Entries 4–9), and the EF values were much higher than the Man-Con A system. A key difference in this case was that B-Slt has 15 binding sites whereas Con A has 4. Perhaps the larger nanoparticles having smaller curvatures would better position the surface ligands to interact with the large number of binding sites on B-Slt thus better multivalent interactions.
Table 9.
Binding affinity of Pk-AuNPs and Pk with B-Slt obtained from SPR competition binding assay.64
 | |||||
|---|---|---|---|---|---|
| Entry | Ligand | AuNP size | PK densitya | Kd (M) | EF |
| 1 | PK | -- | -- | 1.14 ×10⁻⁴ | -- |
| 2 | PK-s-dimer | -- | -- | 3.68 ×10⁻⁵ | -- |
| 3 | PK-l-dimer | -- | -- | 6.38 ×10⁻⁶ | -- |
| 4 | 4-PK-s-AuNP | 4 nm | 60 | 1.46 ×10⁻⁹ | 420 |
| 5 | 13-PK-s-AuNP | 13 nm | 826 | 8.64 ×10⁻¹¹ | 516 |
| 6 | 20-PK-s-AuNP | 20 nm | 1,498 | 1.18 ×10⁻¹² | 20,819 |
| 7 | 4-PK-l-AuNP | 4 nm | 113 | 1.95 ×10⁻¹¹ | 2,895 |
| 8 | 13-PK-l-AuNP | 13 nm | 1,298 | 6.84 ×10⁻¹³ | 7,186 |
| 9 | 20-PK-l-AuNP | 20 nm | 1,970 | 2.54 ×10⁻¹³ | 12,750 |
Determined by the anthrone-sulfuric acid assay.
5. QCM
Quartz crystal microbalance (QCM) relies on a highly sensitive piezoelectric crystal whose resonant frequency changes with the mass. When the piezoelectric crystal is subjected to an applied voltage, it mechanically deforms and oscillates, and the oscillation at its resonant frequency is highly sensitive to the mass change on its surface.65–66 The high sensitivity of the piezoelectric crystal allows the mass change be calculated with great precision, and as such, QCM can detect monolayer surface coverage as low as 1 ng cm−2 Hz−1.67 The ability to detect minute mass changes has enable QCM to monitor molecular interactions. In this case, the piezoelectric crystal is coated with a gold film on which the ligands are immobilized. Interaction with the analyte molecules in the solution causes changes in mass on the sensor chip, which is detected as changes in frequency (ΔF). By monitoring ΔF vs. time and fitting the resulting sensogram to an appropriate binding isotherm, Kd or Ka can be obtained. Similar to SPR, QCM is a label-free method that does not require additional tags. With a liquid cell, the technique can be used to monitor real-time events allowing the studies of different conditions such as pH, temperature, ionic strength.68
Like SPR, QCM reports the binding events by measuring changes in a physical parameter, mass in this case, it is therefore an indirect method. Any events that cause changes in mass, like non-specific adsorptions of any species from solution to the sensor chip, will affect the experimental results. Also, detecting small mass changes is challenging as they do not produce sufficient frequency changes, and signal amplifications are therefore required to increase sensitivity. For binding interactions involving small molecules, one can compensate for the low mass changes by immobilizing the small molecules on the sensor chip and flow through the large biomolecules which have higher masses. Another approach is to increase the mass of the analyte by tagging it with a large molecule. For glyco-NPs – lectin systems, the sensitivity is not a concern as both glyco-NPs and lectins are high mass entities. In fact, nanomaterials are themselves mass tags that serve to greatly improve the signal intensities.
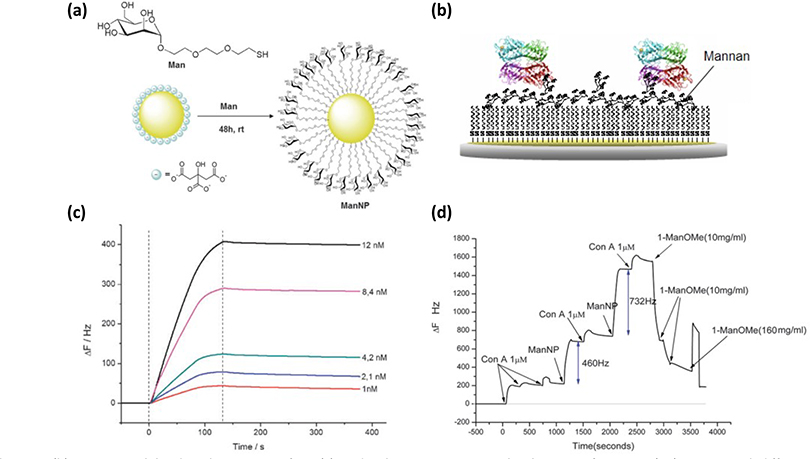
Barboiu and coworkers employed QCM to measure the binding constant of glyco-AuNPs (12 nm diameter, Fig. 8a) with Con A.69–70 In the experiment, Con A was immobilized on the sensor chip through a mannan layer (Fig. 8b). The QCM response was monitored as Man-AuNPs flowed over the sensor chip. Only mannoside and maltoside (Mal) generated changes in the signal, while glucoside and galactoside did not, which confirmed the binding selectivity. Binding constants were obtained by running a concentration series of glyco-AuNPs (Fig. 8c). By applying the Langmuir isotherm, Ka of 1.6 × 10⁷ M−1 and 7.2 × 10⁷ M−1 were obtained for Man-AuNP and Mal-AuNP, respectively. The authors also used the technique to build multilayers of Man-AuNP/Con A, and the formation of each layer was reflected in the change in QCM frequencies (Fig. 8d).
Fig. 8.
(a) Synthesis of glycol-AuNPs. (b) Con A immobilized on the sensor surface. (c) Binding kinetics monitoring the changes in frequency (ΔF) vs. time with different concentrations of Man-AuNPs. (d) Changes in frequency (ΔF) with the build-up of the multilayer. Reproduced from ref. 69 and 70 with permission from The Royal Society of Chemistry, copyright 2010 and 2013.
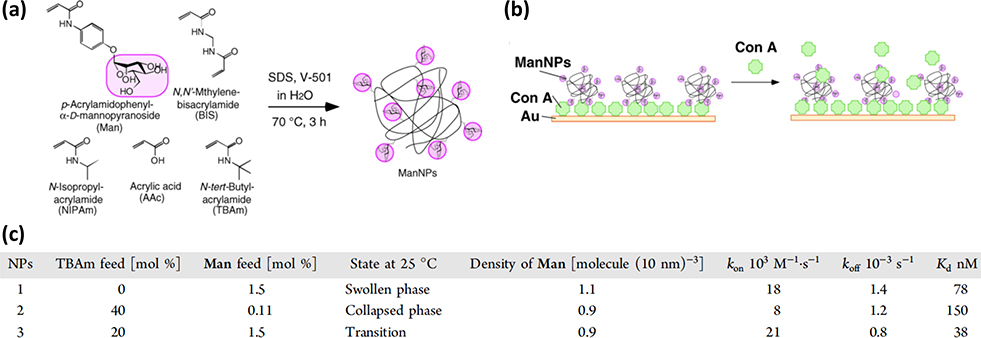
Miura and coworkers synthesized Man-functionalized poly-N-isopropylacrylamide (PNIPAm) nanoparticles, and studied how the conformation change of polymer chains impacted the binding kinetics with Con A by QCM.71 Different types of PNIPAm NPs, swollen, collapsed and transition phase, were prepared by changing the percent of N-tert-butylacrylamide (TBAm) in the polymerization feed (Fig. 9a). Man-PNIPAm NPs were immobilized on the QCM sensor chip through a Con A layer on the sensor chip (Fig. 9b). A concentration series of Con A was then flowed over the sensor chip, and the frequency changes were recorded with time. The binding was found to fit the Langmuir isotherm, from which the association (kon) and dissociation (koff) rates were obtained, and Kd was calculated (Kd = koff/kon, Fig. 9c). Results showed that the binding affinity of Man-PNIPAm NPs with Con A was 3–4 orders of magnitude stronger than the Man-Con A interactions. The swollen Man-PNIPAm NPs bound more tightly to Con A (78 nM, Entry 1) than its collapsed counterpart (150 nM, Entry 2). The authors attributed this to the flexible random-coil polymer chain conformation in the swollen state, which increased the chain mobility compared to the rigid conformation in the collapsed state. The high flexibility of swollen NPs increased the probability of Man ligand on the polymer to bind faster with Con A. Indeed, the kon of the swollen state (18 × 103 M−1 s−1, Entry 1) was higher than the collapsed state (8 × 10³ M−1 s−1, Entry 2), whereas the koff of the two were similar (1.4 × 10⁻³ s−1 and 1.2 × 10⁻³ s−1). The transition state NPs, NPs around the coil−globule phase transition temperature, showed an even stronger affinity than the swollen NPs, having the fastest kon and slowest kon, which resulted in the strongest binding (Entry 3).
Fig. 9.
(a) Synthesis of Man-PNIPAm NPs. (b) QCM sensor chip configuration. (c) QCM binding parameters. Reproduced from ref. 71 with permission from The American Chemical Society, copyright 2012.
6. DLS
Dynamic light scattering (DLS) is a well-established technique to characterize the hydrodynamic volume, zeta potential and molecular mass of dispersed particles of broad sizes ranging from μm to nm.72–73 DLS is based on the Brownian motion, the random movement of particles in all directions, in dilute solutions in the absence of particle – particle interactions such that the speed of particle movement depends only on the particle size. When a monochromatic light illuminates the solution, light scattered by particles in motion causes either destructive or constructive interferences. This leads to a time-dependent fluctuation in the intensity of the scattered light, which is directly related to the rate of particle diffusion. In a fixed solvent and constant temperature, the hydrodynamic volume of the particles can be calculated from the diffusion rate of particles.
Like SPR and QCM, DLS is also a non-destructive and label-free technique, which does not require modification of the analyte with a tag molecule. It requires only small amount of materials, with either simple or no sample preparation. The experiment is quick to performance, taking only a few minutes from start to finish. The quantitative analysis of DLS is based on the assumption that the particles do not interact with each other through collisions or electrostatic forces, and therefore, dilute suspensions (0.0001 – 1% v/v) should be used to avoid particle – particle collisions or interactions. DLS computes the hydrodynamic volume of the particle in contact with the solvent molecules, and as such, it may not reflect the exact size of the particle core. The computed hydrodynamic diameters depend on how the particles behave in the presence of the solvent molecules: the nature of the interactions, swelling or shrinking. As DLS derives the hydrodynamic diameter assuming a spherical shape of the particles, it works the best for spherical particles of low dispersity.74 Also, samples should be free of particulate contaminants like dust particles to avoid artifacts.
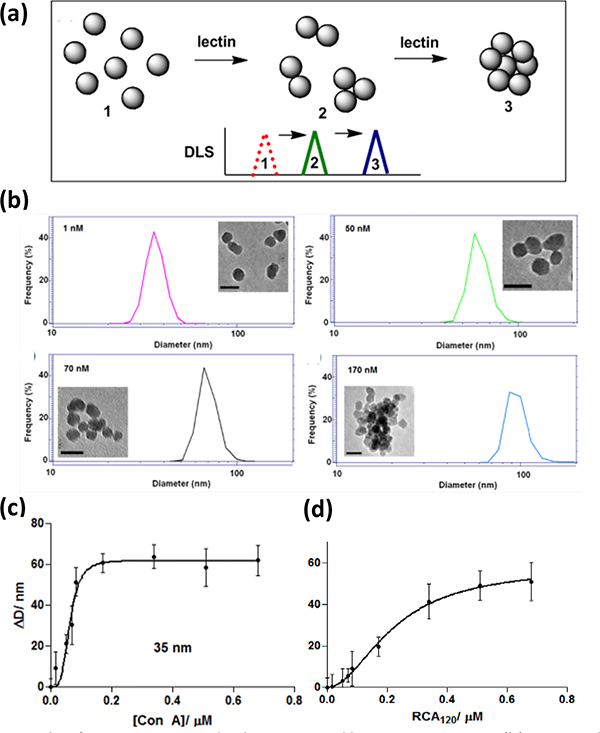
DLS has been used to study the interactions and determine the binding affinity of glyco-NPs with lectins. The working principle is that interactions of the multivalent lectin with the multivalent glyco-NPs would result in the formation of crosslinked agglomerates thus an increase in the particle size in a concentration-dependent fashion (Fig. 10a). This provides a fast and convenient way to qualitatively test for binding specificity and selectivity through particle size analysis, as the particle size of glyco-NPs would increase with interacting lectins whereas the size remains unchanged with non-interacting lectins.28, 56, 75–80 For quantitative analysis, the particle size is generally measured against varying concentrations of the lectin. The data is then fit to an appropriate binding isotherm, from which Kd can be obtained. One requirement of this method is that the agglomerates should not exceed the limit where the gravitational force becomes dominant when the agglomerates would precipitate or sediment.
Fig. 10.
(a) Principle of using DLS to study glyco-NPs and lectin interactions. (b) DLS graphs and TEM images (scale bars: 50 nm) of Man-SNPs treated with varying concentrations of Con A. (c) Increase in particle size (ΔD) of Man-SNPs after adding varying concentration of Con A. (d) Increase in particle size (ΔD) of Gal-SNPs after adding varying concentration of RCA120. In (c) and (d), the circles were experimental data and lines were the Hill fitting curves. Reproduced from ref. 81 with permission from The Royal Society of Chemistry, copyright, 2011.
We carried out the first feasibility study using DLS to measure the binding affinity between Man-SNPs and Con A.81 Man-SNPs were treated with various concentrations of Con A. The TEM images in Fig. 10b showed that the particles agglomerated with the addition of Con A, and the size of the agglomerates increased with increasing concentration of Con A. The DLS and the TEM results were consistent, showing that the particle size increased with the Con A concentration. More importantly, only one peak was observed indicating a relatively homogeneous crosslinking process and the absence of multiple modes of binding. Subsequently, titration experiments were carried out between Man-SNPs with Con A, and Gal-SNPs with Ricinus communis agglutinin (RCA120). We had previously demonstrated that Gal-NPs interacted with RCA120 to form agglomerates.33, 82–84 Indeed, a concentration-dependent change in the particle diameter (ΔD) was obtained (Fig. 10c–d). The data fitted the Hill binding model, from which Kd was calculated.
The binding affinity of 35 nm Man-SNPs and 40 nm Man-AuNPs with Con A, at 63 and 86 nM, respectively (Entries 1 & 4, Table 10), were more than 3 orders of magnitude higher compared to Man with Con A. This represents an affinity enhancement EF of 9 and 6, respectively, again demonstrating the multivalency effects of the nanoparticle scaffold to amplify the binding affinity of free carbohydrate ligands. The affinity enhancement was much smaller for larger particles (Entries 2 & 3). Contrary to our previous studies on Man-AuNPs, the binding affinity decreased with increasing particle size despite the higher number of ligands on the larger particles (Entries 3 vs. 2 vs. 1). This indicated that few surface ligands participated in binding with Con A, hinting that the ligands on larger nanoparticles were less accessible to the lectins. Consequently, when the ligand density was taken into consideration, the affinity enhancement EF was significantly lower, at 0.2 (Entry 2) and 0.01 (Entry 3) for Man-SNPs of 110 and 470 nm, respectively.
Table 10.
Binding parameters of glyco-NP-lectin interactions obtained from DLS.81
| Entry | Glyco-NP | Particle size | Ligand density | Lectin | Kd (μM) | EFa |
|---|---|---|---|---|---|---|
| 1 | Man-SNP | 35 nm | 830 | Con A | 0.063 | 9 |
| 2 | 110 nm | 2,600 | Con A | 0.97 | 0.2 | |
| 3 | 470 nm | 4,900 | Con A | 9.2 | 0.01 | |
| 4 | Man-AuNP | 40 nm | 950 | Con A | 0.086 | 6 |
| 5 | Gal-SNP | 35 nm | 840 | RCA120 | 0.22 | 2 |
KD: 470 μM (Man-Con A); 455 μM (Gal- RCA120)
7. Conclusions
This Feature article summarized the methods developed by us and others to measure the binding affinity of glyco-NPs with lectins: fluorescence competition assays, FRET, fluorescence quenching, ITC, SPR, QCM and DLS. These methods depend on changes in particular physical properties upon binding of glyco-NPs with the lectin, as such, a “translation” process is needed to convert the changes in the physical property to the binding affinity. The difference in the underlying physical principles associated with each technique is reflected in that the binding results differed even for the same glyco-NPs – lectin pairs. For fluorescence, ITC and DLS, both the glyco-NPs and the lectin are in solution, whereas for microarrays, SPR and QCM, the lectins are immobilized on a solid surface. This effectively decreases the number of available binding sites on lectins for binding with the glyco-NPs as some binding sites may not be available when tethered on a surface. Also affected is the degree of freedom and the steric hindrance introduced by the solid substrate. On the other hand, compared to the free lectins in solution, immobilization reduces the mobility and can potentially enhance binding by increasing the cooperativity in ligand-lectin association and lowering the entropic cost. For SPR and QCM that both require high mass entities to generate sufficient signals, the glyco-NPs are perfect candidates for these techniques. It was estimated that ~6,000% increase in QCM signal amplification can be expected for the 12 nm AuNP having 53,000 Au atoms.69
The selection of the appropriate method(s) will depend on the specific glyco-NPs – lectin system, the ease of introducing the tags and the availability of the instrument. Just like any other systems, using multiple methods is always advantageous especially when the methods can provide additional binding parameters beyond Kd. For instance, ITC gives the thermodynamic parameters where the enthalpic and entropic contributions to the overall binding interactions can be clearly seen. SPR and QCM can reveal the kinetics of the binding interactions as well as the rates of association and dissociation, which provide more detailed insights on the binding process.
From the examples provided, although different analytical methods gave different results, it is evident that the same general trend has been observed in all studies, that is, conjugating carbohydrates to nanoparticles significantly increased their affinities for lectin binding. Even low ligand densities gave rise to a marked increase in binding affinity, demonstrating the ability of nanomaterials to act as multivalent scaffolds in amplifying the binding affinity of carbohydrates with lectins. The affinity generally increased further with the ligand density. At high ligand density, the data were inconclusive. Some studies reported higher affinity whereas in other cases, the affinity decreased at the highest ligand density. In addition to the difference in the underlying physical principle of the method used, the systems were also different with regard to the glyco-NPs and lectins. As such, care must be taken when comparing results across different systems.
The binding affinity was also affected by the particle size and how the carbohydrate ligands are displayed on the nanoparticles, which depend not only on the ligand density but also the conjugation chemistry and linker length. Although a large number of different types of nanomaterials have been developed, these studies primarily used AuNPs for their relatively ease of preparation and high reproducibility. Even so, the particle sizes were not entirely uniform. Additionally, very little is known about how the ligands are presented on the nanoparticle surface, such as the ligand – ligand spacing, ligand conformation, the precise surface composition, and heterogeneity. In this regard, nanomaterials having well-define size, shape, surface composition will be an important starting point to produce glyconanomaterials with precise surface ligand composition, density and conformation. The availability of such precise systems will then permit the analysis of binding affinities with high accuracy, which in turn will provide us with comprehensive understanding of the multivalency in glyconanomaterials and to compare across platforms. Such knowledge will no doubt be important not only to the field in general but also in the rational design of effective glyconanomaterials for biomedical applications.
Acknowledgements
The authors thank the financial support from NIH (R15GM128164).
Footnotes
Conflicts of interest
There are no conflicts to declare.
Notes and references
- 1.Costerton JW; Irvin RT; Cheng KJ, The bacterial glycocalyx in nature and disease. Annu. Rev. Microbiol 1981, 35, 299–324. [DOI] [PubMed] [Google Scholar]
- 2.Hoyle BD; Jass J; Costerton JW, The biofilm glycocalyx as a resistance factor. J. Antimicrob. Chemother 1990, 26, 1–5. [DOI] [PubMed] [Google Scholar]
- 3.Reitsma S; Slaaf DW; Vink H; van Zandvoort MA; oude Egbrink MG, The endothelial glycocalyx: composition, functions, and visualization. Pflugers Arch. 2007, 454, 345–59. [DOI] [PMC free article] [PubMed] [Google Scholar]
- 4.Karlsson KA, Bacterium-host protein-carbohydrate interactions and pathogenicity. Biochem. Soc. Trans, 1999, 27, 471–4. [DOI] [PubMed] [Google Scholar]
- 5.Tarbell JM; Cancel LM, The glycocalyx and its significance in human medicine. J. Intern. Med 2016, 280, 97–113. [DOI] [PubMed] [Google Scholar]
- 6.Yao H; Song Y; Chen Y; Wu N; Xu J; Sun C; Zhang J; Weng T; Zhang Z; Wu Z; Cheng L; Shi D; Lu X; Lei J; Crispin M; Shi Y; Li L; Li S, Molecular architecture of the SARS-CoV-2 virus. Cell, 2020. [DOI] [PMC free article] [PubMed] [Google Scholar]
- 7.Lis H; Sharon N, Lectins: Carbohydrate-Specific Proteins that Mediate Cellular Recognition. Chem. Rev 1998, 98, 637–674. [DOI] [PubMed] [Google Scholar]
- 8.Lee RT; Lee YC, Affinity enhancement by multivalent lectin-carbohydrate interaction. Glycoconj. J 2000, 17, 543–51. [DOI] [PubMed] [Google Scholar]
- 9.Pieters RJ, Maximizing multivalency effects in protein-carbohydrate interactions. Org. Biomol. Chem 2009, 7, 2013–2025. [DOI] [PubMed] [Google Scholar]
- 10.Simanek EE; McGarvey GJ; Jablonowski JA; Wong CH, Selectin-Carbohydrate Interactions: From Natural Ligands to Designed Mimics. Chem. Rev 1998, 98, 833–862. [DOI] [PubMed] [Google Scholar]
- 11.Muller C; Despras G; Lindhorst TK, Organizing multivalency in carbohydrate recognition. Chem. Soc. Rev 2016, 45, 3275–302. [DOI] [PubMed] [Google Scholar]
- 12.Mammen M; Choi SK; Whitesides GM, Polyvalent Interactions in Biological Systems: Implications for Design and Use of Multivalent Ligands and Inhibitors. Angew. Chem. Int. Ed 1998, 37, 2754–2794. [DOI] [PubMed] [Google Scholar]
- 13.Brewer CF, Lectin cross-linking interactions with multivalent carbohydrates. Adv. Exp. Med. Biol 2001, 491, 17–25. [DOI] [PubMed] [Google Scholar]
- 14.Bernardi A; Jiménez-Barbero J; Casnati A; De Castro C; Darbre T; Fieschi F; Finne J; Funken H; Jaeger K-E; Lahmann M; Lindhorst TK; Marradi M; Messner P; Molinaro A; Murphy PV; Nativi C; Oscarson S; Penadés S; Peri F; Pieters RJ; Renaudet O; Reymond J-L; Richichi B; Rojo J; Sansone F; Schäffer C; Turnbull WB; Velasco-Torrijos T; Vidal S; Vincent S; Wennekes T; Zuilhof H; Imberty A, Multivalent glycoconjugates as anti-pathogenic agents. Chem. Soc. Rev, 2013, 42, 4709–4727. [DOI] [PMC free article] [PubMed] [Google Scholar]
- 15.Kitov PI; Sadowska JM; Mulvey G; Armstrong GD; Ling H; Pannu NS; Read RJ; Bundle DR, Shiga-like toxins are neutralized by tailored multivalent carbohydrate ligands. Nature, 2000, 403, 669–72. [DOI] [PubMed] [Google Scholar]
- 16.Pieters RJ, Maximising multivalency effects in protein-carbohydrate interactions. Org. Biomol. Chem, 2009, 7, 2013–25. [DOI] [PubMed] [Google Scholar]
- 17.Gonzalez-Cuesta M; Ortiz Mellet C; Garcia Fernandez JM, Carbohydrate supramolecular chemistry: beyond the multivalent effect. Chem. Commun, 2020, 56, 5207–5222. [DOI] [PubMed] [Google Scholar]
- 18.Hernáiz MJ; de la Fuente JM; Barrientos ÁG; Penadés S, A Model System Mimicking Glycosphingolipid Clusters to Quantify Carbohydrate Self-Interactions by Surface Plasmon Resonance. Angew. Chem. Int. Ed, 2002, 41, 1554–1557. [DOI] [PubMed] [Google Scholar]
- 19.Marradi M; Chiodo F; Garcia I; Penades S, Glyconanoparticles as multifunctional and multimodal carbohydrate systems. Chem. Soc. Rev, 2013, 42. [DOI] [PubMed] [Google Scholar]
- 20.Wang X; Liu L-H; Ramstrom O; Yan M, Engineering nanomaterial surfaces for biomedical applications. Exp. Biol. Med 2009, 234, 1128–1139. [DOI] [PMC free article] [PubMed] [Google Scholar]
- 21.Sunasee R; Adokoh CK; Darkwa J; Narain R, Therapeutic potential of carbohydrate-based polymeric and nanoparticle systems. Expert Opin Drug Deliv, 2014, 11, 867–84. [DOI] [PubMed] [Google Scholar]
- 22.Chen X; Ramstrom O; Yan M, Glyconanomaterials: Emerging applications in biomedical research. Nano Res. 2014, 7, 1381–1403. [DOI] [PMC free article] [PubMed] [Google Scholar]
- 23.Ramstroem O; Yan M, Glyconanomaterials for Combating Bacterial Infections. Chem. Eur. J. 2015, 21, 16310–16317. [DOI] [PMC free article] [PubMed] [Google Scholar]
- 24.El-Boubbou K; Huang X, Glyco-nanomaterials: translating insights from the “sugar-code” to biomedical applications. Curr Med Chem, 2011, 18, 2060–78. [DOI] [PubMed] [Google Scholar]
- 25.Hong SY; Green MLH; Davis BG, In Petite and Sweet: Glyco-Nanotechnology as a Bridge to New Medicines, ed. Huang X and Barchi J, American Chemical Society, Washington, DC, 2011, Recent Biotechnological Applications of Glyco-Nanomaterials, 1–13. [Google Scholar]
- 26.Lin P-C; Adak AK; Lin C-C In the molecular immunology of complex carbohydrates-3, ed. Wu Albert M., Springer; US, Boston, 2011, Fabrication and Applications of Glyconanomaterials, 727–755. [DOI] [PubMed] [Google Scholar]
- 27.Gim S; Zhu Y; Seeberger PH; Delbianco M, Carbohydrate-based nanomaterials for biomedical applications. Wiley Interdiscip. Rev. Nanomed. Nanobiotechnol, 2019, 11, 1558. [DOI] [PubMed] [Google Scholar]
- 28.Hao N; Neranon K; Ramstrom O; Yan M, Glyconanomaterials for biosensing applications. Biosens. Bioelectron 2016, 76, 113–130. [DOI] [PMC free article] [PubMed] [Google Scholar]
- 29.Wang X; Ramstroem O; Yan M, Glyconanomaterials: Synthesis, Characterization, and Ligand Presentation. Adv. Mater 2010, 22, 1946–1953. [DOI] [PMC free article] [PubMed] [Google Scholar]
- 30.Eftink MR, In Methods in Enzymology, ed. Brand Ludwig and Johnson MiChael L.., Academic Press, 1997, Fluorescence methods for studying equilibrium macromolecule-ligand interactions, 221–257. [DOI] [PubMed] [Google Scholar]
- 31.Mandal DK; Kishore N; Brewer CF, Thermodynamics of Lectin-Carbohydrate Interactions. Titration Microcalorimetry Measurements of the Binding of N-Linked Carbohydrates and Ovalbumin to Concanavalin A. Biochemistry, 1994, 33, 1149–1156. [DOI] [PubMed] [Google Scholar]
- 32.Wang X; Ramstroem O; Yan M, A photochemically initiated chemistry for coupling underivatized carbohydrates to gold nanoparticles. J. Mater. Chem, 2009, 19, 8944–8949. [DOI] [PMC free article] [PubMed] [Google Scholar]
- 33.Wang X; Ramström O; Yan M, Quantitative Analysis of Multivalent Ligand Presentation on Gold Glyconanoparticles and the Impact on Lectin Binding. Anal. Chem 2010, 82, 9082–9089. [DOI] [PMC free article] [PubMed] [Google Scholar]
- 34.Lee RT; Lee YC, Carbohydrate-Protein Interactions: Basis of Glycobiology. Acc. Chem. Res 1995, 28, 321–327. [Google Scholar]
- 35.Wang X; Matei E; Deng L; Ramstrom O; Gronenborn AM; Yan M, Multivalent glyconanoparticles with enhanced affinity to the anti-viral lectin Cyanovirin-N. Chem. Commun 2011, 47, 8620–8622. [DOI] [PMC free article] [PubMed] [Google Scholar]
- 36.Xie S; Lopez SA; Ramstroem O; Yan M; Houk KN, 1,3-Dipolar Cycloaddition Reactivities of Perfluorinated Aryl Azides with Enamines and Strained Dipolarophiles. J. Am. Chem. Soc 2015, 137, 2958–2966. [DOI] [PMC free article] [PubMed] [Google Scholar]
- 37.Xie S; Zhou J; Chen X; Kong N; Fan Y; Zhang Y; Hammer G; Castner DG; Ramstrom O; Yan M, A Versatile Catalyst-Free Perfluoroaryl Azide-Aldehyde-Amine Conjugation Reaction. Mater Chem Front 2019, 3, 251–256. [DOI] [PMC free article] [PubMed] [Google Scholar]
- 38.Kong N; Xie S; Zhou J; Menéndez M; Solís D; Park J; Proietti G; Ramström O; Yan M, Catalyst-Free Cycloaddition Reaction for the Synthesis of Glyconanoparticles. ACS Appl. Mater. Inter 2016, 8, 28136–28142. [DOI] [PubMed] [Google Scholar]
- 39.Kong N; Zhou J; Park J; Xie S; Ramström O; Yan M, Quantitative Fluorine NMR To Determine Carbohydrate Density on Glyconanomaterials Synthesized from Perfluorophenyl Azide-Functionalized Silica Nanoparticles by Click Reaction. Anal. Chem, 2015, 87, 9451–9458. [DOI] [PubMed] [Google Scholar]
- 40.Brown PO; Botstein D, Exploring the new world of the genome with DNA microarrays. Nat. Genet 1999, 21, 33–37. [DOI] [PubMed] [Google Scholar]
- 41.MacBeath G, Protein microarrays and proteomics. Nat. Genet, 2002, 32, 526–532. [DOI] [PubMed] [Google Scholar]
- 42.Hirabayashi J; Yamada M; Kuno A; Tateno H, Lectin microarrays: concept, principle and applications. Chem. Soc. Rev, 2013, 42, 4443–4458. [DOI] [PubMed] [Google Scholar]
- 43.Feizi T; Fazio F; Chai W; Wong CH, Carbohydrate microarrays - a new set of technologies at the frontiers of glycomics. Curr Opin Struct Biol 2003, 13, 637–45. [DOI] [PubMed] [Google Scholar]
- 44.Rillahan CD; Paulson JC, Glycan Microarrays for Decoding the Glycome. Annu. Rev. Biochem, 2011, 80, 797–823. [DOI] [PMC free article] [PubMed] [Google Scholar]
- 45.Cheung VG; Morley M; Aguilar F; Massimi A; Kucherlapati R; Childs G, Making and reading microarrays. Nat. Genet, 1999, 21, 15–19. [DOI] [PubMed] [Google Scholar]
- 46.Wang X; Matei E; Deng L; Koharudin L; Gronenborn AM; Ramström O; Yan M, Sensing lectin-glycan interactions using lectin super-microarrays and glycans labeled with dyedoped silica nanoparticles. Biosens. Bioelectron, 2013, 47, 258–264. [DOI] [PMC free article] [PubMed] [Google Scholar]
- 47.Sahoo H, Förster resonance energy transfer – A spectroscopic nanoruler: Principle and applications. J. Photochem. Photobiol. C, 2011, 12, 20–30. [Google Scholar]
- 48.Guo Y; Sakonsinsiri C; Nehlmeier I; Fascione MA; Zhang H; Wang W; Pöhlmann S; Turnbull WB; Zhou D, Compact, Polyvalent Mannose Quantum Dots as Sensitive, Ratiometric FRET Probes for Multivalent Protein–Ligand Interactions. Angew. Chem. Int. Ed, 2016, 55, 4738–4742. [DOI] [PMC free article] [PubMed] [Google Scholar]
- 49.Guo Y; Nehlmeier I; Poole E; Sakonsinsiri C; Hondow N; Brown A; Li Q; Li S; Whitworth J; Li Z; Yu A; Brydson R; Turnbull WB; Pöhlmann S; Zhou D, Dissecting Multivalent Lectin–Carbohydrate Recognition Using Polyvalent Multifunctional Glycan-Quantum Dots. J. Am. Chem. Soc. 2017, 139, 11833–11844. [DOI] [PMC free article] [PubMed] [Google Scholar]
- 50.Swierczewska M; Lee S; Chen X, The design and application of fluorophore-gold nanoparticle activatable probes. Phys Chem Chem Phys 2011, 13, 9929–9941. [DOI] [PMC free article] [PubMed] [Google Scholar]
- 51.Budhadev D; Poole E; Nehlmeier I; Liu Y; Hooper J; Kalverda E; Akshath US; Hondow N; Turnbull WB; Pöhlmann S; Guo Y; Zhou D, Glycan-Gold Nanoparticles as Multifunctional Probes for Multivalent Lectin-Carbohydrate Binding: Implications for Blocking Virus Infection and Nanoparticle Assembly. J. Am. Chem. Soc, 2020 [DOI] [PubMed] [Google Scholar]
- 52.Indyk L; Fisher HF, In Methods in Enzymology, ed. Ackers Gary K. and Johnson Michael L., Academic Press, 1998, Theoretical aspects of isothermal titration calorimetry, 350–364. [DOI] [PubMed] [Google Scholar]
- 53.Doyle ML, Characterization of binding interactions by isothermal titration calorimetry. Curr. Opin. Biotechnol, 1997, 8, 31–35. [DOI] [PubMed] [Google Scholar]
- 54.Bundle DR; Sigurskjold BW, In Methods in Enzymology, ed. Lee YC and Lee Reiko T.., Academic Press, 1994, Determination of accurate thermodynamics of binding by titration microcalorimetry, 288–305. [DOI] [PubMed] [Google Scholar]
- 55.Markova N; Hallén D, The development of a continuous isothermal titration calorimetric method for equilibrium studies. Anal. Biochem 2004, 331, 77–88. [DOI] [PubMed] [Google Scholar]
- 56.Wang X; Matei E; Gronenborn AM; Ramström O; Yan M, Direct Measurement of Glyconanoparticles and Lectin Interactions by Isothermal Titration Calorimetry. Anal. Chem 2012, 84, 4248–4252. [DOI] [PMC free article] [PubMed] [Google Scholar]
- 57.Reynolds M; Marradi M; Imberty A; Penadés S; Pérez S, Multivalent Gold Glycoclusters: High Affinity Molecular Recognition by Bacterial Lectin PA-IL. Chem. Eur. J, 2012, 18, 4264–4273. [DOI] [PubMed] [Google Scholar]
- 58.Homola J, Surface Plasmon Resonance Sensors for Detection of Chemical and Biological Species. Chem. Rev, 2008, 108, 462–493. [DOI] [PubMed] [Google Scholar]
- 59.Markey F, In Real-Time Analysis of Biomolecular Interactions: Applications of BIACORE, ed. Nagata K; Handa H, Springer, Tokyo, 2000, Principles of Surface Plasmon Resonance, 13–22. [Google Scholar]
- 60.Fan X; White IM; Shopova SI; Zhu H; Suter JD; Sun Y, Sensitive optical biosensors for unlabeled targets: A review. Anal. Chim. Acta 2008, 620, 8–26. [DOI] [PMC free article] [PubMed] [Google Scholar]
- 61.Englebienne P; Van Hoonacker A; Verhas M, Surface plasmon resonance: principles, methods and applications in biomedical sciences. Spectroscopy 2003, 17, 255–273. [Google Scholar]
- 62.Nguyen HH; Park J; Kang S; Kim M, Surface Plasmon Resonance: A Versatile Technique for Biosensor Applications. Sensors 2015, 15, 10481–10510. [DOI] [PMC free article] [PubMed] [Google Scholar]
- 63.Lin C-C; Yeh Y-C; Yang C-Y; Chen G-F; Chen Y-C; Wu Y-C; Chen C-C, Quantitative analysis of multivalent interactions of carbohydrate-encapsulated gold nanoparticles with concanavalin A. Chem. Commun, 2003, 2920–2921. [DOI] [PubMed] [Google Scholar]
- 64.Chien Y-Y; Jan M-D; Adak AK; Tzeng H-C; Lin Y-P; Chen Y-J; Wang K-T; Chen C-T; Chen C-C; Lin C-C, Globotriose-Functionalized Gold Nanoparticles as Multivalent Probes for Shiga-like Toxin. ChemBioChem 2008, 9, 1100–1109. [DOI] [PubMed] [Google Scholar]
- 65.Rodahl M; Höök F; Krozer A; Brzezinski P; Kasemo B, Quartz crystal microbalance setup for frequency and Q‐factor measurements in gaseous and liquid environments. Rev. Sci. Instrum, 1995, 66, 3924–3930. [Google Scholar]
- 66.O’Sullivan CK; Guilbault GG, Commercial quartz crystal microbalances – theory and applications. Biosens. Bioelectron, 1999, 14, 663–670. [Google Scholar]
- 67.Köβlinger C; Uttenthaler E; Drost S; Aberl F; Wolf H; Brink G; Stanglmaier A; Sackmann E, Comparison of the QCM and the SPR method for surface studies and immunological applications. Sens. Actuators B. Chem, 1995, 24, 107–112. [Google Scholar]
- 68.Marx KA, Quartz Crystal Microbalance: A Useful Tool for Studying Thin Polymer Films and Complex Biomolecular Systems at the Solution−Surface Interface. Biomacromolecules 2003, 4, 1099–1120. [DOI] [PubMed] [Google Scholar]
- 69.Mahon E; Aastrup T; Barboiu M, Multivalent recognition of lectins by glyconanoparticle systems. Chem. Commun 2010, 46, 5491–5493. [DOI] [PubMed] [Google Scholar]
- 70.Mahon E; Mouline Z; Silion M; Gilles A; Pinteala M; Barboiu M, Multilayer lectin–glyconanoparticles architectures for QCM enhanced detection of sugar–protein interaction. Chem. Commun, 2013, 49, 3004–3006. [DOI] [PubMed] [Google Scholar]
- 71.Hoshino Y; Nakamoto M; Miura Y, Control of Protein-Binding Kinetics on Synthetic Polymer Nanoparticles by Tuning Flexibility and Inducing Conformation Changes of Polymer Chains. J. Am. Chem. Soc 2012, 134, 15209–15212. [DOI] [PubMed] [Google Scholar]
- 72.Pecora R, Dynamic Light Scattering Measurement of Nanometer Particles in Liquids. J. Nanopart. Res, 2000, 2, 123–131. [Google Scholar]
- 73.Stetefeld J; McKenna SA; Patel TR, Dynamic light scattering: a practical guide and applications in biomedical sciences. Biophys Rev 2016, 8, 409–427. [DOI] [PMC free article] [PubMed] [Google Scholar]
- 74.Wolfenden M; Cousin J; Nangia-Makker P; Raz A; Cloninger M, Glycodendrimers and Modified ELISAs: Tools to Elucidate Multivalent Interactions of Galectins 1 and 3. Molecules 2015, 20, 7059–7096. [DOI] [PMC free article] [PubMed] [Google Scholar]
- 75.Keller AA; Wang H; Zhou D; Lenihan HS; Cherr G; Cardinale BJ; Miller R; Ji Z, Stability and Aggregation of Metal Oxide Nanoparticles in Natural Aqueous Matrices. Environ. Sci. Technol, 2010, 44, 1962–1967. [DOI] [PubMed] [Google Scholar]
- 76.Phenrat T; Saleh N; Sirk K; Tilton RD; Lowry GV, Aggregation and Sedimentation of Aqueous Nanoscale Zerovalent Iron Dispersions. Environ. Sci. Technol, 2007, 41, 284–290. [DOI] [PubMed] [Google Scholar]
- 77.Rubin J; San Miguel A; Bommarius AS; Behrens SH, Correlating Aggregation Kinetics and Stationary Diffusion in Protein−Sodium Salt Systems Observed with Dynamic Light Scattering. J. Phys. Chem. B, 2010, 114, 4383–4387. [DOI] [PubMed] [Google Scholar]
- 78.Sánchez-Pomales G; Morris TA; Falabella JB; Tarlov MJ; Zangmeister RA, A lectin-based gold nanoparticle assay for probing glycosylation of glycoproteins. Biotechnol. Bioeng 2012, 109, 2240–2249. [DOI] [PubMed] [Google Scholar]
- 79.Wang X; Norberg O; Deng L; Ramström O; Yan M, In Petite and Sweet: Glyco-Nanotechnology as a Bridge to New Medicines, ed. Huang Xufei and Barchi Joseph J.., American Chemical Society, 2011, Synthesis of Glyconanomaterials via Photo-Initiated Coupling Chemistry, 49–67. [Google Scholar]
- 80.Liu L-H; Dietsch H; Schurtenberger P; Yan M, Photoinitiated Coupling of Unmodified Monosaccharides to Iron Oxide Nanoparticles for Sensing Proteins and Bacteria. Bioconjug. Chem, 2009, 20, 1349–1355. [DOI] [PMC free article] [PubMed] [Google Scholar]
- 81.Wang X; Ramstrom O; Yan M, Dynamic light scattering as an efficient tool to study glyconanoparticle-lectin interactions. Analyst 2011, 136, 4174–4178. [DOI] [PMC free article] [PubMed] [Google Scholar]
- 82.Wang X; Ramström O; Yan M, Dye-doped silica nanoparticles as efficient labels for glycans. Chem. Commun. 2011, 47, 4261–4263. [DOI] [PMC free article] [PubMed] [Google Scholar]
- 83.Zhou J; Butchosa N; Jayawardena HSN; Park J; Zhou Q; Yan M; Ramström O, Synthesis of Multifunctional Cellulose Nanocrystals for Lectin Recognition and Bacterial Imaging. Biomacromolecules 2015, 16, 1426–1432. [DOI] [PMC free article] [PubMed] [Google Scholar]
- 84.Kong N; Park J; Yang X; Ramström O; Yan M, Carbohydrate Functionalization of Few-Layer Graphene through Microwave-Assisted Reaction of Perfluorophenyl Azide. ACS Appl. Bio Mater, 2019, 2, 284–291. [DOI] [PubMed] [Google Scholar]


