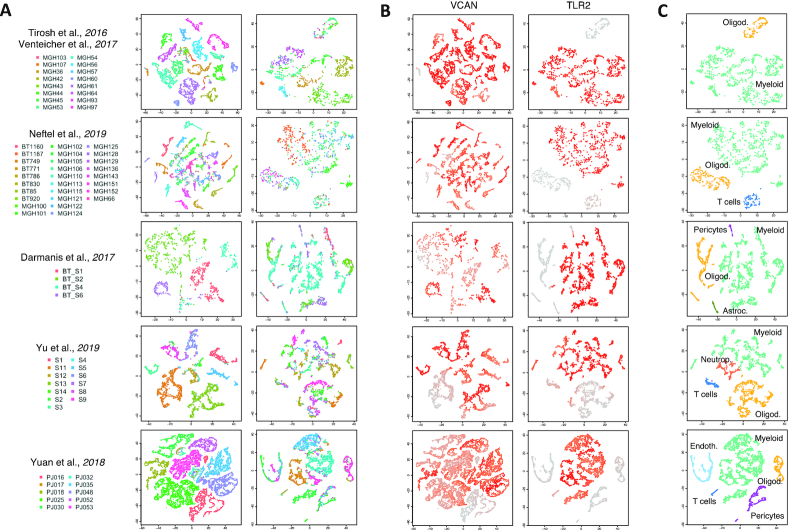
Figure 4:
VCAN-TLR2 interaction. t-distributed stochastic neighbor embedding (t-SNE) plots of tumor and non-tumor cells for each dataset analyzed. (A) Each cell is colored by patient (right, non-tumor, and left, tumor cells). (B) Each cell is colored according to expression value of the genes VCAN and TLR2 in tumor and non-tumor cells, respectively. (C) t-SNE plot of non-tumor cells colored according to cell type classification. Datasets are from [17, 22–26].

