Abstract
Purpose
To investigate the major organelles of the retinal pigment epithelium (RPE) in wild-type (WT, control) mice and their changes in pigmented Abca4 knockout (Abca4−/−) mice with in situ morphologic, spatial, and spectral characterization of live ex vivo flat-mounted RPE using multicolor confocal fluorescence microscopy (MCFM).
Methods
In situ imaging of RPE flat-mounts of agouti Abca4−/− (129S4), agouti WT (129S1/SvlmJ) controls, and B6 albino mice (C57BL/6J-Tyrc-Brd) was performed with a Nikon A1 confocal microscope. High-resolution confocal image z-stacks of the RPE cell mosaic were acquired with four different excitation wavelengths (405 nm, 488 nm, 561 nm, and 640 nm). The autofluorescence images of RPE, including voxel-by-voxel emission spectra, were acquired and processed with Nikon NIS-AR Elements software.
Results
The 3-dimensional multicolor confocal images provided a detailed visualization of the RPE cell mosaic, including its melanosomes and lipofuscin granules, and their varying characteristics in the different mice strains. The autofluorescence spectra, spatial distribution, and morphologic features of melanosomes and lipofuscin granules were measured. Increased numbers of lipofuscin and reduced numbers of melanosomes were observed in the RPE of Abca4−/− mice relative to controls.
Conclusions
A detailed assessment of the RPE autofluorescent granules and their changes ex vivo was possible with MCFM. For all excitation wavelengths, autofluorescence from the RPE cells was predominantly contributed by lipofuscin granules, while melanosomes were found to be essentially nonfluorescent. The red shift of the emission peak confirmed the presence of multiple chromophores within lipofuscin granules. The elevated autofluorescence levels in Abca4−/− mice correlated well with the increased number of lipofuscin granules.
Keywords: fundus autofluorescence, retinal pigment epithelium, confocal microscopy, ABCA4 knockout mouse, Stargardt disease
The retinal pigment epithelium (RPE) is a monolayer of pigmented cells adherent to the anterior side of Bruch's membrane (BrM). It plays a crucial role in human vision by serving many functions of the photoreceptor-RPE-choroid neurovascular unit. Defects in RPE function have been identified as the origin of the initiation and/or progression of multiple retinal diseases, including age-related macular degeneration (AMD).1,2 Organelles of the RPE, including melanosomes and lipofuscin granules, undergo physical and chemical changes with age and diseases and can potentially serve as a key biomarker for many retinal diseases.3–5 Lipofuscin in the RPE is a complex mixture of multiple fluorophores that derives its autofluorescent properties from bisretinoid compounds, which are metabolic by-products of vitamin A and the visual cycle.6 Bisretinoids are primarily formed in photoreceptor outer segments and slowly accumulate in the RPE as lipofuscin granules that increase with age or disease. N-retinyl-N-retinylidene ethanolamine (A2E), the most prominent component of lipofuscin, exerts multiple toxic effects on RPE cells and their functions.7–9 The toxicity of lipofuscin and A2E, together with its accumulation with age, is thought to contribute to degenerative diseases, including AMD and Stargardt disease.10,11 Stargardt disease has been further clinically characterized by high levels of lipofuscin caused by defects in the Abca4 transporter.12,13 Excessive accumulation of lipofuscin was also reported in Abca4 knockout (Abca4−/−) mouse models.14,15 Melanosome's role in protecting the RPE from light damage and light-generated oxygen reactive species has been well documented.16–18 Melanosomes undergo morphologic and photophysical alterations with age, primarily through fusing with lipofuscin to form melanolipofuscin complexes.19,20
Fundus autofluorescence (FAF) imaging is the routine clinical procedure for the monitoring of lipofuscin (short-wavelength [SW] FAF, excitation 488 nm, emission >500 nm) and melanin (near-infrared [NIR] autofluorescence [AF], excitation ∼790 nm, emission >810 nm) changes in RPE.21–23 A thorough understanding of the RPE fluorophores, including their emission properties, abundance, and contribution to FAF, is essential for accurate clinical interpretation. However, the contributing sources of FAF are not known at the granular level, and the specific emission properties of the major RPE organelles are still under debate. The literature reports inconclusive and contradictory findings regarding RPE melanin fluorescence in UV, visible, and NIR spectral ranges.24–26 A recent study indicates that NIR-AF is not an intrinsic property of melanin but instead could be contributed by melanin degradation products or even lipofuscin granules.27 Because lipofuscin contains multiple chromophores, multiple excitation wavelengths have begun to be used in the investigation of RPE autofluorescence. Delori et al.28 have reported a comparison between the AF spectrum of the human ocular fundus measured in vivo with ex vivo emission spectra acquired using multiple excitation wavelengths. However, this study only focused on comparing emission spectra, and no evidence was presented to identify the specific RPE fluorophores or granular origin. A multiwavelength investigation based on hyperspectral imaging and fluorescent lifetime imaging was also performed to study ex vivo the emission properties of the RPE fluorophores in human and animal retina samples.29,30 None of these approaches, however, were able to distinguish lipofuscin and nonlipofuscin granules or provide excitation/emission properties of the individual RPE organelles.
In this investigation, we used high-resolution multicolor confocal fluorescence microscopy (MCFM) for in situ visualization and spectral assessment of the principal RPE granules (melanosomes and lipofuscin granules) in live, flat-mounted mouse RPE. A cohort of 12-month-old agouti Abca4−/−, age-matched agouti wild-type (WT) control, and 9-month-old melanin-free B6 albino mice was used for the study. The high-resolution confocal imaging enabled the segmentation of individual RPE granules and allowed extraction of their morphology, location, and volumetric density. The multicolor excitation and point-by-point emission spectra provided spectral signatures of each organelle for different excitation wavelengths and yielded critical information regarding their contribution to normal low spatial resolution FAF.
Methods
Preparation of Flat-Mount for Ex Vivo Studies of RPE Cells Mosaic
Mice were cared for and handled in accordance with the protocol approved by the University of California Animal Care and Use Committee and ARVO. The right eyes of three WT agouti control (129S1/SvlmJ, 12-month-old females), three Abca4−/− mice (129S-Abca4tm1Ght/J, 12-month-old females), and two Black 6 albino (melanin-free) mice (C57BL/6J-Tyrc-Brd, 9-month-old females) were used for the ex vivo studies. All mice strains were obtained from the Jackson Laboratory (Sacramento, CA, USA). To prepare flat-mounts of live RPE for confocal imaging, after enucleation, the eye was immediately placed in a petri dish containing an ice-cold solution of Dulbecco's modified Eagle's medium (DMEM, with high glucose and no phenol red; 21-063-029; Thermo Fisher, Scientific, Waltham, MA) supplemented with 10% fetal bovine serum (FBS; 35010CV; Corning, Corning, NY) and NucBlue nuclear probe (two drops per milliliter of solution; R37605; Molecular Probes Thermo Fisher, Molecular Probes, Eugene, OR). The eye was then immediately dissected in this solution: the cornea was removed, followed by the muscle and connective tissues attached to the sclera and then the lens and the optic nerve. Four curvature-relieving cuts were made in the eyecup so that the eyecup resembled a four-leaf clover. Using small forceps, the retina was then gently peeled from the eyecup to expose the RPE layer. The remaining eyecup was then flattened scleral side down onto a translucent membrane (110614; Whatman, United Kingdom). The flat-mount on the membrane was transferred to a Lab-Tek II Chambered Coverglass (155379PK; Thermo Fisher) and placed RPE-side down directly on the cover glass for imaging using an inverted confocal microscope. A custom-weighted mesh was placed on top of the membrane, and fresh, ice-cold DMEM supplemented with 10% FBS was added to the chambered cover glass. The chambered cover glass was placed on the microscope stage, which was fitted with a LiveCell Stage Top Incubation System (Pathology Devices, Inc., San Diego, CA, USA). For the duration of imaging, the LiveCell system was set to maintain the temperature at 36°C, humidity at 60%, and 10% CO2.
Ex Vivo Imaging With Confocal Fluorescent Microscopy
High-resolution confocal images and emission spectra of the flat-mounted RPE were obtained using a Nikon A1 confocal microscope (Nikon, New York, NY, USA). The microscope was equipped with four lasers (405 nm, 488 nm, 561 nm, and 640 nm), allowing the acquisition of confocal fluorescence data for four different excitation wavelengths. A spectral detection unit (Nikon A1 DUS) allowed emission spectra measurements over the range of 475 to 750 nm in a 3-dimensional (3D), voxel-by-voxel manner. The imaging system allows confocal imaging to operate with or without spectral emission filters in the fluorescent emission path. The standard setting of the microscope makes use of a simple beam splitter on the excitation and emission path without the use of any emission filters but with physical stops blocking specific excitation wavelengths from reaching spectral detectors. All the images presented in this article were acquired with a 60× objective lens (Nikon, Plan Apo VC 60X, Water Immersion) having a numerical aperture of 1.2, which provides lateral and axial resolution in the range of ∼0.25 to ∼1 µm, respectively. Therefore, only organelles in the range of 0.25 µm or bigger can be reliably imaged and evaluated by our MCFM system. Image stacks comprised at least 20 confocal depth planes, acquired consecutively with a step size of 0.5 µm in the Z-direction, readily spanning the RPE, which is less than 10 µm thick, including surface microvillous processes. All postprocessing of the confocal images and spectral emission and intensity information was performed with Nikon NIS-Elements AR processing software operating on an independent workstation. The z-stacks were deconvolved with the 3D confocal point spread function to compensate for diffraction effect and chromatic aberration. The average area (size) and volume of the individual RPE cells and the distance between (spacing) RPE cells were calculated using the NIS-Elements software. The NIS-Elements AR software also allowed the measurement of the emission spectrum of each granule/organelle that appeared in the confocal fluorescence images. The feature “spectral unmixing” in the software allowed principal component analysis–based extraction of major contributing fluorophores from each voxel as well as the estimation of the total number of contributing fluorophores with their spectrum.31
Statistical Analysis
The results were presented as means with SE of three mice per group unless otherwise specified. Two-group comparisons were performed with ANOVA using PRISM software (Version 7.02; GraphPad Software, La Jolla, CA, USA). Differences with a P value of 0.05 or less were considered statistically significant.
Results
Ex Vivo Fluorescence Confocal Images Acquired Without Fluorescence Emission Filters Allowed the Visualization of Both Melanosomes and Lipofuscin Granules
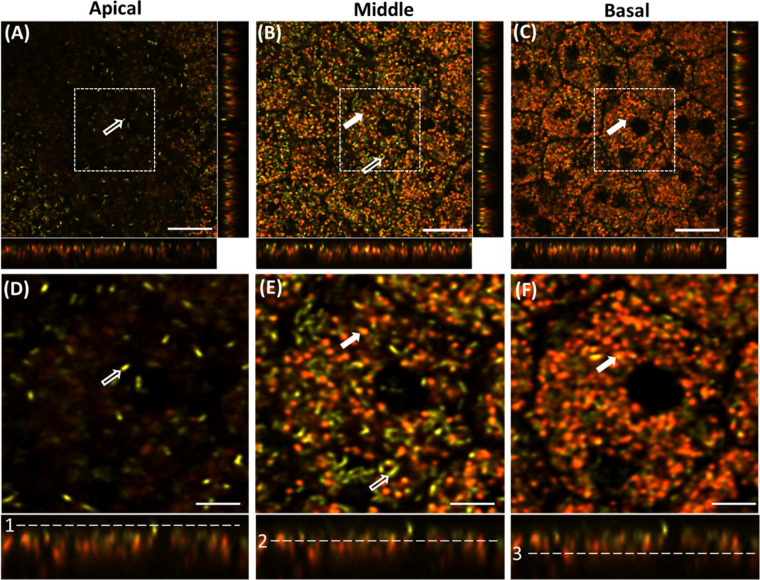
Confocal fluorescence images acquired from the apical, middle, and basal plane of the flat-mounted RPE of an Abca4−/− mouse (agouti background) with an excitation wavelength of 561 nm are shown in Figures 1A–C. Figures 1D–F represent the enlarged view of the image sections (white-dashed square) shown in Figures 1A–C. These representative images were acquired with no fluorescence emission filters. The color scale used to visualize these data was generated by NIS-Elements AR processing software and corresponds to the center of mass of the spectrum measured from each voxel. Figures 1A and 1D show that the apical side of the RPE is predominantly occupied by “green”-colored granules, whose spectrum is centered at the excitation wavelength. In the middle plane, both green- and orange-colored (red-shifted) granules were found (Figs. 1B, 1E). In the basal plane of RPE, the granules appeared mostly as orange-reddish. The designated positions (apical, middle, and basal) are marked relative to Bruch's membrane. The apical, middle, and basal planes are located above Bruch's membrane at approximately ∼10 µm, ∼5 µm, and ∼2 µm, respectively, toward the photoreceptors’ outer segments. Binucleated RPE cells with hexagonal shapes can be seen in Figure 1C. Based on the literature describing RPE organelles, the location (from apical to the middle of the RPE), and their elongated morphology, we deduced the green granules to be melanosomes (indicated by white hollow arrows). The other granules localized in the middle to basal plane and exhibiting red-shifted fluorescence are hypothesized to be lipofuscin granules (indicated by the solid arrows). These latter granules appeared to be mostly spherical and were heterogeneous in size (Fig. 1, solid white arrows). We did further experiments and analyses to test the hypothesis but will tentatively adopt the terms melanosomes and lipofuscin granules.
Figure 1.
Confocal image planes of the RPE mosaic of Abca4−/− mouse acquired at different depths with a 561-nm laser. The image strips at the bottom and right side of each (x, y) panel show the side views of the confocal three-dimensional image stack (x,z) and (y,z), respectively. (A) Apical side of RPE, (B) mid-RPE region, and (C) basal part of the RPE confocal image stack. (D–F) Enlarged images of the regions indicated by the white-dashed square boxes in A–F, respectively. Hollow white arrows indicate melanosomes, and solid white arrows indicate putative lipofuscin granules. White dashed lines in the bottom panel (1–3) show the position of the selected planes in the RPE volume: (1) apical, (2) middle, and (3) basal. Scale bars: 20 µm (A–C), 10 µm (D–F).
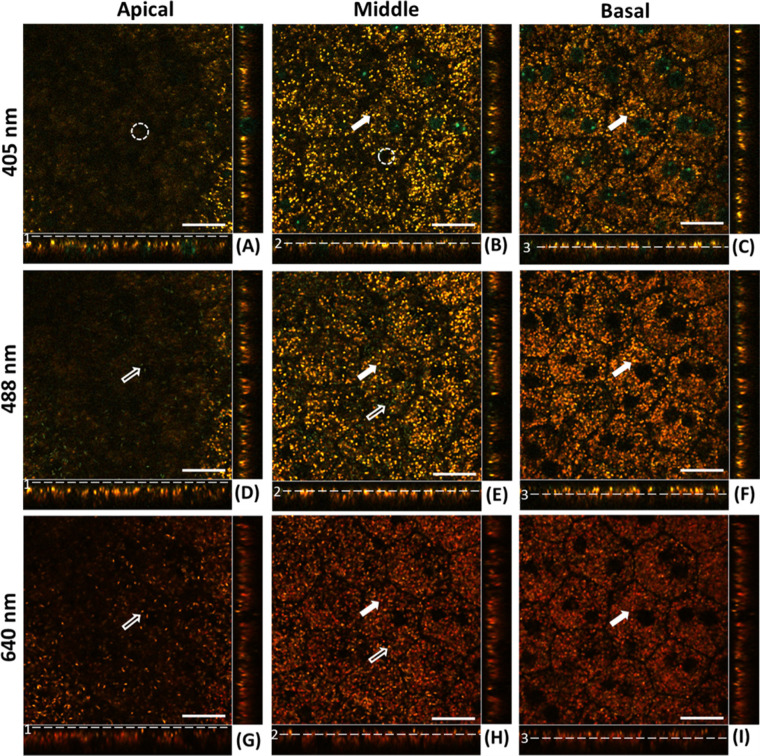
Confocal images acquired at the same three depth positions obtained with three additional excitation wavelengths (405 nm, 488 nm, and 640 nm) are shown in Figure 2 (magnified versions are presented in Supplementary Figs. S1–S3). The same granules can be observed in corresponding image planes (for different excitations) but with changing color and contrast. The melanosomes’ granules in the apical region of the RPE were not visible with 405-nm excitation images (Fig. 2A) but appeared with 488-nm (bluish-green) and 640-nm (red) excitation at the same wavelength as the excitation (Figs. 2D, 2G, hollow arrows). The presence of yellow-orange “lipofuscin” granules in some parts of the apical plane likely arises from the imperfect flattening of the sample or the imperfect sample preparation.
Figure 2.
Confocal image planes of the RPE mosaic of Abca4−/− mouse acquired with 405-nm, 488-nm, and 640-nm, excitation wavelengths, respectively. (A, D, G) Apical plain of RPE. (B, E, H) Mid-RPE region plane. (C, F, I) Basal plane of RPE. Image strips at the bottom and right side of each (x, y) panel show the side views of the confocal three-dimensional image stack (x,z) and (y,z), respectively. White solid arrows indicate the lipofuscin granules appearing in the middle and basal plane of the RPE. Hollow arrows indicate the melanosomes. Dashed white circles highlight the lack of fluorescence of the melanosomes when excited at 405 nm. Scale bars: 20 µm.
Both melanosomes and lipofuscin granules were present in the middle RPE planes acquired with 488-nm, 561-nm, and 640-nm excitations. Here, too, melanosomes are seen having the same apparent color as the excitation wavelength, whereas lipofuscin granules appear red-shifted with respect to the excitation wavelengths (Figs. 2B, 2E, 2H). Lipofuscin granules in the basal RPE plane are predominantly the same granules that extended from the middle plane and changed color from yellow to red when excitation wavelength changed from 405 to 488 nm, followed by 640 nm. The additional blue-green colored circles seen in 405-nm excitation images are the emission from the NucBlue nuclear stain (Hoechst 33342; Thermo Fisher Scientific, Waltham, MA, USA), allowing detection of the RPE cell nuclei (Figs. 2A–C).
Absence of Melanin-Like Granules in Confocal Images of Flat-Mounted RPE of Albino Mice
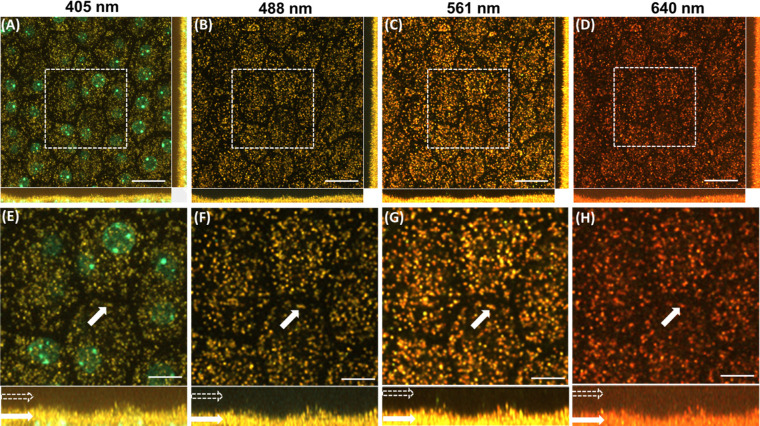
Confocal images of the RPE mosaic of a B6 albino mouse were acquired with the confocal system without emission filters. Figures 3A–D show the RPE mosaic images (depth intensity projection of RPE confocal image stack) acquired with the excitation wavelengths of 405 nm, 488 nm, 561 nm, and 640 nm, respectively. A comparison of the images in Figures 1 and 2 (Abca4−/− mouse on agouti background) shows melanosomes to be completely absent from the RPE albino mouse (Fig. 3), for images acquired with excitations of 488 nm, 561 nm, and 640 nm. The side view of the confocal image stacks in (x,z) and (y,z) planes further showed that melanosomes were absent in the apical side of the RPE (white hollow arrows in images show the apical part of the RPE). In contrast, yellow-orange-red colored lipofuscin granules were present and located in the midplane of the RPE for all four excitation wavelengths (white solid arrows in the images show the lipofuscin granules in the basal part of the RPE). This result strengthens the conclusion that the particles observed in the apical surface of the RPE of pigmented mice are melanosomes.
Figure 3.
Confocal images of RPE cells of an albino mouse (melanin free). Images acquired with excitation wavelengths of (A) 405 nm, (B) 488 nm, (C) 561 nm, and (D) 640 nm. (E–H) Magnified image of the dashed box shown in A–D. Hollow white arrows (in bottom panel) indicate the apical part of the RPE. Solid white arrows indicate representative lipofuscin granules in the basal part of the RPE. Scale bars: 20 µm (A–D), 10 µm (E–H).
Ex Vivo Confocal Images Acquired With Fluorescent Emission Filters Confirmed the Absence of Fluorescence From Melanosomes
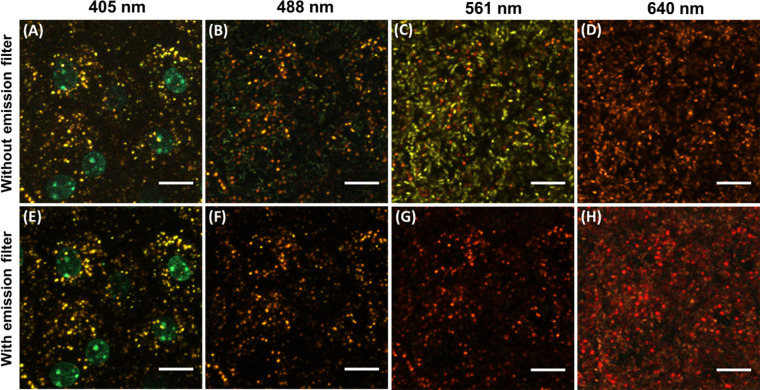
Confocal images of an RPE mosaic flat-mount of Abca4−/− mice acquired with and without fluorescent emission filters are shown in Figure 4. These images are cropped and enlarged for enhanced visualization of granules. Figures 4A–D represent images acquired with no dichroic fluorescence emission filters for 405-nm, 488-nm, 561-nm, and 640-nm excitation, respectively. Figures 4E–H present the corresponding confocal images acquired with fluorescence emission filters. No differences were observed between images acquired with 405-nm excitation with and without the emission filters (Figs. 4A, 4E). The melanosomes appeared as a weak bluish-green color in 488-nm excitation images (Fig. 4B) and were completely absent in Figure 4F. The 561-nm and 640-nm excitation provided better visualization of both RPE granules with standard settings (Fig. 4C and Fig. 4D). For these wavelengths, the melanosomes were found utterly absent in the images acquired with the fluorescence emission filter inserted (Figs. 4G, 4H). The emission filter allows fluorescence signals from the lipofuscin granules to pass through, and these granules were observed in all cases without any significant changes.
Figure 4.
Confocal images (depth intensity projection) of RPE mosaic of Abca4−/− for 405 nm, 488 nm, 561 nm, and 640 nm, respectively (A–D), have been acquired with standard settings (without emission filter). (E–H) Corresponding images acquired with fluorescent emission filters. Scale bars: 10 µm.
Confocal Imaging Reveals Changes in the Number of RPE Pigment Granules in Abca4−/− Relative to WT Control
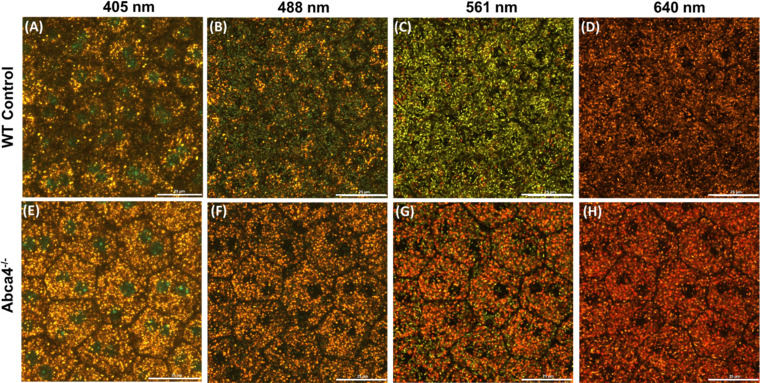
Confocal images of the RPE cell mosaic of an Abca4−/− and a WT control mouse were acquired with four different excitation wavelengths (Fig. 5). Figures 5A–D present images of the WT control acquired with 405 nm, 488 nm, 561 nm, and 640 nm, respectively, while Figures 5E–H present those of the Abca4−/− RPE for the same sequence of excitation wavelengths. It is evident from these images that there is a decreased number of melanosomes in the RPE of Abca4−/− mice relative to the WT. The images also show that the density of lipofuscin (yellow-orange-red colored) granules is increased in the RPE cells of Abca4−/− mice relative to the WT control.
Figure 5.
Confocal images (depth intensity projection) of the RPE cells mosaic from flat-mount of WT control (A–D) and Abca4−/− (E–H) for the excitation wavelengths of 405 nm (A, E), 488 nm (B, F), 561 nm (C, G), and 638 nm (D, H). There are a decreased number of melanosomes (green) and an increased density of lipofuscin granules (yellow-orange-red) in Abca4−/− as compared to WT. Scale bars: 25 µm.
The Peak Emission Wavelength of RPE Fluorophores Undergoes Excitation-Dependent Shifts
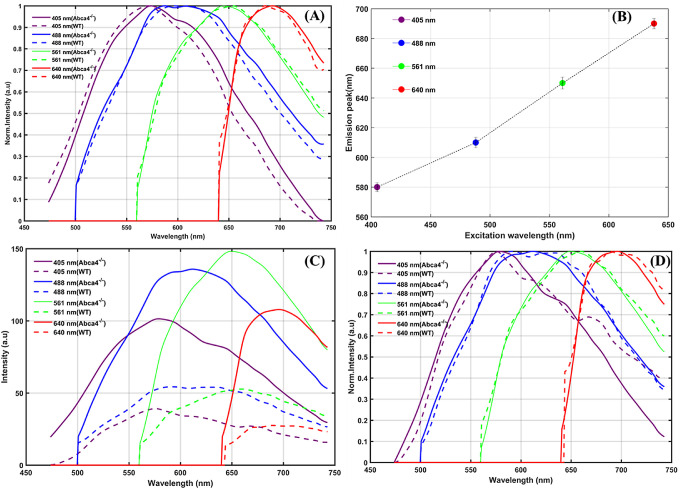
Averaged emission spectra of the lipofuscin granules from the confocal image stacks were generated (Fig. 6). The spectral shape of the emission spectra of lipofuscin granules for Abca4−/− and WT (average of 100 granules each) was found to be the same, essentially confirming their common origin (Fig. 6A). The emission peak of lipofuscin granule was red-shifted with the increase in excitation wavelengths (Figs. 6A, 6B). The emission peak wavelength was recorded as ∼580 nm, ∼610 nm, ∼650 nm, and 690 nm for the excitation wavelengths of 405 nm, 488 nm, 561 nm, and 640 nm, respectively. The averaged AF spectra obtained from the confocal image stacks over the whole RPE volume are provided in Figure 6C. An increase in the intensity of emission (for all excitation wavelengths) was observed in RPE cells from the flat-mounted outer retina of the Abca4−/− relative to the WT control (Fig. 6C). The AF levels (centered at 580 nm) were found ∼2.6 times higher with 405-nm excitation, ∼2.5 times higher for 488-nm excitation, ∼3 times higher for 561-nm excitation, and ∼3 times higher for 638-nm excitation for Abca4−/− relative to WT control. Figure 6D shows that the peak emission wavelengths of the emission spectra measured from the RPE confocal image stacks (RPE volume) are same as that of lipofuscin granules (Fig. 6A) for all excitation wavelengths. This indicates that the total AF measured from the RPE is predominantly contributed by the lipofuscin granules.
Figure 6.
Averaged emission spectra measured from the flat-mounted RPE for four different excitation wavelengths. (A) Average normalized emission spectra measured from individual lipofuscin granules of an Abca4−/− and a WT control. (B) Shifts in emission maximum of lipofuscin granules with different excitation. (C) Average emission spectra calculated from the whole RPE confocal volume acquired. (D) Normalized intensity spectra from C. Average emission spectrum of lipofuscin granule provided in A was calculated from 100 granules from two eyes of two mice of Abca4−/− and a WT control. The average emission spectra measured from RPE confocal volume provided in C were calculated from three eyes of three mice of Abca4−/− and a WT control.
Quantification of the RPE Cell Size and Density of Granules From Ex Vivo Fluorescence Confocal Images
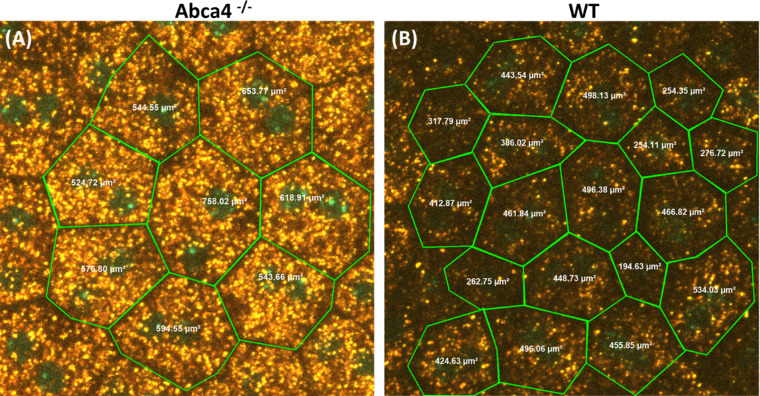
Lipofuscin granules were found to be concentrated in the cell region between the nuclei and lateral cell boundary. The preferred location of lipofuscin granules near the cellular border, along with the lipofuscin-free region between cells, allowed for accurate delineation of the size and shape of individual RPE cells, revealing the cells to be hexagonal. These features allowed the calculation of average size (area) and separation between the individual RPE cells (center-to-center distance between cells). Figure 7 illustrates the calculation of size of the RPE cells in Abca4−/− and WT agouti mice using NIS-Elements software.
Figure 7.
Representative images showing the average area calculation of the RPE cells from the confocal images of (A) Abca4−/− and (B) WT control mice using NIS-Elements software.
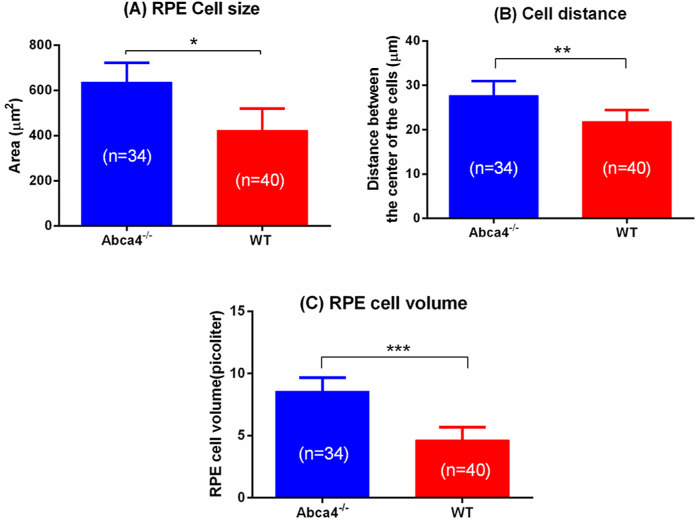
The average size of the RPE cells in Abca4−/− and WT controls was calculated from the confocal images, and the results are shown in Figure 8A. The average size (area) of the RPE cells of Abca4−/− and WT controls was 636.18 ± 80 µm2 and 422.07 ± 95 µm2, respectively. The average distance between the center of the RPE cells for Abca4−/− and WT controls was 27.73 ± 3.21 µm and 21.85 ± 2.59 µm, respectively (Fig. 8B). The average volume of RPE cells in Abca4−/− and WT controls was 8.586 ± 1.08 pL and 4.642 ± 1.045 pL, respectively (Fig. 8C).
Figure 8.
(A) Size of the RPE cells. (B) RPE cell separation. (C) Volume of RPE cells in Abca4−/− and WT controls. Error bars represent standard errors (*P < 0.001, **P < 0.005, and ***P < 0.001). Average and standard errors are calculated from 34 RPE cells of Abca4−/− and 40 RPE cells of WT from three eyes of three mice of each strain.
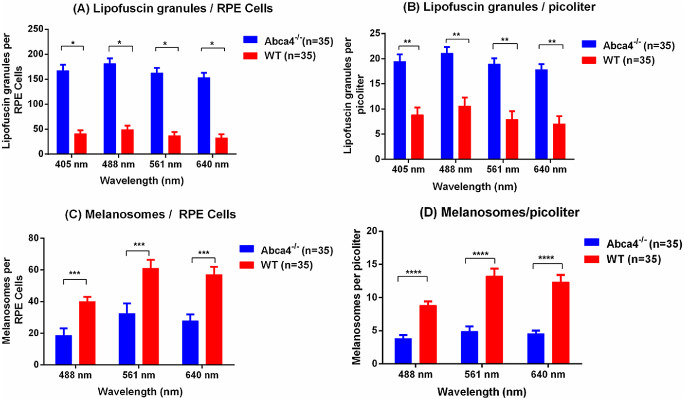
The average number of lipofuscin granules and melanosomes per RPE cell and per picoliter (density) within RPE cells was significantly different between Abca4−/− and WT controls at all wavelengths measured (Fig. 9). The density of lipofuscin granules is ∼2.3 times higher for 405-nm excitation, ∼2.2 times higher for 488-nm excitation, ∼2.4 times higher for 561-nm excitation, and ∼2.5 times higher for 640-nm excitation in Abca4−/− relative to WT control (Fig. 9B). The density of melanosomes in the agouti Abca4−/− is lower by a factor of ∼2.3 for excitation = 488 nm, ∼2.7 for excitation = 561 nm, and ∼2.6 for excitation = 640 nm compared with WT control (Fig. 8D).
Figure 9.
The average number of lipofuscin granules and melanosomes calculated from 35 RPE cells of Abca4−/− and 35 RPE cells of WT from three eyes of three mice of each strain. (A) The average number of lipofuscin granules per RPE cells was more than three times greater in Abca4−/− compared to WT control. (B) Lipofuscin granules (in picoliters) were more than twice as dense in Abca4−/− mice. (C) Conversely, the average number of melanosomes per RPE cells in Abca4−/− was roughly half what was seen in WT, and (D) the density of melanosomes (in picoliters) in Abca4−/− was roughly half what was seen in WT. Error bars represent standard errors (*P < 0.001, **P < 0.005, ***P < 0.01, and ****P < 0.01).
Discussion
High-resolution confocal fluorescent imaging of RPE cells in living flat-mounted retinas revealed the expected hexagonal, binucleate cells in all mouse strains examined. Confocal imaging without emission filters enabled the visualization of two distinct class of granules. The granules localized at the apical-to-middle region of the RPE cell volume (seen in 488-nm, 561-nm, and 640-nm excitation images) were present in the RPE of the Abca4−/− and WT controls (both mice were of agouti background). These granules were confirmed to be melanosomes by several lines of evidence: (a) their presence at the apical side of the RPE cells in the confocal images, (b) their absence in the ex vivo images of the RPE flat-mount of the B6 albino mouse (Fig. 3), (c) their elongated shapes,32 and (d) their dark appearance in the confocal images acquired with 405 nm due to the strong absorption by the melanin in UV/near-UV wavelength range. The inability of melanosomes to emit fluorescence over a broad spectral range of excitation (near UV [405 nm] to deep red [650 nm]) was confirmed by the following findings: (a) disappearance of melanosomes in the fluorescence confocal images acquired with the fluorescent emission filters used, (b) appearance of the melanosomes in the confocal images acquired without emission dichroic filters, and (c) presentation as the same color as the excitation wavelength. The light-scattering properties of melanosomes have been well studied with in vivo and ex vivo methods.33–35 The average size (r) of the RPE melanosomes varies from 600 nm to 1 µm in diameter, resulting in a size (diffraction) parameter x = 2πr/λ in the range of 6 to 16 (for λ = 405 to 650 nm), clearly placing melanosome scattering in the Mie scattering regime range.33 Therefore, we conclude that the appearance of the melanosomes in the confocal images (without emission filters) is due to Mie scattering from melanosomes.
The second class of pigmented granules exhibited classical red-shifted fluorescence with respect to the excitation wavelengths, as expected from the photochemical nature of fluorescence. The emission peak obtained for these granules was around 610 nm with 488-nm excitation. This is consistent with the reported emission peak measured for lipofuscin granules isolated from the human RPE (peak emission ∼630 nm for an excitation wavelength of 510 nm) and from the mouse eye (emission peak of ∼610 nm for 488-nm excitation).28,36 Therefore, it is reasonable to conclude that these granules, which are present primarily in the middle and basal region of RPE, are lipofuscin granules. The localization of the lipofuscin granules agrees well with the reported findings of the deposition of the lipofuscin granules at the basilar portion of the RPE cells and phagosomes’ motility from apical to basal of the mouse RPE cells.37–39 The emission peak of the lipofuscin granules shifted with the excitation wavelengths: emission ∼580 nm for excitation = 405 nm, emission ∼610 nm for excitation = 488 nm, emission ∼650 nm for excitation = 561 nm, and emission ∼690 nm for excitation = 640 nm, respectively (Fig. 6B). Accordingly, the apparent color of lipofuscin granules in the fluorescence confocal images changed from yellow to orange, followed by red, when the excitation wavelength was shifted from 405 nm to 638 nm. The different emission peaks for different excitation wavelengths confirm the presence of complex bisretinoid components associated with the lipofuscin granules. However, the confocal fluorescence could not resolve distinct chromophore components within the lipofuscin granules. The confocal images also showed that there is an increased accumulation of lipofuscin granules and decreased levels of melanin granules in the RPE of Abca4−/− mice relative to the control (Figs. 5, 8). The reduction in the melanosomes in these mice could be caused by the fusion of the melanosomes with lipofuscin to form melanolipofuscin, whose wide presence is reported in Abca4−/− mice strains.14,40 The confocal imaging, however, could not detect their presence and spectra separately in any of the excitation wavelengths used.
The emission spectra measured (for all excitations) revealed elevated AF emission from the flat-mounted RPE of Abca4−/− mice relative to WT controls (Fig. 6C). The elevated ex vivo spectra levels in Abca4−/− mice correlated with the increased number of lipofuscin granules measured from the same image volume acquired of Abca4−/− mice and was in good agreement with reported in vivo fundus AF spectra at 488-nm excitation.14,15 The hypothesis of lipofuscin toxicity on RPE cells could be tested by quantifying RPE cell number, where the RPE population was expected to decline as lipofuscin accumulated.41 The size (area) of the RPE cells was larger in Abca4−/− mice relative to WT controls (Figs. 7, 8). An increased RPE cell size and volume in Abca4−/− relative to the controls indicated a reduced number of cells within the same field of view. This could be due to the death of the RPE cells caused by the increased lipofuscin load. The constant number of cell nuclei (two per cell) suggests that RPE cells may increase in size rather than merge with their neighbors to fill the gaps left by dying cells. Overall, a comparison of the RPE cell mosaics suggests that the lipofuscin accumulation negatively affects RPE cell numbers and might alter packing geometry.
In summary, we performed an in situ investigation of the RPE fluorophores of the mice retina using multicolor confocal fluorescence microscopy. The high-resolution confocal images of RPE mosaic acquired from the flat-mounted RPE provided in situ visualizations of melanosomes and lipofuscin granules and their spatial localization within the RPE of Abca4−/− mice and WT controls with agouti background. The images of RPE from the B6 albino mice strains were used to validate the conclusions of our observations from agouti mice strains. Our study concluded that RPE melanosomes do not exhibit fluorescence properties in a visible excitation wavelength range but rather are a strong source of scattering in visible wavelengths. The lipofuscin granules are identified as the major source of RPE autofluorescence. The red shift in the emission peak with the increase in excitation wavelength confirmed the presence of multiple bisretinoid components in lipofuscin granules. Qualitative and quantitative analysis showed increased lipofuscin granules and reduced melanosomes in the RPE cells of the Abca4−/− mice relative to the agouti WT controls. The increased AF levels measured in situ from the whole RPE cells in the flat-mounted outer retina correlated well with the density of lipofuscin granules in Abca4−/− mice. The increased RPE size observed in Abca4−/− mice relative to WT control suggested the RPE cell death/expansion due to disease progression potentially caused by the increased lipofuscin accumulation. The assessment of melanosomes and lipofuscin granules changes found in Abca4−/− mice strains based on the current study provides a potential means of quantifying changes in their number (concentration) during the development of Stargardt disease. Additionally, the availability of standard clinical procedures such as SW-FAF and NIR-AF would make it possible to monitor the changes (accumulation) of these pigmented granules at the earlier stages of this disease. Therefore, these findings have potentially high diagnostic value in clinical ophthalmology.
Supplementary Material
Acknowledgments
Supported by NIH Grants EY02660, EY024320, EY026556, and EY012576 (NEI Core Grant); T32-EY105387; and Barr Retina Research Foundation gift to UC Davis Department of Ophthalmology.
Disclosure: R.K. Meleppat, None; K.E. Ronning, None; S.J. Karlen, None; K.K. Kothandath, None; M.E. Burns, None; E.N. Pugh Jr., None; R.J. Zawadzki, None
References
- 1. Pascolini D, Mariotti SP. Global estimates of visual impairment: 2010. Br J Ophthalmol. 2012; 96: 614–618. [DOI] [PubMed] [Google Scholar]
- 2. Wong WL, Su X, Li X, et al.. Global prevalence of age-related macular degeneration and disease burden projection for 2020 and 2040: a systematic review and meta-analysis. Lancet Global Health. 2014; 2: e106–e116. [DOI] [PubMed] [Google Scholar]
- 3. Boulton M, Docchio F, Dayhaw-Barker P, Ramponi R, Cubeddu R. Age-related changes in the morphology, absorption and fluorescence of melanosomes and lipofuscin granules of the retinal pigment epithelium. Vis Res. 1990; 30: 1291–1303. [DOI] [PubMed] [Google Scholar]
- 4. Schmidt SY, Peisch RD. Melanin concentration in normal human retinal pigment epithelium: regional variation and age-related reduction. Invest Ophthalmol Vis Sci. 1986; 27: 1063–1067. [PubMed] [Google Scholar]
- 5. Feeney-Burns L. The pigments of the retinal pigment epithelium. Curr Topics Eye Res. 1980; 2: 119–178. [PubMed] [Google Scholar]
- 6. Sparrow JR, Wu Y, Kim CY, Zhou J. Phospholipid meets all-trans-retinal: the making of RPE bisretinoids. J Lipid Res. 2010; 51: 247–261. [DOI] [PMC free article] [PubMed] [Google Scholar]
- 7. Roberts JE, Kukielczak BM, Hu D-N, et al.. The role of A2E in prevention or enhancement of light damage in human retinal pigment epithelial cells. Photochem Photobiol. 2002; 75: 184–190. [DOI] [PubMed] [Google Scholar]
- 8. Lakkaraju A, Finnemann SC, Rodriguez-Boulan E. The lipofuscin fluorophore A2E perturbs cholesterol metabolism in retinal pigment epithelial cells. Proc Natl Acad Sci USA. 2007; 104: 11026–11031. [DOI] [PMC free article] [PubMed] [Google Scholar]
- 9. Vives-Bauza C, Anand M, Shirazi AK, et al.. The age lipid A2E and mitochondrial dysfunction synergistically impair phagocytosis by retinal pigment epithelial cells. J Biol Chem. 2008; 283: 24770–24780. [DOI] [PMC free article] [PubMed] [Google Scholar]
- 10. Sparrow JR, Boulton M.. RPE lipofuscin and its role in retinal pathobiology. Exp Eye Res. 2005; 80: 595–606. [DOI] [PubMed] [Google Scholar]
- 11. Winkler BS, Boulton ME, Gottsch JD, Sternberg P. Oxidative damage and age-related macular degeneration. Mol Vis. 1999; 5: 32. [PMC free article] [PubMed] [Google Scholar]
- 12. Lenis TL, Hu J, Ng SY, et al.. Expression of ABCA4 in the retinal pigment epithelium and its implications for Stargardt macular degeneration. Proc Natl Acad Sci USA. 2018; 115: E11120–E11127. [DOI] [PMC free article] [PubMed] [Google Scholar]
- 13. Weng J, Mata NL, Azarian SM, Tzekov RT, Birch DG, Travis GH. Insights into the function of rim protein in photoreceptors and etiology of Stargardt's disease from the phenotype in abcr knockout mice. Cell. 1999; 98: 13–23. [DOI] [PubMed] [Google Scholar]
- 14. Sparrow JR, Blonska A, Flynn E, et al.. Quantitative fundus autofluorescence in mice: correlation with HPLC quantitation of RPE lipofuscin and measurement of retina outer nuclear layer thickness. Invest Ophthalmol Vis Sci. 2013; 54: 2812–2820. [DOI] [PMC free article] [PubMed] [Google Scholar]
- 15. Charbel Issa P, Barnard AR, Singh MS, et al.. Fundus autofluorescence in the abca4−/− mouse model of Stargardt disease—correlation with accumulation of A2E, retinal function, and histology. Invest Ophthalmol Vis Sci. 2013; 54: 5602–5612. [DOI] [PMC free article] [PubMed] [Google Scholar]
- 16. Wang Z, Dillon J, Gaillard ER. Antioxidant properties of melanin in retinal pigment epithelial cells. Photochem Photobiol. 2006; 82: 474–479. [DOI] [PubMed] [Google Scholar]
- 17. Peters S, Lamah T, Kokkinou D, Bartz-Schmidt K-U, Schraermeyer U. Melanin protects choroidal blood vessels against light toxicity. Z Naturforsch C J Biosci. 2006; 61: 427–433. [DOI] [PubMed] [Google Scholar]
- 18. Sarna T. New trends in photobiology: Properties and function of the ocular melanin—a photobiophysical view. J Photochem Photobiol B Biol. 1992; 12: 215–258. [DOI] [PubMed] [Google Scholar]
- 19. Feeney-Burns L, Burns RP, Gao C-L. Age-related macular changes in humans over 90 years old. Am J Ophthalmol. 1990; 109: 265–278. [DOI] [PubMed] [Google Scholar]
- 20. Feeney L. Lipofuscin and melanin of human retinal pigment epithelium: fluorescence, enzyme cytochemical, and ultrastructural studies. Invest Ophthalmol Vis Sci. 1978; 17: 583–600. [PubMed] [Google Scholar]
- 21. Kellner U, Kellner S, Weinitz S. Fundus autofluorescence (488 nm) and near-infrared autofluorescence (787 nm) visualize different retinal pigment epithelium alterations in patients with age-related macular degeneration. Retina. 2010; 30: 6–15. [DOI] [PubMed] [Google Scholar]
- 22. Keilhauer CN, FC. Delori. Near-infrared autofluorescence imaging of the fundus: visualization of ocular melanin. Invest Ophthalmol Vis Sci. 2006; 47: 3556–3564. [DOI] [PubMed] [Google Scholar]
- 23. Gibbs D, Cideciyan AV, Jacobson SG, Williams DS. Retinal pigment epithelium defects in humans and mice with mutations in MYO7A: imaging melanosome-specific autofluorescence. Invest Ophthalmol Vis Sci. 2009; 50: 4386–4393. [DOI] [PMC free article] [PubMed] [Google Scholar]
- 24. Gallas JM, Eisner M. Fluorescence of melanin-dependence upon excitation wavelength and concentration. Photochem Photobiol. 1987; 45: 595–600. [Google Scholar]
- 25. Kayatz P, Thumann G, Luther TT, et al.. Oxidation causes melanin fluorescence. Invest Ophthalmol Vis Sci. 2001; 42: 241–246. [PubMed] [Google Scholar]
- 26. Sachs HW. Ueber die autogene Pigmente, besonders Lipofuscin und seine Abgrenzung von Melanin. Beitr Path Anat. 1943; 108: 272–314. [Google Scholar]
- 27. Taubitz T, Fang Y, Biesemeier A, Julien-Schraermeyer S, Schraermeyer U. Age, lipofuscin and melanin oxidation affect fundus near-infrared autofluorescence. EBioMedicine. 2019; 48: 592–604. [DOI] [PMC free article] [PubMed] [Google Scholar]
- 28. Delori FC, Dorey CK, Staurenghi G, Arend O, Goger DG, Weiter JJ. In vivo fluorescence of the ocular fundus exhibits retinal pigment epithelium lipofuscin characteristics. Invest Ophthalmol Vis Sci. 1995; 36: 718–729. [PubMed] [Google Scholar]
- 29. Ben Ami T, Tong Y, Bhuiyan A, et al.. Spatial and spectral characterization of human retinal pigment epithelium fluorophore families by ex vivo hyperspectral autofluorescence imaging. Transl Vis Sci Technol. 2016; 5: 5. [DOI] [PMC free article] [PubMed] [Google Scholar]
- 30. Hammer M, Sauer L, Klemm M, Peters S, Schultz R, Haueisen J. Fundus autofluorescence beyond lipofuscin: lesson learned from ex vivo fluorescence lifetime imaging in porcine eyes. Biomed Opt Express. 2018; 9: 3078–3091. [DOI] [PMC free article] [PubMed] [Google Scholar]
- 31. Nikon Instruments Inc., USA, NIS Elements Users Guide, August, 2020. https://d33b8x22mym97j.cloudfront.net/phase4/literature/Brochures/Ti2-2ce-mplh-6r.pdf?mtime=20201015085052&focal=none.
- 32. Williams MA, Pinto LH, Gherson J. The retinal pigment epithelium of wild type (C57BL/6J +/+) and pearl mutant (C57BL/6J pe/pe) mice. Invest Ophthalmol Vis Sci. 1985; 26: 657–669. [PubMed] [Google Scholar]
- 33. Meleppat RK, Zhang P, Ju MJ, et al.. Directional optical coherence tomography reveals melanin concentration-dependent scattering properties of retinal pigment epithelium. J Biomed Optics. 2019; 24: 066011. [DOI] [PMC free article] [PubMed] [Google Scholar]
- 34. Wilk MA, Huckenpahler AL, Collery RF, Link BA, Carroll J. The effect of retinal melanin on optical coherence tomography images. Transl Vis Sci Technol. 2017; 6: 8. [DOI] [PMC free article] [PubMed] [Google Scholar]
- 35. Riesz J, Gilmore J, Meredith P. Quantitative scattering of melanin solutions. Biophys J. 2006; 90: 4137–4144. [DOI] [PMC free article] [PubMed] [Google Scholar]
- 36. Boyer NP, Higbee D, Currin MB, et al.. Lipofuscin and N-retinylidene-N-retinylethanolamine (A2E) accumulate in retinal pigment epithelium in absence of light exposure: their origin is 11-cis-retinal. J Biol Chem. 2012; 287: 22276–22286. [DOI] [PMC free article] [PubMed] [Google Scholar]
- 37. Hazim R, Jiang M, Esteve-Rudd J, Diemer T, Lopes VS, Williams DS. Live-cell imaging of phagosome motility in primary mouse RPE cells. Adv Exp Med Biol. 2016; 854: 751–755. [DOI] [PMC free article] [PubMed] [Google Scholar]
- 38. Umapathy A, Williams DS.. Live imaging of organelle motility in RPE flatmounts. Adv Exp Med Biol. 2019; 1185: 389–393. [DOI] [PubMed] [Google Scholar]
- 39. Wing GL, Blanchard GC, Weiter JJ. The topography and age relationship of lipofuscin concentration in the retinal pigment epithelium. Invest Ophthalmol Vis Sci. 1978; 17: 601–607. [PubMed] [Google Scholar]
- 40. Taubitz T, Tschulakow AV, Tikhonovich M, et al.. Ultrastructural alterations in the retinal pigment epithelium and photoreceptors of a Stargardt patient and three Stargardt mouse models: indication for the central role of RPE melanin in oxidative stress. PeerJ. 2018; 6: e5215. [DOI] [PMC free article] [PubMed] [Google Scholar]
- 41. Dorey CK, Wu G, Ebenstein D, Garsd A, Weiter JJ. Cell loss in the aging retina: relationship to lipofuscin accumulation and macular degeneration. Invest Ophthalmol Vis Sci. 1989; 30: 1691–1699. [PubMed] [Google Scholar]
Associated Data
This section collects any data citations, data availability statements, or supplementary materials included in this article.


