

Abstract
At gastrulation, a subpopulation of epiblast cells constitutes a transient posteriorly located structure called the primitive streak, where cells that undergo epithelial–mesenchymal transition make up the mesoderm and endoderm lineages. Mouse embryo epiblast cells were labelled ubiquitously or in a mosaic fashion. Cell shape, packing, organization and division were recorded through live imaging during primitive streak formation. Posterior epiblast displays a higher frequency of rosettes, some of which associate with a central cell undergoing mitosis. Cells at the primitive streak, in particular delaminating cells, undergo mitosis more frequently than other epiblast cells. In pseudostratified epithelia, mitosis takes place at the apical side of the epithelium. However, mitosis is not restricted to the apical side of the epiblast, particularly on its posterior side. Non‐apical mitosis occurs specifically in the streak even when ectopically located. Posterior non‐apical mitosis results in one or two daughter cells leaving the epiblast layer. Cell rearrangement associated with mitotic cell rounding in posterior epiblast, in particular when non‐apical, might thus facilitate cell ingression and transition to a mesenchymal phenotype.
Keywords: epithelial–mesenchymal transition, gastrulation, interkinetic nuclear movement, mitosis, rosette
Subject Categories: Cell Cycle, Development & Differentiation
Live imaging of the mouse embryo epiblast reveals that delaminating cells of the posterior primitive streak undergo mitosis at a higher frequency and indicates that non‐apical mitosis might contribute to cell delamination.

Introduction
Gastrulation is an essential morphogenetic event that establishes the three layers of the animal body plan (ectoderm, mesoderm and endoderm) through an epithelial–mesenchymal transition (EMT) that occurs at an organizing centre called the primitive streak (PS) in amniotes (Arnold & Robertson, 2009; Ramkumar & Anderson, 2011). In mouse, the combination of multiple signalling gradients coming from embryonic epiblast, as well as extraembryonic ectoderm and visceral endoderm (VE), creates a permissive zone in the posterior epiblast for PS establishment. The first marker of anterior–posterior asymmetry is expression of Wnt3 in a tiny region of VE at the embryonic–extraembryonic border at embryonic day (E) 5.5 (Rivera‐Pérez & Magnuson, 2005). Shortly after, between E5.5 and E5.75, a group of VE cells at the distal end of the embryo migrates towards the embryonic–extraembryonic border in the direction opposite Wnt3 expression. This organizer, called the anterior VE (AVE), secretes inhibitors of Nodal and Wnt signalling that consolidate anterior–posterior axis specification (Stower & Srinivas, 2014). PS initiates in the proximal posterior epiblast at the embryonic–extraembryonic boundary and extends distally towards the tip of the embryo. Contrary to other species, there seems to be no global epiblast movement towards the posterior side in mouse, but rather a local change of fate (Rivera‐Pérez & Magnuson, 2005; Williams et al, 2012). The streak can be identified through expression of markers in pre‐streak (Wnt3), and early streak (Eomesodermin and Brachyury) embryos at around E6 (Rivera‐Pérez & Magnuson, 2005). It can be identified through morphology alone from the mid‐streak stage (E6.25–E6.5).
Epithelial–mesenchymal transition allows epithelial cells to become motile through loss of cell–cell adhesion and change in polarity from apical‐basal to front‐rear, via cytoskeleton reorganization and acquisition of migratory and matrix remodelling capacities (Nieto et al, 2016). Live imaging of mid‐ and late‐streak embryos showed that epiblast cells in the PS region delaminate through apical constriction (leading to the so‐called “bottle shape”) followed by retraction of the apical process and extrusion on the basal side (Williams et al, 2012; Ramkumar et al, 2016). Analyses of mouse mutant lines displaying an accumulation of cells within the PS converge on a major role for actin–myosin cytoskeleton regulation to allow delamination at the PS (Lee et al, 2007; Ramkumar et al, 2015, 2016). Control of cell ingression is defined at the cellular level by the complementary pattern of the expression of Crumbs2 (in delaminating cells) and Myosin IIB (in their neighbours) on the apical side of epiblast cells (Ramkumar et al, 2016). Crumbs2 mutant cells fail to detach from their basal attachment, indicating cellular anisotropy might help extrusion from the epithelium. Interestingly, in Crumbs2 mutant embryos, initiation of gastrulation occurs normally, and only a proportion of cells fail to ingress, leading to progressive expansion of the PS, while the rest of post‐EMT cells join the mesodermal wings, suggesting that several mechanisms may control PS cellular extrusion.
An alternative delamination mechanism based on asymmetric division has been described in chick neural crest EMT from the neuroepithelium (Ahlstrom & Erickson, 2009). Similar to neuroepithelium, epiblast is a pseudostratified epithelium, and live imaging experiments have shown apical‐basal nuclear movement, suggesting it undergoes interkinetic nuclear migration (IKNM) (Ichikawa et al, 2013). Classically, in IKNM, cells retain apical and basal connections, while the nucleus migrates along their apical‐basal length according to cell cycle stage, and division occurs on the apical side (Strzyz et al, 2016).
In order to define the cell shape changes and cellular rearrangements taking place at the prospective PS and explore alternative delamination mechanisms as gastrulation proceeds, we performed confocal and lightsheet imaging of mouse embryos expressing fluorescent reporters ubiquitously or mosaically. We found that epiblast cells form rosettes, transient epithelial multicellular structures in which five or more cells interface at a central vertex, more frequently on the posterior side. Dynamic and static observation of dividing cells revealed a higher frequency of mitosis in the PS. Non‐apical mitosis, resulting in ingression of one or two mesoderm cells per event, was found specifically on the posterior side of the epiblast.
Results
Posterior epiblast displays higher frequency of rosettes
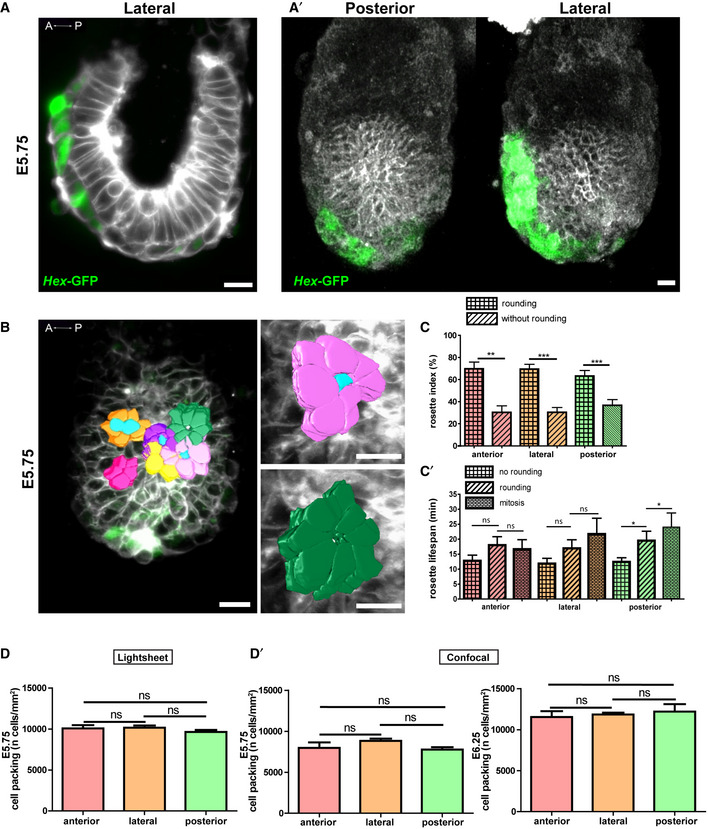
Lightsheet imaging, in which a thin bi‐concave sheet of excitation laser optically sections an imaged sample that can be rotated and imaged at successive angles, has emerged as the method of choice for embryo live imaging, as it provides high time and space resolution tridimensional images with minimal phototoxicity (Amat & Keller, 2013). Recently, several culture methods have been developed to allow growing mouse embryos within a lightsheet microscope (Ichikawa et al, 2013; Udan et al, 2014; McDole et al, 2018). In order to record epiblast dynamics prior to, and during PS establishment, we performed lightsheet imaging at E5.75 (stage at which the anterior–posterior axis is defined) of CAG‐TAG embryos bearing a membrane tomato reporter and a nuclear (H2B) GFP reporter (Trichas et al, 2008), as well as Hex‐GFP, a cytoplasmic reporter expressed in the AVE (to aid anterior–posterior orientation) (Srinivas et al, 2004) (Figs 1A′, EV1A–C, and EV2A). Embryos were mounted in a glass tube containing a hollow agarose cylinder. Samples were rotated in order to obtain high‐quality images from 4 sides, and the corresponding Z‐stacks were fused to obtain a complete 3D representation. A striking feature was the abundance of rosettes in the epiblast layer (Fig 1A, Movie EV1). Rosettes were quantified systematically on the anterior, lateral and posterior sides on Z‐sections located 5 μM from the epiblast basal side. Rosette frequency was calculated through normalization according to the total cell number or the surface of the region of interest (in which clear cell contours could be delineated) of each section as well as total time of acquisition. We found that rosettes were twice more frequent on the posterior side (Figs 1A and A″ and EV1).
Figure 1. Epiblast cells organize as rosettes at the onset of primitive streak morphogenesis.

-
AManually segmented rosettes on 3D reconstructions from Z‐stacks of 25 μm of an E5.75 embryo imaged using lightsheet microscopy. AVE cells are in green, and all cell membranes are labelled in grey. Left: anterior view; middle: lateral view (anterior to the left); right: posterior view. Scale bars: 20 μm. (A′) Mouse line strategy used to perform live imaging. (A″) Left: number of rosettes normalized by the total number of cells in the epiblast region in focus expressed in percentage. Right: frequency of rosettes, normalized by the area in mm2 of the epiblast region in focus and the time of observation in minutes. Data information: Mean ± SEM, n = 41 frames from three embryos. Normality was assessed using a Shapiro–Wilk test, followed by Kruskal–Wallis and non‐parametric Mann–Whitney tests. **P‐value ≤ 0.01, ***P‐value ≤ 0.001.
-
B, CRosettes outline on optical slices from E5.75 (B) and E6.25 (C) embryos imaged by confocal microscopy. AVE cells are in green, and all cell membranes are labelled in grey. Left: anterior view; middle: lateral view (anterior to the left); right: posterior view. Scale bars: 20 μm. (B′) Mouse line strategy used to perform live imaging. (B″, C′) Left: Number of rosettes normalized by the total number of cells expressed in percentage. Right: density of rosettes, normalized by the area in mm2 of the epiblast region in focus. The posterior region includes the PS region, as it could not be precisely discriminated. Data information: Mean ± SEM. E5.75: n anterior = 19 frames from three embryos, n lateral = 23 frames from five embryos, n posterior = 20 frames from three embryos. E6.25: n anterior = 16 frames from two embryos, n lateral = 12 frames from one embryo and n posterior = 16 frames from two embryos. Normality was assessed using a Shapiro–Wilk test, followed by Kruskal–Wallis and non‐parametric Mann–Whitney tests. ns, non‐significant, *P‐value ≤ 0.05, **P‐value ≤ 0.01 and ***P‐value ≤ 0.001.
Source data are available online for this figure.
Figure EV1. Quantification of rosette events in three pregastrulation embryos using lightsheet imaging.

-
A–CSingle optical slices from three embryos at E5.75. All embryos are in lateral orientation, with the anterior side to the left as defined by the position of AVE cells (Hex‐GFP, in green). Membranes are marked by tdTomato (in grey). Scale bars represent 50 μm. (A′, B′, C′) Upper row: number of rosettes normalized by the total number of cells in the epiblast region in focus expressed in percentage; mid row: frequency of rosettes, normalized by the area of the epiblast region in focus and the time of observation; bottom row: frequency of apical cell rounding, normalized by the area of the epiblast region in focus and the time of observation. Data show consistently a higher number of rosettes in the posterior side compared with the anterior and lateral side, both in absolute and normalized values. Time interval between acquisitions is 7 min, and interval between Z‐sections is 1 μm.
Figure EV2. Embryo orientation for lightsheet and confocal imaging, and quantification of rosettes linked to apical cell rounding.
-
AZ‐projection of the middle section of an embryo imaged by lightsheet microscopy, shown in a lateral view with anterior to the left. Cell shape can be easily segmented. Scale bar: 20 μm. (A′) 3D rendering of an embryo imaged by confocal microscopy, shown in posterior (left) and lateral (right) views. Scale bar: 20 μm. In (A) and (A′), AVE cells are identified through the Hex‐GFP reporter, allowing embryo antero‐posterior orientation.
-
BLeft panel: 3D rendering of the apical side of manually segmented rosettes from an embryo imaged using lightsheet microscopy. Scale bar: 20 μm. Highlighted in light blue are rounded cells localized at the centre of the rosette. Right panels: zooms of a rosette linked to a rounded apical cell (top) and a rosette without an apically rounded cell (bottom). Scale bar: 20 μm.
-
CRosette rounding index: rosettes with or without a central apical rounded cell over total rosettes in percentage and (C′) lifespan (min) of rosettes when associated with a central mitotic, central round or no cell in the anterior, lateral and posterior regions of the embryo. The posterior region includes the PS region. Data information: Mean ± SEM, n = 41 frames from three embryos. Normality was assessed using a Shapiro–Wilk test followed by Kruskal–Wallis and Mann–Whitney tests. ns, non‐significant, *P‐value ≤ 0.05 and ***P‐value ≤ 0.001.
-
DCell packing (number of cells/area in mm2) for E5.75 embryos imaged by lightsheet microscopy, at the anterior, lateral and posterior regions. Data information: Mean ± SEM, n = 41 frames from three embryos. Normality was assessed using a Shapiro–Wilk test followed by a Kruskal–Wallis test. ns: non‐significant. (D′) Cell packing (number of cells/area in mm2) for E5.75 (Left) and E6.25 (Right) embryos imaged by confocal microscopy, at the anterior, lateral and posterior regions. Data information: Mean ± SEM. E5.75: n anterior = 19 frames from three embryos, n lateral = 23 frames from five embryos, n posterior = 20 frames from three embryos. E6.25: n anterior = 16 frames from two embryos, n lateral = 12 frames from one embryo and n posterior = 16 frames from two embryos. Normality was assessed using a Shapiro–Wilk test followed by a Kruskal–Wallis test. ns, non‐significant.
Source data are available online for this figure.
The high time (7 min of intervals) and space (1 μm Z‐slice) resolution allowed reconstruction of rosettes along the entire height of the epithelium (Movie EV2), as well as follow‐up of individual cells fate. Overtime, around 30% of rosettes opened at their vertex in at least a portion of their apical‐basal length, due to a central cell displaying rounding, usually preceding cell division (Fig EV2B and C). However, not all round cells were associated with a rosette, and the frequency of rounding was similar on all sides (Fig EV1). Although the time resolution of imaging was insufficient to follow each rosette emergence and resolution, we observed that the lifespan of rosettes associated with rounding and mitosis tended to be longer than that of rosettes without rounding (Fig EV2C′).
In order to increase sample number and to cover a longer period of development through concomitant imaging of several embryos, we performed live confocal imaging of embryos dissected at E5.75 or E6.25 (when the PS is specified and cells start to delaminate), and placed in optically compatible conical wells with either the anterior, posterior or lateral side facing the objective. Cell membranes were labelled ubiquitously using Rosa26::membrane tdTomato/membrane GFP (mTmG) (Muzumdar et al, 2007), and the Hex‐GFP transgene was used for orientation (Figs 1B′ and EV2A′). Z‐stacks at 3‐μm interval encompassing roughly half of the embryo were recorded with time intervals of 25 min. Epiblast cell contours were segmented, and rosettes were quantified on the anterior, lateral and posterior sides on Z‐sections located 5 μm from the epiblast basal side (Fig 1B and C, Movie EV3). Due to the longer intervals between time points, normalization was performed according to cell number and surface only. Confocal live imaging confirmed a higher frequency of rosettes on the posterior, compared to anterior and lateral epiblast (Fig 1B″ and C′), at E5.75 and E6.25.
The cell number per surface area was similar on all sides at each stage (Fig EV2D and D′), which indicates that the higher number of rosettes was not due to increased cell packing. Rosettes have also been identified in the chick PS (Wagstaff et al, 2008), where they were proposed to facilitate ingression during gastrulation. As we observed a higher frequency of rosettes on the posterior side as early as E5.75, prior to the onset of gastrulation, it raises the hypothesis that they may reflect a dynamic epithelium primed for EMT.
PS cells use multiple mechanisms to delaminate
We hypothesized that the excess of rosettes on the posterior side might arise due to cell shape changes related to EMT. However, the pseudostratified and packed arrangement of the epiblast made it quite challenging to follow individual cell shape changes. OH‐tamoxifen‐induced recombination of mTmG through Sox2‐Cre‐ERT2 (Arnold et al, 2013) activation allowed mosaic labelling of the epiblast (Fig 2A and A′, [Link], [Link], [Link]). At that stage of development, anterior–posterior axis can be determined through morphology alone. Due to toxicity of tamoxifen prior to implantation, we could not observe the early events of gastrulation. However, when the injection was given at E6.25, litter size and embryo morphology were normal. Live imaging was performed at E7.25, when PS elongation is complete, which offered a higher probability to observe numerous delamination events within the observation window. Embryos were placed on the lateral side in conical wells, to examine anterior and posterior epiblast. Two‐photon imaging allowed recording the whole width of the embryo, with Z‐intervals of 3 μm and time intervals of 25 min, which permitted 3D reconstruction over time. For systematic quantification, epiblast regions were defined as anterior or posterior by tracing a line passing by the distal pole and perpendicular to the embryonic/extraembryonic border. Cells acquiring either a round or a bottle shape were segmented and tracked to identify their destiny (within the epiblast or mesoderm layers) as well as that of their progeny when division occurred.
Figure 2. Mosaic epiblast labelling allows tracking of bottle‐shaped cells and cell division.

-
AZ‐projection of an E7.25 embryo mosaically labelled through OH‐tamoxifen injection, imaged by two‐photon microscopy. Scale bar: 50 μm. Data information: n embryos = 54. (A′) Mouse line strategy used to produce embryos ubiquitous for membrane tdTomato (grey) and mosaic for membrane GFP (mGFP, green) in the epiblast.
-
BZ‐projections of stills from live imaging recording of a bottle‐shaped cell (indicated by a white arrow) that delaminates through the basal membrane at time 0 min, 25 min, 50 min, 1 h 15 min and 1 h 40 min. Scale bar: 10 μm. (B′) Top: bottle shape events: GFP+ bottle shape cells over total GFP+ cells, expressed in percentage, in anterior versus posterior region of the epiblast. The posterior region includes the PS region, as it could not be precisely discriminated. Data information: Mean ± SEM, n embryos = 40, n GFP+ cells: anterior = 551, posterior = 540. Bottom: Percentage of bottle shape cells exiting the epiblast among total number of GFP+ bottle shape cells, in anterior versus posterior epiblast. Data information: Mean ± SEM, n embryos = 17, n GFP+ bottle shape cells: anterior = 19, posterior = 32. Normality was assessed using a Shapiro–Wilk test. Accordingly, samples were compared using non‐parametric Mann–Whitney. *P‐value ≤ 0.05, ***P‐value ≤ 0.001.
-
CZ‐projection (C) and 3D reconstruction (C′) of stills from live imaging recording showing an apical division without basal contact, followed by daughter cell dispersion at 0 min, 25 min, 50 min, 1 h 15 min and 1 h 40 min. Scale bar: 10 μm. In (B, C and C′), white dotted lines outline basal (top) and apical (bottom) borders of the epiblast. (C″) Left: frequency of apical division (GFP+ apical division over total GFP+ cells, expressed in percentage) in anterior and posterior epiblast. Data information: Mean ± SEM, n embryos = 40, n GFP+ cells: anterior = 551, posterior = 540. Middle: apical division with or without persistence of contact with the epiblast basal pole, normalized by the total number of GFP+ apical division, in anterior versus posterior epiblast. Data information: Mean ± SEM, n embryos = 24, n GFP+ apical divisions: anterior = 50, posterior = 29. Right: cell dispersion (defined as loss of basolateral contact between daughter cells after reinsertion in the epiblast layer) after apical division in anterior and posterior epiblast. Data information: n embryos = 18, n GFP+ apical divisions: anterior = 32, posterior = 26. Normality was assessed using a Shapiro–Wilk test. Accordingly, samples were compared using non‐parametric Mann–Whitney. ns, non‐significant.
Source data are available online for this figure.
The quantification of bottle‐shaped cells was performed in 3D and through Z‐stack navigation and included all cells with an apical section smaller than a third of the basal section. Some cells had a round basal cell body and a thin apical extension while others resembled scutoids performing apicobasal transitions (Gómez‐Gálvez et al, 2018). Asymmetrical cells were present on both sides, but more frequent on the posterior side, and cell delamination (retraction of the apical process and cell body shift in the mesoderm layer) only took place on the posterior side. Cells maintained an apical attachment until their basally located cell body had begun crossing the PS/mesoderm border, and only fully detached after delamination (Fig 2B and B′).
As expected, most cells divided on the apical pole of the epithelium, and the frequency of apical divisions was similar on the anterior and posterior regions of the epiblast (Fig 2C–C″). However, different to what has been described in other pseudostratified epithelia, a connection to the basal pole could not be identified in the majority of dividing cells, even when performing imaging at higher spatial resolution and laser intensity. Although we cannot exclude the possibility of a very thin cell process missed by the imaging technique, our observations are compatible with a profound reorganization in which dividing cells detached basally upon apical mitotic rounding. Upon elongation of daughter cells to reach the basal pole of the epiblast, the majority displayed no basolateral connection between each other and were instead separated by intercalating epiblast cells, which would be expected to result in daughter cell dispersion over time, as described in (Abe et al, 2018). Those findings suggest that although epiblast is a pseudostratified epithelium, and undergoes IKNM, cell shape and attachment dynamics during mitosis are distinct to what is known in neuroepithelia.
GFP‐positive cells undergoing rounding were followed overtime (Fig 3A–C). Although the frequency of cell division (normalized to the total number of GFP‐positive cells) was similar in anterior and posterior epiblast, there was a trend towards a higher division rate specifically in cells undergoing delamination to become mesoderm (Fig 3D). On the anterior side, mitosis almost always took place apically, and exclusively resulted in two epiblast cells (Fig 3 Source Data). However, on the posterior side, cell rounding and division happened all along the apical‐basal length of the cell, so that non‐apical division represented 30% of all divisions in posterior epiblast (Fig 3E and F). Non‐apical mitosis in the posterior epiblast was preferentially associated with EMT, as it resulted in formation of one or two mesoderm cells (Fig 3G), suggesting mitotic rounding could be an alternative mechanism for cell delamination. Remarkably, this concurs with the observation by Snow (1977) that in the PS of E6.5 and E7 embryos, mitosis could be found at all levels of the tissue, including adjacent to the endoderm, while it was located at the apical surface of the pseudostratified tissue everywhere else.
Figure 3. Non‐apical division occurs in the posterior epiblast and can give rise to one or two mesoderm cells.

-
AZ‐projection (A) and 3D cell reconstruction (A′) of stills from two‐photon live imaging of an E7.25 embryo mosaically labelled for epiblast cells showing a division giving rise to an epiblast and a mesoderm cell that will exit from the epiblast layer. White dotted lines outline basal (top) and apical (bottom) borders of the epiblast at 0 min, 25 min, 50 min, 1 h 15 min and 1 h 40 min. Scale bar: 10 μm.
-
B, CZ‐projection of stills from two‐photon live imaging of an E7.25 embryo mosaically labelled for epiblast cells. Non‐apical division can be observed in the posterior epiblast only, without (B) or with (C) attachment to the apical side. Stills were taken at 0 min, 25 min, 50 min, 1 h 15 min and 1 h 40 min for (B) and 50 min, 1 h 15 min, 1 h 40 min, 2 h 05 min and 2 h 30 min for (C). White dotted lines outline basal (top) and apical (bottom) borders of the epiblast. Scale bar: 10 μm.
-
DMitotic Index (GFP+ dividing cells over total number of GFP+ cells) in the anterior and posterior region, as well as among cells exiting the epiblast at the PS. The posterior region includes the PS region, as it could not be precisely discriminated. Data information (D–F): Mean ± SEM, n embryos = 40; n GFP+ cells: anterior = 551, posterior = 540, exiting cells = 45. Normality was assessed using a Shapiro–Wilk test followed by a Kruskal–Wallis test. ns, non‐significant.
-
ERatio of non‐apical rounding (non‐apical GFP+ rounding divided by the total GFP+ rounding) and expressed in percentage for the anterior and posterior regions. Normality was assessed using a Shapiro–Wilk test followed by a Mann–Whitney test. *P‐value ≤ 0.05.
-
FRatio of non‐apical division (non‐apical GFP+ division over total GFP+ division) and expressed in percentage for the anterior and posterior region of the embryo. Normality was assessed using a Shapiro–Wilk test followed by a Mann–Whitney test. **P‐value ≤ 0.01.
-
GQuantification of posterior cell division outcome for apical and non‐apical divisions. Outcomes are two epiblast daughter cells (epi/epi), one epiblast and one mesoderm daughter cells (epi/meso) or two mesoderm daughter cells (meso/meso). Data information: Mean ± SEM, n embryos = 41; n posterior divisions: apical = 35, non‐apical = 17. Normality was assessed using a Shapiro–Wilk test followed by Kruskal–Wallis test with post hoc Dunn's multiple column comparison test. ns, non‐significant, ***P‐value ≤ 0.001.
Source data are available online for this figure.
Higher frequency of mitosis, including non‐apical mitosis, in PS and pregastrulation posterior epiblast
In order to document the proportion and position of mitotic nuclei all along the gastrulation period, we performed immunostaining for phospho‐histone H3 (Phh3) on sections or whole‐mount embryos from E5.75 to E7 using lightsheet and confocal imaging (Figs 4, 5 and EV3). Samples were counterstained for nuclei (DAPI) for cell count, F‐actin (Phalloidin) for cell shape and collagen IV for basement membrane, and we quantified mitotic index (Phh3/DAPI), apical‐basal position of Phh3‐positive nuclei, as well as, when possible, orientation of mitotic plate relative to apical‐basal axis.
Figure 4. Mitosis is more frequent at the PS, and PS mitotic rounding is not always apical.

-
AGraphic representation of a transverse section from an E6.5 embryo. The epiblast is divided into three distinct regions: anterior (red), posterior (green) and PS (blue). The PS region is defined as the area where the basement membrane (yellow) is degraded.
-
BRepresentation of cell and mitosis disposition at the PS. Apical mitoses are in red, non‐apical mitoses in cyan and mesenchymal mitoses in green. Mitosis is considered non‐apical when occurring away from the epiblast apical border at a minimum distance corresponding to the size of one nucleus (± 10 μm), in a cell that has not crossed the perforated basement membrane, retains its apical attachment and does not display a mesenchymal phenotype.
-
CZ‐projections of transverse sections from E6.5 (top), E6.75 (mid) and E7 (bottom) embryos. Samples were stained for F‐actin (Phalloidin, grey) and mitosis (Phh3, magenta) on the left and nuclei (DAPI, cyan) and basement membrane (collagen IV, yellow) on the right. Yellow arrowheads show non‐apical mitosis. White arrows delimitate borders of the basement membrane degradation region. Scale bars: 25 μm. A, anterior; P, posterior.
-
DMitotic Index (Phh3/DAPI) in percentage at the anterior, posterior and PS regions of E6.5 (top), E6.75 (mid) and E7 (bottom) embryos. The posterior region quantification excludes counts from the PS region. Normality was assessed using a Shapiro–Wilk test followed by either two‐tailed t‐test or Mann–Whitney test. ns, non‐significant, *P‐value ≤ 0.05, **P‐value ≤ 0.01 and ***P‐value ≤ 0.001.
-
ERatio of non‐apical mitosis (non‐apical Phh3/Phh3, normalized by number of nuclei) in percentage at the anterior, posterior and PS regions of E6.5 (top), E6.75 (mid) and E7 (bottom) embryos. Normality was assessed using a Shapiro–Wilk test followed by Mann–Whitney tests. ns, non‐significant, *P‐value ≤ 0.05, **P‐value ≤ 0.01 and ***P‐value ≤ 0.001. Data information (D, E): values are shown as Mean ± SEM. E6.5: n = 18 sections from six embryos, E6.75: n = 11 sections from five embryos, E7: n = 18 sections from four embryos. E6.5 n cells: anterior = 730, posterior = 445, PS = 221. E6.75 n cells: anterior = 518, posterior = 259, PS = 115. E7 n cells: anterior = 1,324, posterior = 712, PS = 296.
-
FViolin plots representing the distribution of cells in G2/M-phase in cells with high, compared with low, Brachyury expression, among cells annotated as primitive streak and mesoderm harvested from E6.5, E7 and E7.25 embryos. Violin plots are overlaid with white box plots marking 25th percentile, median and 75th percentile. Data information (from Pijuan‐Sala et al, 2019): E6.5: three biological and two technical replicates; E7.0: six biological and three technical replicates; E7.25: three biological replicates. *P‐value ≤ 0.05, **P‐value ≤ 0.01 and ***P‐value ≤ 0.001 using Student's t‐test.
Source data are available online for this figure.
Figure 5. Non‐apical divisions occur in the posterior epiblast before and at the onset of gastrulation.

-
A3D reconstruction from whole‐mount lightsheet imaging of an E5.75 Hex‐GFP (green, anterior marker) embryo, stained for nuclei (DAPI, grey) on the left, mitosis (Phh3, magenta) and F‐actin (Phalloidin, grey) on the right. Scale bar: 50 μm.
-
BZ‐slice (left) and 3D reconstruction (right) from whole‐mount lightsheet imaging of an E6.25 embryo stained for a posterior marker (Eomesodermin, cyan), mitosis (Phh3, magenta) and F‐actin (Phalloidin, grey). Scale bar: 50 μm.
-
A′, B′Mitotic Index (Phh3/DAPI) in percentage at the anterior and posterior regions of E5.75 (A′) and (B′) E6.25 embryos. Posterior region includes the PS region, as it could not be precisely discriminated. Normality was assessed using a Shapiro–Wilk test followed by two‐tailed t‐test or Mann–Whitney test. ns, non‐significant.
-
A″, B″Ratio of non‐apical mitosis (non‐apical Phh3 over total Phh3, normalized by number of nuclei) in percentage in the anterior and posterior region of E5.75 (A″) and E6.25 (B″) embryos. Normality was assessed using a Shapiro–Wilk test followed by Mann–Whitney tests. **P‐value ≤ 0.01 and ***P‐value ≤ 0.001.
Figure EV3. Non‐apical division at the PS .

-
AConfocal imaging of a transverse section at PS level from an E6.5 embryo labelled for mitosis (Phh3, magenta) and F‐actin (Phalloidin, grey). The apical cell attachment of non‐apical Phh3‐positive cells is highlighted in the zoom. Arrowheads show non‐apical mitoses. Scale bar: 20 μm.
-
BZoom from confocal imaging of a section of E6.25 embryos showing mitoses (Phh3, magenta) occurring with a parallel (left) or a perpendicular (right) axis at the apical pole. Scale bar: 30 μm. Blue dotted lines show parallel axes of division (left), while yellow dotted line shows a perpendicular axis of division (right), relative to the epithelium.
-
C–EProportion of mitosis and non‐apical mitosis is stable through time at the PS: Graphs representing (C) Mitotic Index (Phh3 over DAPI) at the PS of E6.5, E6.75 and E7 embryos. (D) Proportion of non‐apical mitosis (non‐apical Phh3 over DAPI, in percentage), and (E) ratio of non‐apical mitosis (non‐apical Phh3 over total Phh3, normalized by the number of nuclei, in percentage). Data information: values are shown as Mean ± SEM. E6.5: n = 18 slices from six embryos, E6.75: n = 11 slices from five embryos, E7: n = 18 slices from four embryos. Normality was assessed using a Shapiro–Wilk test followed by either an ANOVA test (C) or a Kruskal–Wallis test (D, E). ns, non‐significant.
Source data are available online for this figure.
We first focused on early‐ to mid‐streak embryos (E6.5, E6.75 and E7). Based on anatomy and localization of collagen IV, we defined anterior (anterior half), posterior (posterior half except PS area) and PS region (where basement membrane is perforated) on transverse sections (Fig 4A and B). Remarkably, mitosis was around two times more frequent in the PS region compared with the rest of the epiblast (Fig 4C and D). In addition, over a third of mitotic nuclei were located away from the apical surface in PS cells (Fig 4E). Contrary to apical mitosis, the majority of non‐apical Phh3‐positive cells retained a connection with both sides (Fig EV3A). We found no preferential mitotic plate orientation (Fig EV3B). At the PS, the mitotic index and the proportion of non‐apical mitosis were stable overtime (Fig EV3C–E). The higher frequency of mitosis in the streak was corroborated by examining signatures of cell cycle phases in single‐cell transcriptomes from the Mouse Gastrulation 2018 atlas (Data ref: Griffiths & Lun, 2019; Pijuan‐Sala et al, 2019). We selected cells annotated as PS and mesoderm at E6.5, E7 and E7.25. At each time point, cells with high Brachyury expression, which likely represent cells at the PS since Brachyury is progressively down‐regulated in nascent mesoderm, had a higher probability to display a G2/M signature (Figs 4F and EV4).
Figure EV4. Distribution of cell cycle phases among primitive streak and mesoderm cells.

UMAP plots were generated from the Mouse Gastrulation 2018 atlas. Cells annotated as primitive streak and mesoderm were selected from E6.5 (left), E7 (middle) and E7.25 (right) samples. Cells are coloured based on annotation in upper row, on level of Brachyury expression in middle row and on score for G2/M signature in bottom row. Data information (from Pijuan‐Sala et al, 2019): E6.5: three biological and two technical replicates; E7.0: six biological and three technical replicates; E7.25: three biological replicates.
For earlier embryos, anterior–posterior orientation was determined either through Hex‐GFP (AVE, Fig 5A) or immunostaining for Eomesodermin (PS, Fig 5B). Embryos were examined in whole‐mount in a sagittal orientation, and anterior and posterior regions were defined as described above. There was no difference in mitotic index between anterior and posterior epiblast, likely because PS cells, which could not be distinguished from posterior epiblast in that orientation, constitute a minority of posterior epiblast. However, the proportion of non‐apical mitosis was significantly higher on the posterior side, even before the PS could be identified morphologically (Fig 5A′, A″, B′, B″).
Non‐apical mitosis is associated with PS morphogenesis
Primitive streak specification occurs at the region of the embryo opposite the AVE: when the AVE remains distal, PS forms a ring at the embryonic/extraembryonic boundary, and when it migrates partially, PS is skewed to the posterior side but fails to elongate (Rakeman & Anderson, 2006). To assess whether non‐apical mitosis is a feature systematically associated with the PS, we examined embryos displaying defective AVE migration resulting in an ectopic PS. E6.25 Rac1 KO (Migeotte et al, 2010) or RhoA VE‐deleted (in which RhoA is deleted specifically in the VE, Kyprianou et al, 2020) embryos were immunostained for Cerberus 1 (an AVE marker) and Phh3, and counterstained for nuclei (DAPI) and F‐actin (Phalloidin). As expected, AVE migration was partial in RhoA VE‐deleted (Fig 6A–D), and absent in Rac1 KO (Fig EV5A–D) embryos. Rac1 KO embryos were smaller than their wild‐type littermates, but epiblast polarity was maintained; growth and epiblast morphology were normal in RhoA VE‐deleted embryos. In both models, non‐apical mitosis was significantly and consistently more frequent in the region of the embryo most distant from the AVE (Figs 6B, C and E, and EV5B, C and E), showing it is specifically associated with PS morphogenesis, rather than with a regional position in the embryo.
Figure 6. Non‐apical mitosis is a feature associated with the primitive streak.

-
ARepresentation of the position of the AVE‐opposed area (green) and the AVE‐adjacent area (pink) in WT (left) and RhoA VE‐deleted (right) embryos.
-
B, C3D reconstruction (B) and confocal Z‐slice (C) of E6.25 WT (left) and RhoA VE‐deleted (right) embryos stained for an AVE marker (Cerberus 1, yellow), F‐actin (Phalloidin, grey) and mitosis (Phh3, magenta). Scale bar: 25 μm. Blue dotted line delimitates the pro‐amniotic cavity (apical side of the epiblast). Red arrowheads point to non‐apical mitosis. White lines delimitates the boundary between extraembryonic (up) and embryonic (down) regions of the embryo.
-
DPercentage of AVE migration in WT and RhoA VE‐deleted mutants. Data information: values are shown as Mean ± SEM. WT: n = 31 embryos; RhoA VE‐deleted: n = 17 embryos. Normality was assessed using a Shapiro–Wilk test followed by a two‐tailed t‐test. ***P‐value ≤ 0.001.
-
ERatio of non‐apical mitosis (non‐apical Phh3 over total Phh3, normalized by the volume in μm3) in percentage, in AVE‐adjacent and AVE‐opposed regions from WT and RhoA VE‐deleted embryos. Normality was assessed using a Shapiro–Wilk test followed by Kruskal–Wallis test and Mann–Whitney tests. *P‐value ≤ 0.05, ***P‐value ≤ 0.001.
Source data are available online for this figure.
Figure EV5. Non‐apical mitosis is a feature associated with the PS .

-
ARepresentation of the position of the AVE (yellow), AVE‐opposed area (green) and the AVE‐adjacent area (pink) in WT (left) and Rac1 KO (right) embryos.
-
B, C3D reconstruction (B) and confocal Z‐slice (C) of E6.5 WT (left) and Rac1 KO (right) embryos stained for an AVE marker (Cerberus, yellow), F‐actin (Phalloidin, grey) and mitosis (Phh3, magenta). Scale bar: 25 μm. Blue dotted line delimitates the pro‐amniotic cavity (apical side of the epiblast). Red arrowheads point to non‐apical mitosis. White lines delimitate the boundary between extraembryonic (up) and embryonic (down) regions of the embryo.
-
DPercentage of AVE migration in WT and Rac1 KO mutants. Data information: Mean ± SEM. WT: n = 38 embryos; Rac1 KO: n = 7 embryos. Normality was assessed using a Shapiro–Wilk test followed by Mann–Whitney test. ***P‐value ≤ 0.001.
-
ERatio of non‐apical mitosis (non‐apical Phh3 over total Phh3, normalized by the volume expressed in μm3) in percentage in WT and Rac1 KO mutants in AVE‐adjacent compared with AVE‐opposed regions. Data information: Mean ± SEM. WT: n = 38 embryos; Rac1 KO: n = 7 embryos. Normality was assessed using a Shapiro–Wilk test followed by Mann–Whitney tests. **P‐value ≤ 0.01 and ***P‐value ≤ 0.001.
Source data are available online for this figure.
Discussion
Anterior–posterior axis specification of the mouse embryo precedes detection of PS markers by half a day, and initiation of EMT by a day. Through lightsheet and confocal live imaging of embryos that had completed AVE migration, we observed a high frequency of multicellular rosettes in the posterior epiblast, prior to and during PS morphogenesis. Rosettes are intermediate stages of epithelial reorganization observed in multiple morphogenetic events in diverse organisms (Harding et al, 2014). There are two main classes of rosettes, characterized by their mechanisms of formation and resolution. Rosettes arising through planar polarized constriction are usually short lived, and often contribute to tissue elongation. On the other hand, rosettes arising through apical constriction persist for longer periods of time and do not resolve in a stereotyped fashion but rather remodel to participate to the formation of a structure or organ, often through generation of a fold or lumen. Nodal‐dependent rosettes with actin‐rich centres have been observed within the developing PS of the chick embryo (Wagstaff et al, 2008), and they are more frequent as development progresses (Yanagawa et al, 2011). However, their mode of formation is unclear. In view of the complex pseudostratified organization of the epiblast, we could not identify rosette mode of formation with precision. The recent advances of mouse embryo lightsheet imaging (McDole et al, 2018), including dynamic 3D reconstruction of multicolour embryos, should allow to resolve the different modes of rosette formation in the PS along gastrulation. We observed a marked imbalance in rosette frequency as soon as the anterior–posterior axis was specified. As the resolution of a multicellular vertex allows the formation of new cell interfaces, it is possible that rosettes reflect increased epithelial rearrangement in posterior epiblast, which is exposed to a distinct mechanical context from the very beginning of PS morphogenesis. Indeed, a posterior shift in the distribution of basement membrane perforations was identified just after AVE migration, due to an asymmetry in Nodal signalling‐dependent metalloproteinase activity (Kyprianou et al, 2020). To probe the functional significance of rosette formation in the context of mouse gastrulation, it would be interesting to study whether the distribution of rosettes is homogenous before anterior–posterior axis specification, and to assess whether random epiblast cells delaminate before PS formation, as observed in chick (Voiculescu et al, 2014). As Nodal plays a major role in PS initiation, the presence and distribution of rosettes should be studied in models in which Nodal signalling can be tuned (Kumar et al, 2008).
Through mosaic labelling of the epiblast, we followed cell shape changes in mid‐ to late‐streak embryos. Cells delaminating through apical constriction retained an apical connection until their cell body had exited the epiblast layer. Interestingly, cells leaving the PS appeared to have a higher frequency of division. This was confirmed by a systematic quantification of mitotic nuclei in anterior, posterior and PS epiblast, showing higher mitotic index in cells adjacent to the perforated segment of the basement membrane. Data mining from single‐cell transcriptomes (Pijuan‐Sala et al, 2019) highlighted a higher probability to be in G2/M‐phase for PS and mesoderm cells expressing high level of Brachyury. Similarly, it has been shown in rat embryos that cells in the PS region cycled more rapidly than the rest of the epiblast (Mac Auley et al, 1993). Cell division is critical for chick embryo gastrulation via its role in epithelial rearrangements through regulation of cortical actomyosin (Firmino et al, 2016). In Drosophila tracheal placode, mitotic rounding is necessary to accelerate epithelial invagination (Kondo & Hayashi, 2013). The observation that cells down‐regulate E‐cadherin as they round up for mitosis in Drosophila wing pseudostratified epithelium (Aguilar‐Aragon et al, 2020) provides a potential mechanistic explanation. Together, those observations point towards a role for mitosis in EMT.
In addition, we found difference in localization of mitotic rounding and cell division depending on anterior–posterior localization in the epiblast. In anterior epiblast, mitotic rounding was apical, as expected. Different to other pseudostratified epithelia, in the majority of dividing cells we could not distinguish a basal attachment, suggesting cells detach from the basement membrane prior to division. In posterior epiblast, and particularly in the streak area, mitotic rounding was not exclusively apical, but could occur all along apical‐basal cell length. In mutant embryos where PS was ectopic due to AVE migration failure, non‐apical division was detectable in the region of the epiblast further away from the AVE, hence associated with PS morphogenesis. Remarkably, posterior non‐apical division resulted in extrusion of one or two daughter cells. Non‐apical mitosis has been described in chick dorsal neural tube, where neural crest delamination occurs (Ahlstrom & Erickson, 2009): live imaging showed that a proportion of rounded mitotic cells detached from the lumen to undergo mitosis and that daughter cells from those non‐apical mitosis all became neural crest. In the zebrafish retina, perturbation of CDK1‐driven apical IKNM resulted in non‐apical mitosis and disrupted integrity of the pseudostratified neuroepithelium because of aberrant cell delamination (Strzyz et al, 2015). Those data suggest that the intracellular position of mitotic rounding may play a role in the outcome of division.
In light of those results, we propose that increase in epithelial rearrangement, redistribution of cell contacts through acquisition of the round morphology associated with mitosis, as well as, possibly, mechanical pressure on the basement membrane from non‐apical dividing cells, could facilitate transition to a mesenchymal phenotype at the PS.
Material and Methods
Mouse strains and genotyping
The mTmG (Muzumdar et al, 2007) and the Sox2‐Cre‐ERT2 (Arnold et al, 2013) lines were obtained from the Jackson Laboratory, the CAG‐TAG (Trichas et al, 2008) and the Hex‐GFP (Srinivas et al, 2004) lines from Shankar Srinivas, the Rac1 line from Victor Tybulewicz (Walmsley, 2003), the RhoA line from Cord Brakebusch (Jackson et al, 2011) and the TTR‐Cre line from A‐K Hadjantonakis (Kwon & Hadjantonakis, 2009). Mice were kept on a CD1 background. Mouse colonies were maintained in a certified animal facility in accordance with European guidelines. The local ethics committees (the “Commission d’éthique et du bien‐être animal” [CEBEA] in ULB and the Oxford Biological Ethical Review Process) approved all experiments. OH‐tamoxifen (Sigma) was suspended at 100 mg/ml in 100% ethanol and diluted in sesame oil (Sigma) to a final concentration of 10 mg/ml. Females were injected intraperitoneally with 2 mg OH‐tamoxifen at E6.25 and E6.75. Embryos were collected at E7.25.
Mouse genomic DNA was isolated from ear biopsies after overnight digestion at 55°C with 1.5% Proteinase K (Qiagen) diluted in Lysis reagent (DirectPCR, Viagen), followed by heat inactivation.
Embryo culture and live imaging
Confocal imaging
Embryos were dissected in Dulbecco's modified Eagle medium (DMEM) F‐12 (Gibco) supplemented with 10% FBS and 1% penicillin–streptomycin and l‐glutamine and 15 mM HEPES. They were then cultured in 50% DMEM‐F12 with l‐glutamine without phenol red, 50% rat serum (Janvier), at 37°C and 5% CO2. Embryos were observed in suspension in individual conical wells (Ibidi) to limit drift, under a Zeiss LSM 780 microscope equipped with Plan‐Apochromat 25×/0.8, C Achroplan 32×/0.85 and LD C Apochromat 40×/1.1 objectives. Stacks were acquired every 25 min with 3‐μM Z‐intervals for up to 10 h. Embryos were cultured for an additional 6–12 h after imaging to check for fitness.
Lightsheet imaging
Twenty‐microliter glass capillaries (Brand, 701904) with plungers were used to create a 2% agarose cylinder, in which a copper wire of 150 μm (for E5.75 embryo) or 195 μm (for E6.5 embryos) was inserted. Once agarose was solidified, the wire was removed to leave a tunnel of diameter larger than the embryo in the agarose cylinder, in which the embryo was placed with the cone oriented on the bottom.
Embryos were dissected in dissection medium and allowed to recover in equilibrated culture medium (50% CMRL medium, 50% KO serum and 0.02% glutamine) in an incubator (37°C, 5% CO2) for 1 h. Embryos were transferred to a Petri dish filled with culture medium in which the agarose cylinders were lying flat, and were gently moved into the hollow cylinder. Once the cylinders were mounted into glass capillaries, those were placed into a syringe adapted with tips on both ends to secure the capillary.
The lightsheet microscope (Zeiss Lightsheet Z.1) chamber was filled with culture medium, and left to equilibrate with the sample holder at 37°C and 5% CO2 prior to imaging for 1 h. Imaging was performed using a 20×, NA1.0 Plan‐Apochromat water immersion objective and dual side illumination. Embryos were imaged on four sides (anterior, posterior and two laterals) with an interval of 90°. Stack Images were taken in dual illumination. Images were captured with Z‐intervals of 1 μm for maximum 200 μm, and time intervals of 7 min. Embryos were cultured for up to 12 h. Embryos could not be recovered after imaging. However, similarly mounted embryos were cultured in the incubator and displayed good growth and morphology.
Antibodies
Antibodies were as follows: rat anti‐Phh3 (Abcam #ab10543; 1/500), rabbit anti‐Phh3 (Sigma #SAB4504429, 1/500), rabbit anti‐Tbr2/Eomes (Sigma #AB2283; 1/100), goat anti‐Brachyury (R&D Systems #AF2085; 1/20), goat anti‐collagen IV (MERK #AB769, 1/500) and goat anti‐Cerberus 1 (R&D #AF1986, 1/500). F‐actin was visualized using 1.5 U/ml Alexa Fluor 568 Phalloidin (Invitrogen #A12380; 1/100) and nuclei using DAPI (Sigma; 1/1,000). Secondary antibodies were anti‐goat Alexa Fluor 647 (Jackson #705‐605‐147), anti‐rabbit Alexa Fluor 488 (Invitrogen A#‐21206) and anti‐rat Alexa Fluor 488 (Invitrogen A#‐21470), all at 1/500.
Embryo analysis
For immunofluorescence, embryos were fixed in PBS containing 4% paraformaldehyde (PFA) for 2 h at 4°C, cryopreserved in 30% sucrose, embedded in OCT and cryosectioned at 7–10 μM. Staining was performed in PBS containing 0.5% Triton X‐100, 0.1% BSA and 5% heat‐inactivated horse serum. Sections and whole‐mount embryos were imaged on a Zeiss LSM 780 or Lightsheet Z.1 microscope.
Image analysis
Rosettes
For lightsheet imaging, embryos were dissected at E5.75. Images were acquired for 10–12 h. Quantification focused on the first 20 frames (around 2 h) to capture pregastrulation events and reduce the risk of bias from imaging. The rest of the frames showed that the embryo continued growing for several hours. Z‐stacks from four sides were fused using Zeiss plug‐in for lightsheet Imaging. Images were then processed using Arivis Vision4D v2.12.3 (Arivis, Germany). Embryo contours were segmented manually on each Z‐slice and time point, in order to adjust for embryo rotation manually if necessary. For each side of the embryo, Z‐stack was cropped to an average of 30 Z‐slices, from the basal side (5 μm from VE layer, which can be morphologically distinguished due to cell shape and membrane Tomato distribution) to the cavity, marking the apical side. Rosettes were identified and counted on Z‐sections located 5 μm from the basal side of the epiblast. First, the region of interest was delimited by manual contouring using ImageJ, and cell number and area were determined for normalization purposes. Then, vertices were systematically scanned to find those in which five cells or more met. Cells contributing to a rosette were manually segmented on each Z‐slice and time point by highlighting cellular membranes using Wacom's Cintiq 13HD, to create a 3D reconstruction. For confocal imaging, rosettes were identified using the same method, and counted on Z‐sections located 5 μm from the basal side of the epiblast after visual verification that it was present throughout the Z‐stack. For both techniques, the presence of associated apical rounding was assessed for each vertex. Cells could contribute to several rosettes.
Mosaic
Embryos were recorded in a lateral position. As the proportion of GFP‐positive cells varied between mosaic embryos, normalization was performed by dividing by the number of green cells in a given embryo. Anterior and posterior halves were defined by drawing a line perpendicular to the embryonic/extraembryonic boundary and passing through the distal tip. Bottle‐shaped cells were identified as having a thin attachment on the apical surface (less than a third of the larger section), and the majority of the cell body located in the basal side. Quantification was performed both on the 3D rendering, and through navigating through the Z‐stack. The same criteria were used on all sides of the embryo, and quantification was verified by two independent investigators. Delamination was defined as retraction of the apical process, and displacement of the cell body in the mesoderm layer, which could be identified because of the ubiquitous membrane Tomato labelling. Cell division was characterized by cell rounding followed by the appearance of daughter cells. Cell dispersion after mitosis was defined as absence of basolateral contact between daughter cells, which implies the presence of at least one epiblast cell (more often 2 or 3) between daughter cells. Mitosis was considered “non‐apical” when happening at least 10 μm away from the apical pole, hence not in the first pseudo‐layer of nuclei lining the apical pole.
Phospho‐histone H3
For Phh3 quantifications, sections were chosen at least 10 μm apart to ensure that each cell was only counted once, and counting was performed using the Icy software (http://icy.bioimageanalysis.org). For sagittal sections, anterior and posterior regions were defined by drawing a line perpendicular to the embryonic/extraembryonic boundary and passing through the distal tip. For transverse sections, anterior–posterior boundary was placed at mid‐distance between the anterior and posterior poles. The PS region was defined by the area where the basement membrane was degraded, and the posterior region quantification excluded counts from the PS region. A cell was counted as being part of the PS region if at least 50% of its cell body was within the area where the basement membrane was non‐ambiguously degraded, and if the cell retained its attachment to the apical pole (cell contours were defined by F‐actin detection using Phalloidin).
Videos were generated using the Arivis Vision4D and ImageJ softwares.
For each population, normality was assessed using a Shapiro–Wilk test. According to the results of the precedent test, samples were compared using a non‐parametric Mann–Whitney test or an unpaired t‐test. Ns: non‐significant, *P‐value ≤ 0.05, **P‐value ≤ 0.01 and ***P‐value ≤ 0.001.
Single‐cell RNA‐seq analysis
To mine the Mouse Gastrulation Atlas (Pijuan‐Sala et al, 2019), the scRNA‐seq data were downloaded using the “MouseGastrulationData” package (Data ref: Griffiths & Lun, 2019). The data include raw gene counts and annotations for each cell (cell‐type, stage and UMAP coordinates). To plot the data, we utilized the UMAP coordinates, cell‐type and stage annotations provided by the authors. We subset the data by selecting cells annotated as PS, nascent mesoderm, extraembryonic mesoderm, mixed mesoderm and intermediate mesoderm from E6.5, E7.0 and E7.25 stages. Raw data were normalized for library size and mitochondrial counts and scaled using the “SCTransform” function from Seurat 3.1 (Hafemeister & Satija, 2019). Cell cycle score was calculated from scaled data using “CellCycleScoring” function in Seurat package (Butler et al, 2018). This function predicts the cell phase for each cell using G2/M‐ and S‐phase markers provided in the package, and assigns each cell a quantitative G2/M and S score. These scores and predicted phase of each cell are stored in Seurat object metadata. Further, after assigning cells as high‐T or low‐T based on the expression level of Brachyury (cut‐off on scaled expression: > 0.5), UMAP and violin plots of G2M scores were plotted in R. Statistical analysis was performed in R (Student's t‐test).
Author contributions
NM, ED‐G, MS, SS and IM conceptualized the study. NM, ED‐G, WN and MS performed and quantified experiments. ESE and SPS performed single‐cell data analysis. ED‐G designed the synopsis. IM wrote the original draft, which was reviewed and edited by ED‐G, WN, MS, SPS and SS.
Conflict of interest
The authors declare that they have no conflict of interest.
Supporting information
Expanded View Figures PDF
Movie EV1
Movie EV2
Movie EV3
Movie EV4
Movie EV5
Movie EV6
Source Data for Expanded View
Review Process File
Source Data for Figure 1
Source Data for Figure 2
Source Data for Figure 3
Source Data for Figure 4
Source Data for Figure 5
Source Data for Figure 6
Acknowledgements
We thank the animal house facilities. We gratefully acknowledge the Université Libre de Bruxelles light microscopy (LiMiF) core facility (in particular M. Martens and J‐M. Vanderwinden for help with confocal and two‐photon imaging), and the University of Oxford Micron Advanced Bioimaging Unit (supported by Wellcome Strategic Awards 091911/B/10/Z and 107457/Z/15/Z), for their support and assistance in this work. N.M. and E.D.‐G. received a FRIA fellowship of the Fonds de la Recherche Scientifique (FNRS), N.M. was also supported by the “Fonds David et Alice van Buuren” and the “Fondation Jaumotte‐Demoulin”. W.N. was supported by WELBIO (SGR2015). S.S. is funded through Wellcome Senior Investigator Award 105031/C/14/Z. S.P.S. is supported by the FNRS under grant number 34772792 (MISU). I.M. is a FNRS research associate. WELBIO, the FNRS and the Fondation Erasme supported this work.
EMBO Reports (2020) 21: e50944
Data availability
The study includes no data deposited in external repositories. Imaging data are available for sharing upon request.
References
- Abe T, Kutsuna N, Kiyonari H, Furuta Y, Fujimori T (2018) ROSA26 reporter mouse lines and image analyses reveal distinct region‐specific cell behaviors in the visceral endoderm. Development 145: dev165852 [DOI] [PubMed] [Google Scholar]
- Aguilar‐Aragon M, Bonello TT, Bell GP, Fletcher GC, Thompson BJ (2020) Adherens junction remodelling during mitotic rounding of pseudostratified epithelial cells. EMBO Rep 21: e49700 [DOI] [PMC free article] [PubMed] [Google Scholar]
- Ahlstrom JD, Erickson CA (2009) The neural crest epithelial‐mesenchymal transition in 4D: a `tail’ of multiple non‐obligatory cellular mechanisms. Development 136: 1801–1812 [DOI] [PMC free article] [PubMed] [Google Scholar]
- Amat F, Keller PJ (2013) Towards comprehensive cell lineage reconstructions in complex organisms using light‐sheet microscopy. Dev Growth Differ 55: 563–578 [DOI] [PubMed] [Google Scholar]
- Arnold SJ, Robertson EJ (2009) Making a commitment: cell lineage allocation and axis patterning in the early mouse embryo. Nat Rev Mol Cell Biol 10: 91–103 [DOI] [PubMed] [Google Scholar]
- Arnold K, Sarkar A, Yram MA, Polo JM, Sengupta S, Seandel M, Geijsen N (2013) Regeneration and survival of mice. Cell Stem Cell 9: 317–329 [DOI] [PMC free article] [PubMed] [Google Scholar]
- Butler A, Hoffman P, Smibert P, Papalexi E, Satija R (2018) Integrating single‐cell transcriptomic data across different conditions, technologies, and species. Nat Biotechnol 36: 411–420 [DOI] [PMC free article] [PubMed] [Google Scholar]
- Firmino J, Rocancourt D, Saadaoui M, Moreau C, Gros J (2016) Cell division drives epithelial cell rearrangements during gastrulation in chick. Dev Cell 36: 249–261 [DOI] [PMC free article] [PubMed] [Google Scholar]
- Gómez‐Gálvez P, Vicente‐Munuera P, Tagua A, Forja C, Castro AM, Letrán M, Escudero LM (2018) Scutoids are a geometrical solution to three‐dimensional packing of epithelia. Nat Commun 9: 1–14 [DOI] [PMC free article] [PubMed] [Google Scholar]
- Griffiths JA, Lun A (2019) Single‐cell transcriptomics data across mouse gastrulation and early organogenesis. R Package Version 1.1.0 https://github.com/MarioniLab/MouseGastrulationData [DATASET]
- Hafemeister C, Satija R (2019) Normalization and variance stabilization of single‐cell RNA‐seq data using regularized negative binomial regression. Genome Biol 20: 1–15 [DOI] [PMC free article] [PubMed] [Google Scholar]
- Harding MJ, McGraw HF, Nechiporuk A (2014) The roles and regulation of multicellular rosette structures during morphogenesis. Development 141: 2549–2558 [DOI] [PMC free article] [PubMed] [Google Scholar]
- Ichikawa T, Nakazato K, Keller PJ, Kajiura‐Kobayashi H, Stelzer EHK, Mochizuki A, Nonaka S (2013) Live imaging of whole mouse embryos during gastrulation: migration analyses of epiblast and mesodermal cells. PLoS ONE 8: 4–12 [DOI] [PMC free article] [PubMed] [Google Scholar]
- Jackson B, Peyrollier K, Pedersen E, Basse A, Karlsson R, Wang Z, Brakebusch C (2011) RhoA is dispensable for skin development, but crucial for contraction and directed migration of keratinocytes. Mol Biol Cell 22: 593–605 [DOI] [PMC free article] [PubMed] [Google Scholar]
- Kondo T, Hayashi S (2013) Mitotic cell rounding accelerates epithelial invagination. Nature 494: 125–129 [DOI] [PubMed] [Google Scholar]
- Kumar A, Lualdi M, Lewandoski M, Kuehn MR (2008) Broad mesodermal and endodermal deletion of Nodal at postgastrulation stages results solely in left/right axial defects. Dev Dyn 237: 3591–3601 [DOI] [PMC free article] [PubMed] [Google Scholar]
- Kwon GS, Hadjantonakis AK (2009) Transthyretin mouse transgenes direct RFP expression or Cre‐mediated recombination throughout the visceral endoderm. Genesis 47: 447–55 [DOI] [PMC free article] [PubMed] [Google Scholar]
- Kyprianou C, Christodoulou N, Hamilton RS, Nahaboo W, Boomgaard DS, Amadei G, Zernicka‐Goetz M (2020) Basement membrane remodelling regulates mouse embryogenesis. Nature 582: 253–258 [DOI] [PMC free article] [PubMed] [Google Scholar]
- Lee JD, Silva‐Gagliardi NF, Tepass U, McGlade CJ, Anderson KV (2007) The FERM protein Epb4.1 l5 is required for organization of the neural plate and for the epithelial‐mesenchymal transition at the primitive streak of the mouse embryo. Development 134: 2007–2016 [DOI] [PubMed] [Google Scholar]
- Mac Auley A, Werb Z, Mirkes PE (1993) Characterization of the unusually rapid cell cycles during rat gastrulation. Development 117: 873–883 [DOI] [PubMed] [Google Scholar]
- McDole K, Guignard L, Amat F, Berger A, Malandain G, Royer LA, Keller PJ (2018) In toto imaging and reconstruction of post‐implantation mouse development at the single‐cell level. Cell 175: 859–876 [DOI] [PubMed] [Google Scholar]
- Migeotte I, Omelchenko T, Hall A, Anderson KV (2010) Rac1‐dependent collective cell migration is required for specification of the anterior‐posterior body axis of the mouse. PLoS Biol 8: e1000442 [DOI] [PMC free article] [PubMed] [Google Scholar]
- Muzumdar MD, Tasic B, Miyamichi K, Li L, Luo L (2007) A global double‐fluorescent Cre reporter mouse. Genesis 45: 593–605 [DOI] [PubMed] [Google Scholar]
- Nieto MA, Huang RYYJ, Jackson RAA, Thiery JPP (2016) Emt: 2016. Cell 166: 21–45 [DOI] [PubMed] [Google Scholar]
- Pijuan‐Sala B, Griffiths JA, Guibentif C, Hiscock TW, Jawaid W, Calero‐Nieto FJ, Göttgens B (2019) A single‐cell molecular map of mouse gastrulation and early organogenesis. Nature 566: 490–495 [DOI] [PMC free article] [PubMed] [Google Scholar]
- Rakeman AS, Anderson KV (2006) Axis specification and morphogenesis in the mouse embryo require Nap1, a regulator of WAVE‐mediated actin branching. Development 133: 3075–3083 [DOI] [PubMed] [Google Scholar]
- Ramkumar N, Anderson KV (2011) SnapShot: mouse primitive streak. Cell 146: 488 [DOI] [PubMed] [Google Scholar]
- Ramkumar N, Harvey BM, Lee JD, Alcorn HL, Silva‐Gagliardi NF, McGlade CJ, Anderson KV (2015) Protein O‐glucosyltransferase 1 (POGLUT1) promotes mouse gastrulation through modification of the apical polarity protein CRUMBS2. PLoS Genet 11: 1–21 [DOI] [PMC free article] [PubMed] [Google Scholar]
- Ramkumar N, Omelchenko T, Silva‐Gagliardi NF, McGlade CJ, Wijnholds J, Anderson KV (2016) Crumbs2 promotes cell ingression during the epithelial‐to‐mesenchymal transition at gastrulation. Nat Cell Biol 18: 1281–1291 [DOI] [PMC free article] [PubMed] [Google Scholar]
- Rivera‐Pérez JA, Magnuson T (2005) Primitive streak formation in mice is preceded by localized activation of Brachyury and Wnt3. Dev Biol 288: 363–371 [DOI] [PubMed] [Google Scholar]
- Snow MHL (1977) Gastrulation in the mouse: growth and regionalization of the epiblast. J Embryol Exp Morphol 42: 293–303 [Google Scholar]
- Srinivas S, Rodriguez T, Clements M, Smith JC, Beddington RSP (2004) Active cell migration drives the unilateral movements of the anterior visceral endoderm. Development 131: 1157–1164 [DOI] [PubMed] [Google Scholar]
- Stower MJ, Srinivas S (2014) Heading forwards: anterior visceral endoderm migration in patterning the mouse embryo. Philos Trans R Soc B Biol Sci 369: 20130546 [DOI] [PMC free article] [PubMed] [Google Scholar]
- Strzyz PJ, Lee HO, Sidhaye J, Weber IP, Leung LC, Norden C (2015) Interkinetic nuclear migration is centrosome independent and ensures apical cell division to maintain tissue integrity. Dev Cell 32: 203–219 [DOI] [PubMed] [Google Scholar]
- Strzyz PJ, Matejcic M, Norden C (2016) Chapter Three ‐ Heterogeneity, cell biology and tissue mechanics of pseudostratified epithelia: coordination of cell divisions and growth in tightly packed tissues In International Review of Cell and Molecular Biology, Jeon KW. (ed) pp 89–118. London: Academic Press; [DOI] [PubMed] [Google Scholar]
- Trichas G, Begbie J, Srinivas S (2008) Use of the viral 2A peptide for bicistronic expression in transgenic mice. BMC Biol 6: 1–13 [DOI] [PMC free article] [PubMed] [Google Scholar]
- Udan RS, Piazza VG, Hsu C‐W, Hadjantonakis A‐K, Dickinson ME (2014) Quantitative imaging of cell dynamics in mouse embryos using light‐sheet microscopy. Development 141: 4406–4414 [DOI] [PMC free article] [PubMed] [Google Scholar]
- Voiculescu O, Bodenstein L, Lau IJ, Stern CD (2014) Local cell interactions and self‐amplifying individual cell ingression drive amniote gastrulation. ELife 3: e01817 [DOI] [PMC free article] [PubMed] [Google Scholar]
- Wagstaff LJ, Bellett G, Mogensen MM, Münsterberg A (2008) Multicellular rosette formation during cell ingression in the avian primitive streak. Dev Dyn 237: 91–96 [DOI] [PubMed] [Google Scholar]
- Walmsley MJ (2003) Critical roles for Rac1 and Rac2 GTPases in B cell development and signaling. Science 302: 459–462 [DOI] [PubMed] [Google Scholar]
- Williams M, Burdsal C, Periasamy A, Lewandoski M, Sutherland A (2012) The mouse primitive streak forms in situ by initiation of epithelial to mesenchymal transition without migration of a cell population. Dev Dyn 241: 270–283 [DOI] [PMC free article] [PubMed] [Google Scholar]
- Yanagawa N, Sakabe M, Sakata H, Yamagishi T, Nakajima Y (2011) Nodal signal is required for morphogenetic movements of epiblast layer in the pre‐streak chick blastoderm. Dev Growth Differ 53: 366–377 [DOI] [PubMed] [Google Scholar]
Associated Data
This section collects any data citations, data availability statements, or supplementary materials included in this article.
Supplementary Materials
Expanded View Figures PDF
Movie EV1
Movie EV2
Movie EV3
Movie EV4
Movie EV5
Movie EV6
Source Data for Expanded View
Review Process File
Source Data for Figure 1
Source Data for Figure 2
Source Data for Figure 3
Source Data for Figure 4
Source Data for Figure 5
Source Data for Figure 6
Data Availability Statement
The study includes no data deposited in external repositories. Imaging data are available for sharing upon request.