

Abstract
The actin cytoskeleton operates in a multitude of cellular processes including cell shape and migration, mechanoregulation, and membrane or organelle dynamics. However, its filamentous properties and functions inside the mammalian cell nucleus are less well explored. We previously described transient actin assembly at mitotic exit that promotes nuclear expansion during chromatin decondensation. Here, we identify non‐muscle α‐actinin 4 (ACTN4) as a critical regulator to facilitate F‐actin reorganization and bundling during postmitotic nuclear expansion. ACTN4 binds to nuclear actin filament structures, and ACTN4 clusters associate with nuclear F‐actin in a highly dynamic fashion. ACTN4 but not ACTN1 is required for proper postmitotic nuclear volume expansion, mediated by its actin‐binding domain. Using super‐resolution imaging to quantify actin filament numbers and widths in individual nuclei, we find that ACTN4 is necessary for postmitotic nuclear actin reorganization and actin filament bundling. Our findings uncover a nuclear cytoskeletal function for ACTN4 to control nuclear size and chromatin organization during mitotic cell division.
Keywords: actin bundling, chromatin, mitosis, nuclear actin, nuclear expansion
Subject Categories: Cell Adhesion, Polarity & Cytoskeleton; Cell Cycle
Alpha‐actinin‐4 (ACTN4) dynamically associates with and bundles nuclear actin filaments to control the growth of daughter cell nuclei after mitotic cell division to promote chromatin reorganization.
Introduction
The actin cytoskeleton fulfills many essential cellular functions such as membrane protrusion and adhesion, contractility and cytokinesis, polarity, and molecular transport. These functions are executed largely through its ability to dynamically assemble and disassemble filamentous actin (F‐actin). To achieve this, the actin cytoskeleton is controlled through a plethora of actin‐binding and regulatory proteins including factors that promote structural organization for instance through F‐actin cross‐linking or bundling (Chhabra & Higgs, 2007; Lee & Dominguez, 2010).
Although much is known about the dynamics and functions of cellular F‐actin structures, their roles and properties in the nuclear compartment of living cells remain largely unexplored (Plessner & Grosse, 2019). Photobleaching experiments of GFP‐actin suggested the existence of some dynamic equilibrium (McDonald et al, 2006). Recent tools allowing for the direct visualization of nuclear actin assembly in real time have enabled significant insight into the characteristics and functions of the actin cytoskeleton inside the nucleus (Melak et al, 2017). Nuclear actin filaments have thus been directly observed and monitored in live mammalian cells and implicated for example in rapid signaling to transcriptional or chromatin dynamics (Baarlink et al, 2013; Tsopoulidis et al, 2019; Wang et al, 2019), in homology‐directed DNA repair (Schrank et al, 2018) and myosin‐dependent relocalization of heterochromatin breaks (Caridi et al, 2019), in DNA replication (Parisis et al, 2017) or in virus‐induced nuclear envelope disruption and egress of viral particles (Ohkawa & Welch, 2018).
We have previously shown that a dynamic nuclear actin cytoskeleton forms and reorganizes during expansion of daughter cell nuclei after the exit of mitosis (Baarlink et al, 2017). In mammalian cells, nuclear volume expansion after mitosis occurs throughout early G1 when chromatin becomes decondensed to reestablish a functional G1 interphase nucleus, a highly complex process involving nuclear envelope reassembly and reorganization of nuclear architecture (Gerlich et al, 2001; Webster et al, 2009; Schooley et al, 2012; de Castro et al, 2016). We could show that the actin severing and disassembly factor Cofilin‐1 plays a pivotal role in controlling the timing and turnover dynamics of nuclear actin filaments during mitotic exit and nuclear growth (Baarlink et al, 2017). However, how these filaments are organized and assembled or whether other actin‐regulating proteins function during this process was unknown (Moore & Vartiainen, 2017).
Results and Discussion
We previously established a phalloidin‐based nuclear capture assay to identify proteins interacting with endogenous nuclear actin filaments at mitotic exit and identified Cofilin‐1 and its nuclear function in cell division (Baarlink et al, 2017). In addition, this approach revealed non‐muscle α‐actinin 4 (ACTN4) as a top candidate binding nuclear F‐actin at mitotic exit (Baarlink et al, 2017). ACTN4 and its close homologue ACTN1 are spectrin repeat (SR)‐containing proteins forming antiparallel homodimers, thereby facilitating interactions with F‐actin via their N‐terminal actin‐binding domain (ABD) (Fig 1A) and have been implicated in cell adhesion, motility, proliferation, and cancer progression (Honda, 2015). ACTN4 is known as a potent actin bundling and cross‐linking factor (Honda et al, 1998; Hotulainen & Lappalainen, 2006; Courson & Rock, 2010; Travers et al, 2013; Winkelman et al, 2016). Notably, ACTN4 was shown to shuttle between the cytoplasm and the nucleus in a CRM1‐dependent manner (Kumeta et al, 2010). We therefore set out to investigate its potential role for nuclear actin assembly and reorganization during mitotic exit.
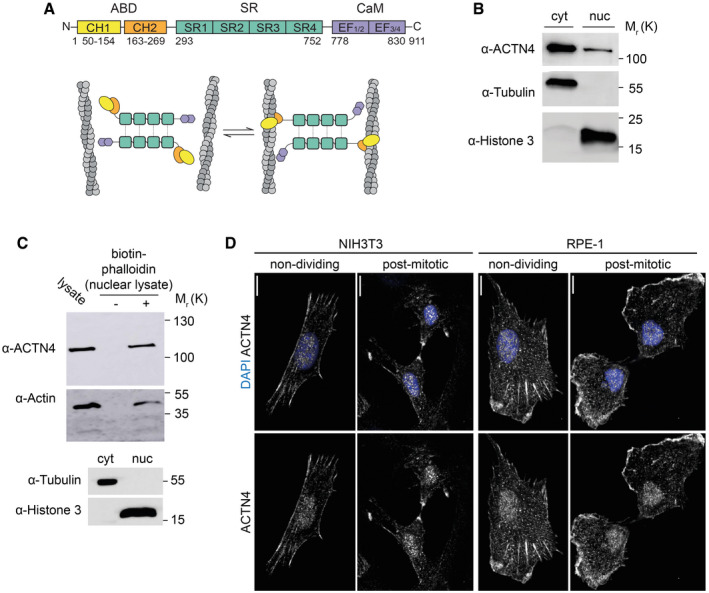
Figure 1. ACTN4 interacts with postmitotic nuclear actin filaments and localizes to the nuclear area of cells.
-
ADomain architecture and putative cross‐linking model of ACTN4 antiparallel dimers. Actin‐binding‐domain (ABD), calponin‐homology (CH1, CH2), spectrin‐repeats (SR), calmodulin‐like domain (CaM), and EF‐Hand domains.
-
BImmunoblots from cytosolic (cyt) and nuclear (nuc) fractionations of RPE‐1 cells in early‐G1 showing the presence of endogenous ACTN4 in nuclear fractions. Proteins were detected with antibodies against (α) ACTN4, α‐Tubulin, or Histone 3 as indicated.
-
CUpper and middle panels: immunoblots showing precipitation of ACTN4 and β‐actin from RPE‐1 nuclear lysates in early‐G1 in the presence or absence of biotin‐phalloidin, as indicated. Lower panel: Immunoblot of cytosolic (cyt) and nuclear (nuc) fractions. Proteins were detected with antibodies against (α) ACTN4, β‐Actin, α‐Tubulin, or Histone 3 as indicated.
-
DImmmunofluorescence images of endogenous ACTN4 in non‐dividing and postmitotic NIH3T3 and RPE‐1 cells as indicated. Shown are maximum intensity projections. Cells were fixed in 4% PFA and stained for ACTN4 and nuclei (DAPI) as indicated. Scale bars 10 μm.
In order to validate ACTN4 as a nuclear F‐actin binding partner in the early G1 phase of the cell cycle, we performed biotin‐phalloidin pulldown assays. For this, RPE‐1 cells were synchronized with the Cdk1 inhibitor RO‐3306 at the G2/M border before washout after 2 h to enrich cells in early G1. Cells were then subjected to subcellular fractionation to obtain nuclear extracts as determined by the presence of histone H3 and the absence of α‐tubulin. Immunoblotting revealed that endogenous ACTN4 was present in nuclear fractions (Fig 1B) and that it was able to interact with endogenous nuclear F‐actin (Fig 1C). Consistent with this, we observed endogenous localization of ACTN4 to the nuclear area of NIH3T3 or RPE‐1 cells by immunostaining at mitotic exit but also in interphase cells (Fig 1D), supporting previous results showing nucleocytoplasmic shuttling of ACTN4 (Kumeta et al, 2010). No obvious difference could be observed in nuclear stainings of ACTN4 at early G1 or in interphase cells (Fig 1D), indicating continuous nuclear distribution or shuttling and no specific nuclear accumulation after mitosis in NIH3T3 and RPE‐1 cells.
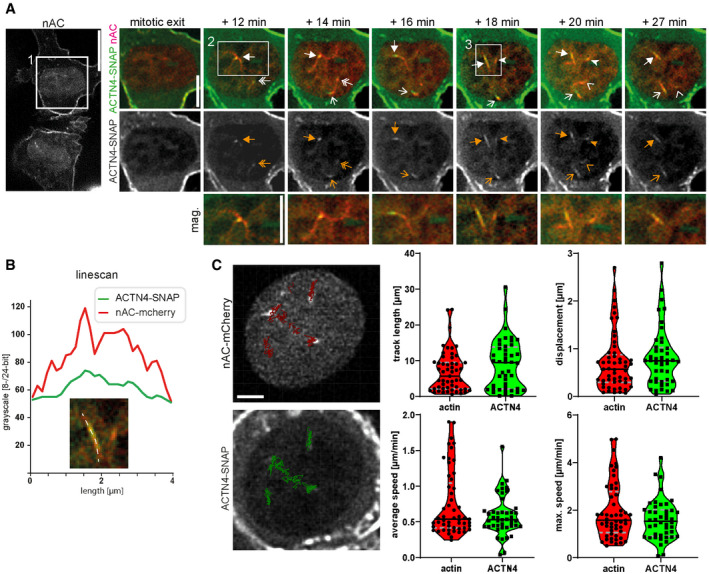
Since we observed interaction of ACTN4 with F‐actin in nuclear fractions, we wanted to assess whether ACTN4 would colocalize with nuclear actin structures during mitotic exit. For this, we used a genetically encoded nuclear‐targeted anti‐actin nanobody (nAC) as previously described (Plessner et al, 2015). This allowed for the visualization of endogenous nuclear actin together with SNAP‐tagged ACTN4 and to follow their distribution and dynamics over time after spontaneous cell division during early G1 of NIH3T3 cells. This revealed the appearance of filamentous actin structures that were decorated by ACTN4 (Figs 2A and B, and EV1). The decoration of ACTN4 could adopt different morphologies from a punctate cluster to a full alignment along an actin bundle. Interestingly, actin and ACTN4 displayed highly dynamic behavior in the nucleus revealing a predominantly synchronized motion (Fig 2A, Movies EV1 and EV2). Mobile actin and ACTN4 clusters were visible over an extended period of time and allowed for automated tracking using Imaris (Fig 2C, Movie EV2). Analysis of track length, track displacement, and average speed showed an analogous motion behavior of actin and ACTN4 reaching in some cases a maximum speed of several μm/min (Fig 2C). This shows that ACTN4 dynamically interacts with actin filaments during F‐actin assembly at mitotic exit, suggesting that ACTN4 may play an important role in spatial reorganization of the nucleus after mitosis.
Figure 2. ACTN4 clusters dynamically associate with postmitotic nuclear actin filaments.
-
ACells in early G1 stably expressing nAC‐mCherry and doxycycline‐inducible ACTN4‐SNAP were analyzed by time‐lapse microscopy. ACTN4‐SNAP was labeled by SNAP‐Cell 647SiR dye (green). Different arrows mark dynamic ACTN4 clusters. The white square 1 is shown as a time series on the right. The white square 2 is shown as a magnification below. The white square 3 shows an actin filament decorated with ACTN4 that was analyzed by linescan in Fig 2B. Scale bar overview (nAC) represents 10 μm. Scale bar time series and magnification 5 μm.
-
BLinescan of an actin filament with associated ACTN4 from square 3 in (A).
-
CAutomated tracking (autoregressive motion) of nuclear actin and ACTN4 in nuclei by Imaris software. Cells were treated like in (A). Tracks are visualized by red (actin) or green (ACTN4) lines in a representative image (see corresponding Movie EV2). Scale bar is 2 μm. The track length, track displacement (distance between starting point and end point), average speed, and maximum speed were quantified from 3 independent experiments. The black line shows the median and gray dashed lines show the quartiles. Quantifications and images show similar motion characteristics for actin and ACTN4.
Figure EV1. ACTN4 associates with postmitotic nuclear actin filaments.
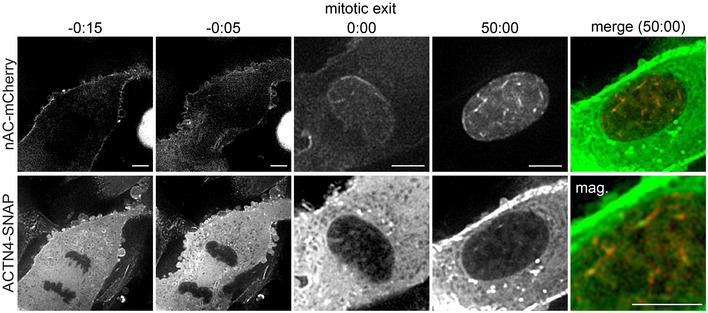
Cells stably expressing nAC‐mCherry and doxycycline‐inducible ACTN4‐SNAP were analyzed by time‐lapse microscopy. The cell is an alternative example of Fig 2A that additionally covers the mitotic phase. ACTN4‐SNAP was labeled by SNAP‐Cell 647SiR (green). The magnification changes at time point 0:00. Scale bar 5 μm.
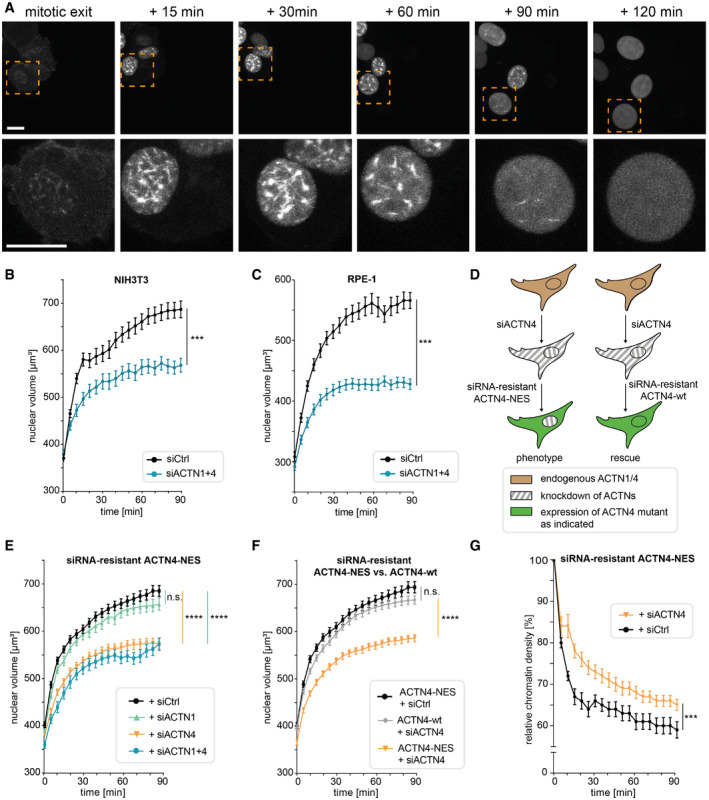
We next wanted to examine whether ACTN4 is involved in nuclear actin‐mediated expansion of daughter cell nuclei after mitosis. We therefore monitored actin assembly at mitotic exit by stably expressing nAC‐mCherry in living NIH3T3 cells (Fig 3A, Movie EV3). As previously shown for nAC‐tagGFP (Baarlink et al, 2017), we could observe the transient and dynamic formation and reorganization of F‐actin structures in expanding daughter cell nuclei that spontaneously disassemble after approximately 90 min (Fig 3A). As an initial loss of function approach, we performed knockdowns of both, non‐muscle isoforms ACTN1 and 4, using RNAi in NIH3T3 and RPE‐1 cells (Fig EV2A–C) expressing H2B‐mCherry to visualize nuclei. Z‐stacks of nuclei were obtained every 5 min for 90 min after mitotic exit. 3D reconstructed nuclear surfaces and corresponding volume measurements were obtained using Imaris. Notably, double knockdown of ACTN1 and ACTN4 in NIH3T3 resulted in a significant decrease in nuclear volume within 90 min after mitotic exit (Fig 3B), which was slightly more pronounced in RPE‐1 cells (Fig 3C). Postmitotic cells fixed and stained for F‐actin using phalloidin did not exhibit any obvious overall size differences (Fig EV3A). We also analyzed and quantified the effects of ACTN4 siRNA treatments on cytoplasmic volume in early G1 on fixed NIH3T3 cells using Imaris. This showed that cytoplasmic volumes were unaffected by ACTN4 depletion while nuclear size was significantly reduced (Fig EV3B–D).
Figure 3. Nuclear ACTN4 is required for nuclear volume expansion after mitotic exit.
-
ANIH3T3 cells expressing nAC‐mCherry were imaged for 120 min. Image frames represent maximum projections of 30 Z planes. Lower panel is a magnification of the indicated area (orange box); scale bars 10 μm.
-
BNIH3T3 cells stably expressing H2B‐mCherry were transfected with siCtrl or siACTN1 + siACTN4. After mitotic exit, z‐stacks (30 planes) were acquired every 5 min. Nuclei were 3D‐reconstructed, and volume was measured by Imaris. Data are mean ± SEM from 3 biological replicates with 22–27 (siCtrl) and 32–42 (siACTN1 + 4) analyzed nuclei; ***P < 0.001 by Wilcoxon test and ****P < 0.0001 by t‐test at 90 min.
-
CRPE‐1 cells were analyzed as in (B). Data are mean ± SEM from five biological replicates with 32–37 (siCtrl) and 31–39 (siACTN1 + 4) analyzed nuclei; ***P < 0.001 by Wilcoxon test and ****P < 0.0001 by Mann–Whitney test at 90 min.
-
DCartoon illustrating experimental design of knockdown and reconstitution experiments in (E, F, and G) to achieve cells lacking ACTN4 specifically in the nuclear compartment (left) versus cells expressing ACTN4‐wt.
-
ENIH3T3 cells stably expressing H2B‐mCherry and siRNA‐resistant ACTN4‐NES were transfected with the indicated siRNAs and analyzed as described in (B). Data are mean ± SEM from five biological replicates with 63–71 (siCtrl), 37–41 (siACTN1 + 4), 52–58 (siACTN1), and 52–55 (siACTN4) analyzed nuclei; ****P(siACTN4) < 0.0001; ****P(siACTN1 + 4) < 0.0001 by one‐way ANOVA at 90 min.
-
FNIH3T3 cells stably expressing H2B‐mCherry and the indicated ACTN4 mutants were transfected with the indicated siRNAs and analyzed as in (B). Data are mean ± SEM from three biological replicates with 63–69 (ACTN4 wt + siACTN4), 63–71 (ACTN4‐NES + siCtrl) and 54–58 (ACTN4‐NES + siACTN4) analyzed nuclei; ****P(ACTN4‐NES + siACTN4) < 0.0001 by one‐way ANOVA at 90 min.
-
GNIH3T3 cells expressing siRNA‐resistant ACTN4‐NES were transfected with siCtrl or siACTN4; chromatin density was calculated from H2B‐mCherry fluorescence intensities by total nuclear volumes (intensity/μm3) and normalized to t = 0 (mitotic exit); Data are mean ± SEM from five biological replicates with 44–48 (siCtrl) and 44–47 (siACTN4) analyzed nuclei; ***P < 0.001 by Wilcoxon test and *P < 0.05 by t‐test at 90 min.
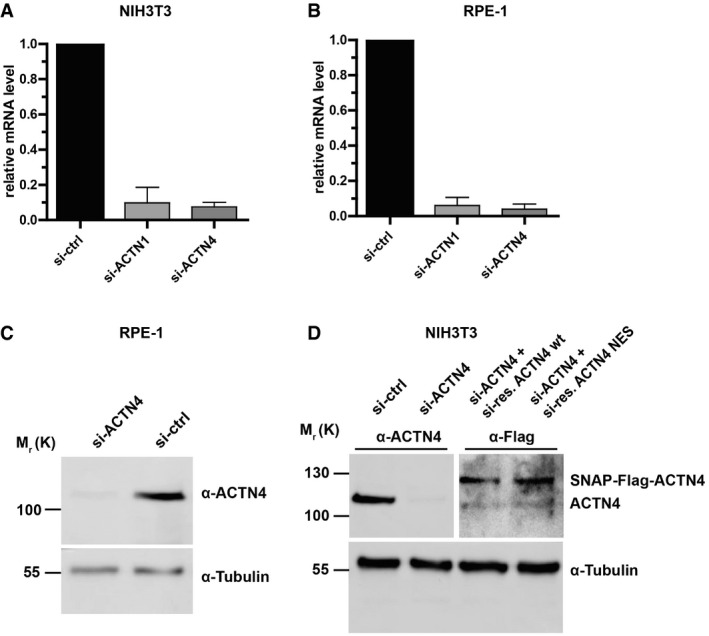
Figure EV2. Representative Western blots and qPCR data for knockdown and reconstitution experiments.
-
AqPCR results for knockdown efficiency of ACTN1 (si‐ACTN1) and ACTN4 (si‐ACTN4) mRNA levels in NIH3T3 cells. Data are mean ± SD of three biological replicates.
-
BqPCR results for knockdown efficiencies of ACTN1 (si‐ACTN1) and ACTN4 (si‐ACTN4) mRNA levels in RPE‐1 cells. Data are mean ± SD of three biological replicates.
-
CImmunoblot displaying knockdown efficiency of ACTN4 (si‐ACTN4) in RPE‐1 cells (α‐ACTN4).
-
DImmunoblots displaying ACTN4‐knockdown efficiency (si‐ACTN4) in NIH3T3 cells (α‐ACTN4) and re‐expression of siRNA‐resistant (si‐res.) SNAP‐Flag-ACTN4‐wt and SNAP‐Flag-ACTN4‐NES, detected by anti‐Flag antibodies (α‐Flag).
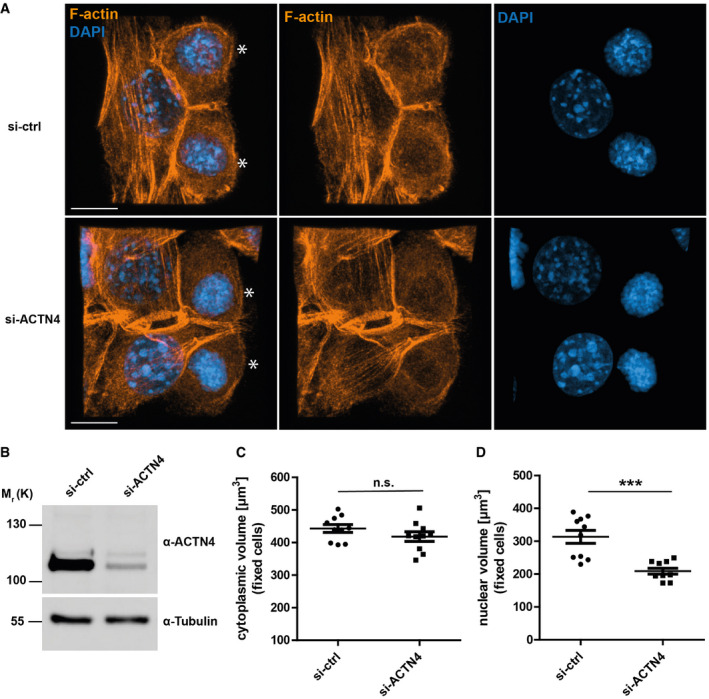
Figure EV3. Nuclear and cytoplasmic volume measurements of fixed NIH‐3T3 cells silenced for ACTN4.
-
AFluorescence image example of fixed NIH3T3 cells in early‐G1 (mitotic cells are indicated by asterisks), stained with Phalloidin (orange) for F‐actin and DAPI (blue) for nuclei. Shown is a maximum intensity projection that was used for further analysis to determine volume parameters using Imaris (z‐distance: 0,14 μm), scale bar: 10 μm. Note the smaller nuclei and more condensed DNA in si‐ACTN4 postmitotic cells.
-
BImmunoblot showing ACTN4‐knockdown (si‐ACTN4) in NIH3T3 cells.
-
CDot plots of cytoplasmic volumes from fixed NIH3T3 cells in early‐G1 for control (siCtrl) and ACTN4‐knockdown (si‐ACTN4) conditions. Data are mean ± SEM from 2 biological replicates with 5 cells each, two‐tailed t‐test.
-
DDot plots of nuclear volumes from fixed NIH3T3 cells in early‐G1 for control (siCtrl) and ACTN4‐knockdown (si‐ACTN4) conditions. Data are mean ± SEM from 2 biological replicates with 5 cells each analyzed as two‐tailed t‐test; ***P < 0.001.
Since silencing of ACTNs could lead to cytoplasmic cytoskeletal defects that might conceal alterations in its nuclear functions, we decided to employ reconstitution studies using siRNA‐resistant ACTN4 derivatives fused to a nuclear export signal (NES) versus ACTN4 wild‐type (ACTN4‐wt) control to specifically study ACTN4 depletion in the nucleus (Fig 3D). Interestingly, cells silenced for ACTN4 or double‐silenced for ACTN1 and ACTN4 that expressed siRNA‐resistant ACTN4‐NES displayed significantly reduced nuclear volume expansion after mitotic exit (Figs 3E and EV2D). Notably, knockdown of ACTN1 alone did not lead to significant reduction in nuclear volume expansion under these conditions (Fig 3E), indicating that nuclear ACTN4 but not ACTN1 is required for correct volume expansion of daughter cell nuclei after mitotic exit.
Next, we reconstituted ACTN4 knockdown cells by re‐expression of siRNA‐resistant ACTN4‐wt (Fig EV2D), which fully restored nuclear volume expansion (Fig 3F). This underscores the importance for an ACTN4 function inside the nuclear compartment. Consistent with this notion and in line with our previous findings that nuclear actin assembly promotes chromatin decondensation during nuclear expansion (Baarlink et al, 2017), we observed significantly higher chromatin densities at mitotic exit in ACTN4 silenced cells expressing siRNA‐resistant ACTN4‐NES (Fig 3G). Together, these data reveal a specific nuclear function for ACTN4 but not ACTN1 in promoting nuclear expansion and chromatin organization after cell division.
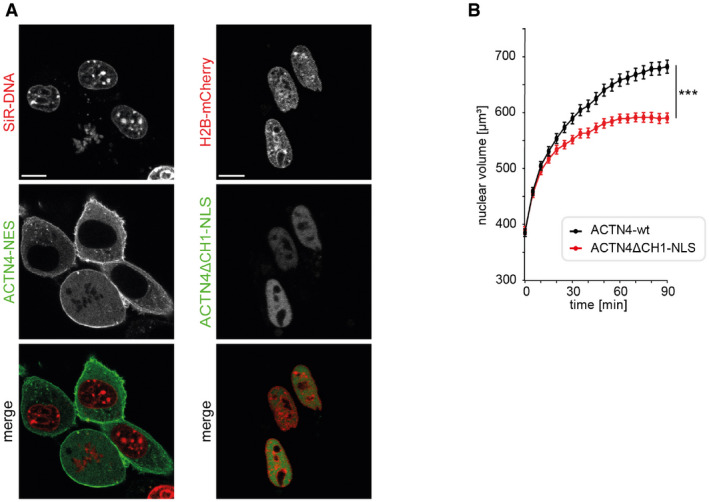
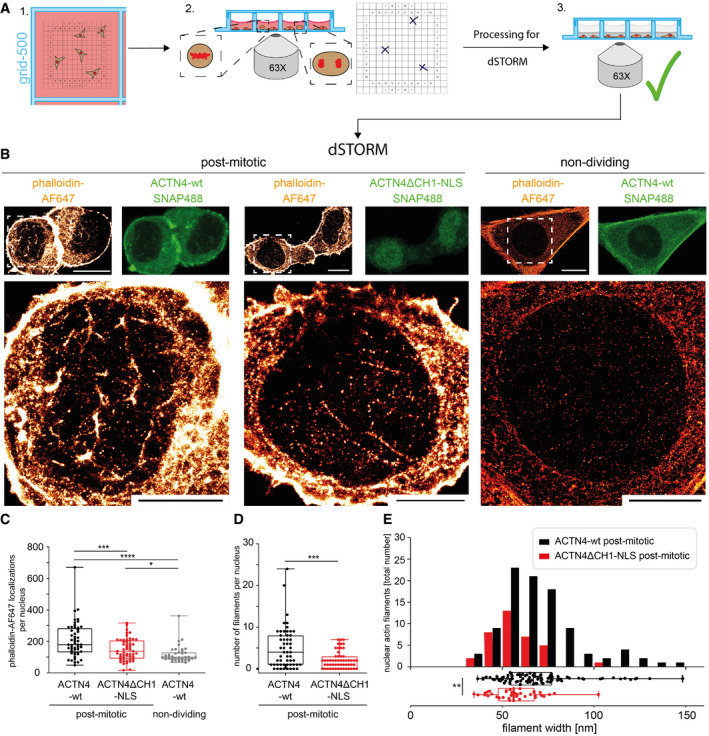
To assess the role of ACTN4‐mediated actin rearrangement in the nucleus, we disrupted the N‐terminal ABD by deleting its calponin‐homology 1 (CH1) domain and fused it to a nuclear localization signal (ACTN4ΔCH1‐NLS) for nuclear targeting. As expected, ACTN4ΔCH1‐NLS showed a predominant nuclear localization (Fig EV4). Notably, NIH3T3 cells expressing ACTN4ΔCH1‐NLS displayed significantly reduced nuclear volume expansion after mitotic exit as compared to ACTN4‐wt expressing cells (Fig EV4). We therefore decided to use this ACTN4ΔCH1‐NLS inhibitory approach to specifically investigate the impact of nuclear ACTN4 on F‐actin formation in early G1. Quantifying F‐actin formation is a challenge since a single actin filament measures only 5–7 nm in diameter (Grazi, 1997). In addition, accurate quantification of nAC‐mCherry signal is not possible because the actin chromobody labels both G‐actin and F‐actin, leading to high background signals. We therefore performed live cell imaging of cells undergoing mitosis followed by subsequent phalloidin‐AlexaFluor647 staining to exclusively label F‐actin and to perform super‐resolution microscopy imaging of the same cells at mitotic exit (Fig 4A). By direct stochastic optical reconstruction microscopy (dSTORM) imaging (Endesfelder & Heilemann, 2015), we were able to reveal nuclear actin filament formation in cells expressing ACTN4ΔCH1‐NLS or ACTN4‐wt and to analyze the number and thickness of filament bundles. Non‐dividing cells expressing ACTN4‐wt were used to determine the background signal that could either be caused by non‐specifically bound phalloidin molecules or by very short F‐actin polymers (Fig 4B). Interestingly, nuclei of ACTN4ΔCH1‐NLS postmitotic cells exhibited significantly fewer fluorophore (phalloidin‐AF647) localizations than ACTN4‐wt cells (Fig 4C) and this decrease was comparable to non‐dividing cells expressing ACTN4‐wt (Fig 4C). In contrast, nuclei of postmitotic ACTN4‐wt cells displayed significantly more fluorophore localizations per nuclear area as well as a significantly higher actin fiber number than ACTN4ΔCH1‐NLS cells (Fig 4D), indicating that the ACTN4 derivative lacking the ABD interferes with proper nuclear F‐actin bundle formation at mitotic exit. Notably, while we observed fewer F‐actin structures in ACTN4ΔCH1‐NLS nuclei, those filaments displayed significantly decreased widths as compared to ACTN4‐wt (Fig 4E). We hence determined the resolution of our dSTORM images to estimate the expected widths of single actin filaments. By measuring the experimental localization precision by NeNA (Endesfelder et al, 2014), which ranged from 10 to 15 nm in all images, we could approximate our resolution to about 35 nm. Accounting for the actual width of a single actin filament of 5–7 nm, the size of phalloidin‐AF647 molecules of about 2–3 nm used for labeling the structures (Turkowyd et al, 2016), and the precision of image drift correction of 3–4 nm (Balinovic et al, 2019), we thus expected single filaments to appear at widths of around 45–50 nm in our images. Therefore, we conclude that nuclei of ACTN4ΔCH1‐NLS expressing cells mainly exhibited few single actin filaments, whereas the ACTN4‐wt expressing cells displayed thicker and more abundant F‐actin structures resembling bundled actin filaments (Fig 4B, D and E).
Figure EV4. Localization of ACTN4ΔCH1‐NLS and ACTN4‐NES. Effects of ACTN4ΔCH1‐NLS on nuclear volume expansion after mitotic exit.
-
ANIH3T3 cells expressing H2B‐mCherry and the indicated ACTN4 constructs were stained by SNAP488; scale bars 10 μm.
-
BNIH3T3 cells stably expressing H2B‐mCherry were transfected with ACTN4‐wt and ACTN4ΔCH1‐NLS. After mitotic exit, z‐stacks (30 planes) were acquired, every 5 min. Nuclei were 3D‐reconstructed, and volume was measured by Imaris software. Data are shown as mean ± SEM from 4 biological replicates with 56–62 nuclei (ACTN4‐wt) and 51–57 nuclei (ACTN4ΔCH1‐NLS); ***P < 0.001 by Wilcoxon test and ****P < 0.0001 by t‐test at 90 min.
Figure 4. ACTN4 is necessary for postmitotic nuclear actin assembly and actin filament bundling.
-
ALive imaging in NIH3T3 cells expressing ACTN4 constructs stained with SNAP488 provided positions of mitotic cells. After fixation, cells were stained with phalloidin‐AlexaFluor647, rechecked for proper processing, and transferred to dSTORM imaging.
-
BUpper panel shows expression of ACTN4 constructs (green, confocal image) and phalloidin‐AF647 staining in the same cells (orange, dSTORM image) scale bar 10 μm; lower panel represents zoom of the indicated areas (white boxes); scale bars 5 μm.
-
CPhalloidin‐AF647 localizations per postmitotic nuclei; data shown as mean ± 2.5–97.5 percentile: 52 ACTN4‐wt nuclei, 55 ACTN4ΔCH1‐NLS nuclei and 40 nuclei of non‐dividing cells (ACTN4‐wt) from 5 biological replicates. ***P(ACTN4ΔCH1‐NLS postmitotic) < 0.001, ****P(ACTN4‐wt non‐dividing) < 0.0001, *P (ACTN4ΔCH1‐NLS postmitotic versus ACTN4‐wt non‐dividing) < 0.05 by One Way ANOVA.
-
DNumber of filaments in the postmitotic nuclei; as in (C); data shown as mean ± 2.5–97.5 percentile: 52 ACTN4‐wt nuclei, 55 ACTN4ΔCH1‐NLS nuclei from 5 biological replicates, ***P < 0.001 by t‐test.
-
EActin filament widths for ACTN4‐wt and ACTN4ΔCH1‐NLS in early G1 nuclei;); data shown as mean ± 2.5–97.5 percentile with 96 filaments (ACTN4‐wt) and 36 filaments (ACTN4ΔCH1‐NLS) from 5 biological replicates, **P < 0.01 by t‐test.
Here, we found that postmitotic nuclear volume expansion is dependent on ACTN4. The underlying mechanism appears to be based on the ability of ACTN4 to bundle actin filaments (Honda et al, 1998; Winkelman et al, 2016); however, we also observed a role for actin assembly by nuclear ACTN4. Interestingly, ACTN4 has been previously shown to affect actin assembly or filament turnover (Kemp & Brieher, 2018). Hence, it is conceivable that a coordinated mechanism between actin assembly and bundling might be at work, further emphasizing the highly complex and dynamic nature of the actin cytoskeleton. It is tempting to speculate that nuclear actin bundles may enable the incorporation of myosin and thus the formation of contractile bundles that could generate forces to allow expansion of the nuclear lamina and chromatin rearrangement. Such hypothesis is further supported by a recent study visualizing single myosin IV molecules moving along intranuclear actin filaments to support long‐range chromatin rearrangements (preprint: Große‐Berkenbusch et al, 2020). Future studies will aim to identify ACTN4 interacting factors and to address the potential role of myosins in postmitotic nuclear expansion and chromatin reorganization.
Materials and Methods
Cell culture, transfection, and viral transduction
HEK293T, NIH3T3, and RPE‐1 were maintained in DMEM (HPSTA—high glucose, stable glutamine, and sodium pyruvate; Capricorn Scientific) supplemented with 10% fetal calf serum (FCS; Thermo Fisher Scientific) under standard conditions at 37°C in a 5% CO2 environment. HEK293T cells were transfected using the calcium phosphate method. NIH3T3 and RPE‐1 cells were transfected using Lipofectamine 2000 (Thermo Fisher Scientific) following manufacturer's protocol. Gene silencing was obtained by RNAi. Cells were transfected with siRNAs (FlexiTube, Qiagen) using Lipofectamine RNAiMAX (Thermo Fisher Scientific) following manufacturer's protocol. Following siRNAs were used: AllStars Negative Control siRNA: AATTCTCCGAACGTGTCACGT; Mm_ACTN1_2: CCGAGTTGATTGACTATGGAA; Mm_ACTN4_5: CAGGGATGGGCTCAAACTTAT; Hs_ACTN1_9: GACCATTATGATTCTCAGCAA and Hs_ACTN4_5: ACGCAGCATCGTGGACTACAA. For virus production, HEK293T cells were transfected using calcium phosphate method with 4–6 μg plasmid DNA and 8 μg of each pMD2.G and psPAX2 (Addgene). After 48 h, growth medium containing lentivirus was harvested and added to freshly seeded target cells. Cells were kept under BSL2 conditions until virus titer was under detection limit. If necessary, cells were subjected to FACS‐based cell sorting.
Molecular cloning
DNA fragments were obtained and amplified by PCR using Phusion Hot Start II High‐Fidelity DNA Polymerase (Thermo Fisher Scientific) according to manufacturer′s protocol. Ligation reaction was performed with T4 ligase (Thermo Fisher Scientific) and transformed into DH5α competent bacterial cells. Plasmids were extracted by using the NucleoSpin® Plasmid Miniprep Kit (Macherey‐Nagel). All extracted plasmids were sent for DNA sequencing, conducted by Microsynth SeqLab. Deletion mutants and point mutations were created using the conversion extension method (Ito et al, 1991). To allow for nuclear export, the NES sequence of HIV‐Rev (LPPLERLTL) was inserted at the C‐terminus of ACTN4. Constructs were ligated into pEGFP‐N1 (Clontech) or pSNAP‐Flag‐N1 vector (Baarlink et al, 2017). To create inducible lentiviral constructs, mutants were first subcloned into pEntr11 (Invitrogen) before subcloning into pInducer20 Puro using the LR Clonase™ (Invitrogen), following manufacturer's instructions. The SV40 large T antigen nuclear localization signal (NLS) PPKKKKRKV was used as previously reported (Plessner et al, 2015) and fused to the ACTN4ΔCH1 mutant. siRNA resistance was obtained by mutating 6 bases (the 3rd of each triplet; silent mutations) in the siRNA recognition site of the RNA. Hs siRNAs 1_7 (5′‐AAGGATGATCCACTCACAAAT‐3′) and 4_7 (5′‐ CAGGACATGTTCATCGTCCAT‐3′) were used as templates. Constructs have been verified by sequencing (SeqLab), and functionality was proved by expression and simultaneous RNAi (Western Blot and staining). Constructs are also resistant to Mm siRNA 1_2 and 4_5 and Hs siRNA sequences 1_9 and 4_5.
The following primers were used:
| Product | Templates and primers 5′–3′ |
|---|---|
| ACTN1‐Flag‐N1 |
template: pEGFP‐N1 ACTN1 (Addgene) fw: ATATATCTCGAGATGGACCATTATGATTCTCAGCAAACCAAC rev: ATATATGCGGCCGCCTACTTGTCGTCATCGTCCTTGTAATC |
| ACTN4‐Flag‐N1 |
template: pLenti6.3 Flag ACTN4 (Bodo. B. Beck) fw: ATATATCTCGAGATGGTGGACTACCACGCGGCGAACCAGTC rev: ATATATGCGGCCGCTCACTTGTCGTCATCGTCCTTGTAATCTCCCAGGTCGCTCTCGCCATACAAGGC |
| ACTN1‐SNAP‐Flag‐N1 | template: pEGFP‐N1 ACTN1fw: ATATATCTCGAGATGGACCATTATGATTCTCAGCAAACCAACrev: GAATTCGGAGGTCACTCTCGCCGTACAGC |
| ACTN4‐SNAP‐Flag‐N1 | template: pLenti6.3 Flag ACTN4fw: ATATATCTCGAGATGGTGGACTACCACGCGGCGAACCrev: ATATATGAATTCGCAGGTCGCTCTCGCCATACAAGGCCGTG |
| pEntr11 ACTN4‐SNAP‐Flag | template: ACTN4 SNAP‐Flag‐N1fw: ATATATGGTACCGCATGGTGGACTACCACGCGGCGAACCrev: ATATATCGGCCGCTACTTGTCGTCATCGTCCTTGTAATC |
| ACTN4‐ΔCH1‐SNAP‐Flag‐N1 | template: ACTN4 SNAP‐Flag‐N1fw1: GAGGTCTATATAAGCAGAGCTGGTTTAGfw2: CGTCAGATCCGATACCGCTACCGGACTCrev1: GCCATGGCCTTGTCGTCATCGTCCTTGrev2: CTTCCACGAGATGTCCTGGATGGCCTTCTCCCAGGCCGGGTCC |
| pEntr11 ACTN4‐ΔCH1‐SNAP‐Flag NLS | template: ACTN4 ΔCH1 SNAP‐Flag‐N1fw: ATATATGGTACCGCATGGTGGACTACCACGCGGCGAACCrev1: ATATATCGGCCGCTACTTGTCGTCATCGTCCTTGTAATCrev2: ATATATGCGGCCGCTCAGCCCACCTTCCGCTTTTTCTTAGGCGGTCCrev3: CTTCCGCTTTTTCTTAGGCGGTCCCTTATCGTCGTCATCCTTGTAATCrev4: CGTCGTCATCCTTGTAATCAGACCCACCCAGCCCAGGCTTGCCCAGTCTGTG |
| ACTN4‐NES‐SNAP‐Flag‐N1 | template: ACTN4 SNAP‐Flag‐N1fw: ATATATCTCGAGATGGTGGACTACCACGCGGCGAACCAGTCrev: TATATAGAATTCGTCCTCCTCCCAGCGTCAGCCTCTCCAGCGG |
| pEntr11 ACTN4‐NES‐SNAP‐Flag | template: ACTN4 NES SNAP‐Flag‐N1fw1: ATATATGGTACCGCATGGTGGACTACCACGCGGCGAACCfw2: GCCATGGAGGACCTCCAAGATATGTTTATTGTGCACACCATCGAGGAGATTGrev1: CAATCTCCTCGATGGTGTGCACAATAAACATATCTTGGAGGTCCTCCATGGCrev2: ATATATCGGCCGCTACTTGTCG |
Real‐Time RT–PCR
RNA extraction was performed with TRIzol reagent (Peqlab) according to the manufacturer's protocol. The reverse transcription was obtained using RevertAid Reverse Transcriptase (Fermentas) and RT–PCR following manufacturer's instructions. Attained cDNA was quantified in qPCR using iQ™ SYBR® Green super mix (Bio‐Rad). The following primers were used: GAPDH fw: 5′‐CCCTTCATTGACCTCAACTA‐3′; GAPDH rev: 5′‐CCAAAGTTGTCATGGATGAC‐3′; ACTN1 mm fw: 5′‐GACCATTATGATTCCCAGCAGAC‐3′; ACTN1 mm rev: 5′‐CGGAAGTCCTCTTCGATGTTCTC‐3′; ACTN4 mm fw: 5′‐ATGGTGGACTACCACGCAG‐3′; ACTN4 mm rev: 5′‐CAGCCTTCCGAAGATGAGAGT‐3′; ACTN1 hs fw: 5′‐CAGCGACATCGGTCATCTACATCGG‐3′; ACTN1 hs rev: 5′‐GTTACACATGGAGGCAGCTCAGGTG‐3′; ACTN4 hs fw: 5′‐CTGCTGCACTGTGGCTGCTGGAATC‐3′; ACTN4 hs rev: 5′‐GGCAACCGAGTGGTTCCAGTGGGC‐3′. Relative mRNA levels were calculated using the comparative ΔΔCT model (Rao et al, 2013) normalized to GAPDH cDNA, serving as house‐keeping gene.
Microscopy, live imaging, and image analysis
Images were generated at LSM700 or LSM800, respectively, confocal laser‐scanning microscopes (Zeiss), each equipped with a 63×, 1.4 NA oil objective and the ZEN black (for LSM700) or Zen blue (for LSM800) software (Zeiss) essentially as described previously (Grikscheit et al, 2015; Hinojosa et al, 2017). Cells were grown on glass coverslips and fixed with 4% formaldehyde in PBS for 10 min at room temperature (RT). After fixation, coverslips were washed with PBS, followed by permeabilization with 0.3% Triton X‐100 in PBS for 10 min. Permeabilized cells were blocked in 5% FCS in PBS for 60 min. Primary antibody incubations were performed in 5% FCS in PBS at 4°C over night. After washing with PBS, cells were incubated with secondary antibodies in 5% FCS in PBS for 60 min. Coverslips were mounted with mounting medium (DAKO).
For nuclear and cytoplasmic volume measurements from fixed and Phalloidin/DAPI stained cells, z‐stacks of early G1 cells were acquired and using Imaris as maximum intensity projections using Imaris. Volumes of respective phalloidin fluorescence‐signals (cytosolic volume) and DAPI (nuclear volume) were determined using the surface tool “cell” (Imaris).Live cell imaging was performed with 8 well μ‐slide ibidi chambers (ibidi) in DMEM with 10% FCS at 37°C in a CO2‐humidified incubation chamber (Pecon, CO2 module S1). Cells expressing H2B‐mCherry were used for nuclear volume and chromatin density assays. Images were processed with ZEN blue software and ImageJ/Fiji. Brightness and contrast were optimized, and maximum intensity projections were generated from Z stack images, where indicated. Imaris software (Bitplane) was used to generate 3D surfaces (from 30 Z planes) based on nuclear‐specific signal and to measure respective volumes over time. Chromatin densities were calculated by dividing the sum of H2B mCherry fluorescence intensities by total nuclear volumes (intensity/μm3) (Baarlink et al, 2017). Each value was normalized to the value of corresponding time point 0. For visualization of ACTN4 dynamics, a stable cell line expressing nAC‐mCherry and doxycycline‐inducible ACTN4‐SNAP was used. 24 h before imaging, ACTN4‐SNAP expression was induced by 1 μg/ml doxycycline. SNAP‐tag was labeled prior each experiment with SNAP‐Cell 647SiR (NEB). Cells at mitotic exit (early G1) were identified by following live cells through mitotic cell division under the microscope until cytokinesis when new daughter cell nuclei are formed.
Images were acquired with a CSU‐X1 spinning disk confocal microscope (Yokogawa), with 405/488/561/640 laser lines and a photometrics Prime sCMOS camera. Cells were analyzed with a 100×, 1.46 NA objective at 37°C in a CO2‐humidified incubation chamber. Actin and ACTN4 dynamics were tracked by Imaris using the autoregressive motion algorithm. When necessary, the tracks were corrected by Imaris drift correction.
dSTORM sample preparation, imaging, and image analysis
Cells were cultured in a grid‐500 8 well ibidi (ibidi) and imaged with the 63× objective of a Zeiss LSM 700, and positions of cells in metaphase or anaphase were marked. In early G1, cells were fixed in 1% glutaraldehyde and 0.05% Triton X‐100 in cytoskeleton buffer (CSK) for 1 min at room temperature (RT), followed by a second fixation in 3% glutaraldehyde in CSK for 10 min at RT and a quenching step in 10 mg/ml NaBH4 in water for 10 min. Cells were then blocked with 100 μM L‐lysine (Sigma) in ImageIT™ FX Signal Enhancer (Invitrogen) for 1 h at RT and incubated with a 1:50 dilution of phalloidin‐AF647 (Thermo Fisher Scientific) for 96 h at 4°C. After postfixation with 4% formaldehyde in PBS and washing with 0.05% Tween20 in PBS, IR beads (FluoSphere infrared fluorescent Carboxylate‐Modified Microspheres; Thermo Fisher Scientific) were diluted 1:50 in phenol red‐free matrigel (Corning; VWR) and added to each well. Matrigel was solidified at 37°C for 1 h and postfixed with 4% formaldehyde in PBS for 10 min at RT. PBS was added to avoid drying, and marked positions were verified by confocal imaging prior to dSTORM.
dSTORM experiments were conducted on a customized automated inverted Ti‐Eclipse microscope (Nikon). The imaging procedure was adapted from (Virant et al, 2018). Briefly, the custom build microscope setup contained a CFI Apochromat TIRF 100× oil objective (NA 1.49, Nikon), appropriate dichroic and filters (ZET405/488/561/640 nm dichroic mirror, BrightLine HC 689/23 bandpass, both AHF Analysentechnik), 488 nm and 640 nm lasers (488 nm Sapphire, 640 nm OBIS, both Coherent Inc.), and an emCCD camera iXON ULTRA 888 (Andor) with a pixel size of 129 nm for fluorescence detection. Both lasers were modulated by an acousto‐optical tunable filter (AOTF, Gooch, and Housego). Z‐Focus was controlled by a commercial perfect focus system (Nikon). The setup was operated using a customized version of μManager (Edelstein et al, 2014). Before each imaging experiment, the power of the 640 nm laser was adjusted to a final intensity of 1–2 kWcm−2 in the sample to ensure consistent conditions for different experimental days. Before imaging, PBS was removed from the wells and dSTORM buffer was added: 100 mM mercaptoethylamine (MEA) with a glucose oxygen scavenger system (van de Linde et al, 2011). The sample was illuminated in HILO (Highly Inclined and Laminated Optical sheet, (Tokunaga et al, 2008) mode, and the marked positions were recorded at 20 Hz for 38,000–40,000 frames.
Fluorescent single‐molecule spots from the image acquisition were localized using ThunderSTORM (Ovesný et al, 2014). The localization files were further processed using customized scripts written in Python programming language (Python Software Foundation, https://www.python.org) and were kindly provided by Dr. Bartosz Turkowyd, Endesfelder group, MPI Marburg, to correct for sample drift during image acquisition using the signals from the 100 nm diameter infrared beads in each sample and to filter out‐of‐focus signal (80 nm < PSF sigma< 200 nm, uncertainty < 35 nm). Each corrected file was checked for quality by measuring the full width at half‐maximum (FWHM) of infrared beads. Drift corrections with a resulting FWHM of 70 nm and larger were revisited. From the processed localization files, the final experimental localization precision was determined by calculating the NeNA precision value (Endesfelder et al, 2014). Super‐resolution images were reconstructed with a pixel size of 10 nm using RapidSTORM 3.0 (Wolter et al, 2012) and were processed with a Gaussian blur according to their individual NeNA localization precision. The number of localizations per nucleus was measured by selecting the nuclear region with the software swift (written in C++, Endesfelder group, unpublished) and normalized to the nuclear area. Filament widths were measured with a customized script for Fiji (Schindelin et al, 2012) where filaments were manually selected by a segmented line profile (Virant et al, 2018). To minimize errors due to selection and pixelation, selected areas were shifted 0.5 pixels (corresponding to 5 nm) in all directions. From this, five measurements (ROIs) were attained which were further straightened to remove filament curvatures. After projection of the filament ROIs along their long axis, each profile was fitted by a Gaussian distribution. Resulting values show the full filament width at half‐maximum value. Histogram bin size was determined based on the Freedman‐Diaconis rule (Freedman & Diaconis, 1981). Number of filaments was determined with the script that has also been used for filament width measurements. The number of analyzed filaments was related to each daughter nucleus.
Subcellular fractionation, Co‐Immunoprecipitation, and F‐actin pulldown
For cell cycle experiments, cells were arrested by adding 10 μM of the CDK1 inhibitor RO3306 (Merck) for 18 h before washed out and release (2 h) to conduct experiments when early G1 was reached. Subcellular fractionations and phalloidin‐based pulldowns were performed as described previously (Baarlink et al, 2017). Briefly, cells were pelleted and resuspended before vortexing and centrifugation. The supernatant was used to obtain the cytoplasmic extract. The pelleted nuclei were extracted in lysis buffer before sonication and centrifugation to obtain the nucleoplasmic fraction. Immunoblotting was performed with α‐tubulin as cytoplasmic and histone H3 (Cell Signaling) as nucleoplasmic marker to verify successful fractionation. For co‐immunoprecipitations, agarose beads conjugated with Flag‐M2 antibody (Sigma‐Aldrich) were equilibrated in lysis buffer before subcellular fractionations were loaded onto the beads at 4°C for 90 min. Beads were resuspended processed for Western analysis. Phalloidin pulldown assays were performed with streptavidin magnetic Dynabeads (Thermo Fisher Scientific) and Biotin‐Phalloidin (Thermo Fisher Scientific).
Statistics
Statistical analysis was performed using GraphPad Prism 7. Data are presented as mean ± SEM. Statistical significance was evaluated with two‐way ANOVA for multiple comparisons. For comparison of two groups, an unpaired two‐tailed Student's t‐tests were used when data were normally distributed. Data that did not pass the D'Agostino & Pearson omnibus normality test were compared by the Wilcoxon test (paired) or Mann–Whitney U test. Statistical significance is indicated as *P < 0.05, **P < 0.01, ***P < 0.001, and ****P < 0.0001.
Author contributions
UE and RG conceived and supervised the project; SK, JW, JK, and CS carried out the experiments; DTB and DV carried out experiments; all authors designed experiments and analyzed the data and generated figures; UE and CS drafted manuscript text sections; RG wrote the manuscript.
Conflict of interest
The authors declare that they have no conflict of interest.
Supporting information
Expanded View Figures PDF
Movie EV1
Movie EV2
Movie EV3
Review Process File
Acknowledgements
We thank laboratory members for helpful discussions, Bodo Beck for providing the pLenti6.3 Flag‐ACTN4 plasmid and Bartosz Turkowyd for providing some Python scripts for dSTORM analysis. We further thank Hartmann Raifer (BMFZ core facility, University of Marburg) for FACS analysis. Work in the laboratory of R.G. is funded by the DFG, under Germany's Excellence Strategy (EXC‐2189, project ID: 390939984), the Wilhelm‐Sander‐Foundation (grant ID: 2013.149.2) and the HFSP program (grant ID: RGP0021/2016). Work in the laboratory of U.E. was supported by the Max Planck Society and by SYNMIKRO. C.S. is supported by the DFG (SCHW 1708/2‐1). Open access funding enabled and organized by Projekt DEAL.
EMBO Reports (2020) 21: e50758
Contributor Information
Carsten Schwan, Email: carsten.schwan@pharmakol.uni-freiburg.de.
Ulrike Endesfelder, Email: ulrike.endesfelder@symikro.mpi-marburg.mpg.de.
Robert Grosse, Email: robert.grosse@pharmakol.uni-freiburg.de.
Data availability
No data were deposited in a public database.
References
- Baarlink C, Wang H, Grosse R (2013) Nuclear actin network assembly by formins regulates the SRF coactivator MAL. Science 340: 864–867 [DOI] [PubMed] [Google Scholar]
- Baarlink C, Plessner M, Sherrard A, Morita K, Misu S, Virant D, Kleinschnitz E‐M, Harniman R, Alibhai D, Baumeister S et al (2017) A transient pool of nuclear F‐actin at mitotic exit controls chromatin organization. Nat Cell Biol 19: 1389–1399 [DOI] [PubMed] [Google Scholar]
- Balinovic A, Albrecht D, Endesfelder U (2019) Spectrally red‐shifted fluorescent fiducial markers for optimal drift correction in localization microscopy. J Phys D: Appl Phys 52: 204002 [Google Scholar]
- Caridi CP, Plessner M, Grosse R, Chiolo I (2019) Nuclear actin filaments in DNA repair dynamics. Nat Cell Biol 21: 1068–1077 [DOI] [PMC free article] [PubMed] [Google Scholar]
- de Castro IJ, Gokhan E, Vagnarelli P (2016) Resetting a functional G1 nucleus after mitosis. Chromosoma 125: 607–619 [DOI] [PMC free article] [PubMed] [Google Scholar]
- Chhabra ES, Higgs HN (2007) The many faces of actin: matching assembly factors with cellular structures. Nat Cell Biol 9: 1110–1121 [DOI] [PubMed] [Google Scholar]
- Courson DS, Rock RS (2010) Actin cross‐link assembly and disassembly mechanics for alpha‐Actinin and fascin. J Biol Chem 285: 26350–26357 [DOI] [PMC free article] [PubMed] [Google Scholar]
- Edelstein AD, Tsuchida MA, Amodaj N, Pinkard H, Vale RD, Stuurman N (2014) Advanced methods of microscope control using μManager software. J Biol Meth 1: e10 [DOI] [PMC free article] [PubMed] [Google Scholar]
- Endesfelder U, Malkusch S, Fricke F, Heilemann M (2014) A simple method to estimate the average localization precision of a single‐molecule localization microscopy experiment. Histochem Cell Biol 141: 629–638 [DOI] [PubMed] [Google Scholar]
- Endesfelder U, Heilemann M (2015) Direct stochastic optical reconstruction microscopy (dSTORM). Methods Mol Biol 1251: 263–276 [DOI] [PubMed] [Google Scholar]
- Freedman D, Diaconis P (1981) On the histogram as a density estimator: L 2 theory. Zeitschrift fr Wahrscheinlichkeitstheorie und Verwandte Gebiete 57: 453–476 [Google Scholar]
- Gerlich D, Beaudouin J, Gebhard M, Ellenberg J, Eils R (2001) Four‐dimensional imaging and quantitative reconstruction to analyse complex spatiotemporal processes in live cells. Nat Cell Biol 3: 852–855 [DOI] [PubMed] [Google Scholar]
- Grazi E (1997) What is the diameter of the actin filament? FEBS Lett 405: 249–252 [DOI] [PubMed] [Google Scholar]
- Grikscheit K, Frank T, Wang Y, Grosse R (2015) Junctional actin assembly is mediated by Formin‐like 2 downstream of Rac1. J Cell Biol 209: 367–376 [DOI] [PMC free article] [PubMed] [Google Scholar]
- Große‐Berkenbusch A, Hettich J, Fili TKN, Cook AW, Hari‐Gupta Y, Palmer A, Streit L, Ellis PJI, Toseland CP, Christof J et al (2020) Myosin VI moves on nuclear actin filaments and supports long‐range chromatin rearrangements. BioRxiv 10.1101/2020.04.03.023614 [PREPRINT] [DOI] [Google Scholar]
- Hinojosa LS, Holst M, Baarlink C, Grosse R (2017) MRTF transcription and Ezrin‐dependent plasma membrane blebbing are required for entotic invasion. J Cell Biol 216: 3087–3095 [DOI] [PMC free article] [PubMed] [Google Scholar]
- Honda K, Yamada T, Endo R, Ino Y, Gotoh M, Tsuda H, Yamada Y, Chiba H, Hirohashi S (1998) Actinin‐4, a novel actin‐bundling protein associated with cell motility and cancer invasion. J Cell Biol 140: 1383–1393 [DOI] [PMC free article] [PubMed] [Google Scholar]
- Honda K (2015) The biological role of actinin‐4 (ACTN4) in malignant phenotypes of cancer. Cell Biosci 5: 41 [DOI] [PMC free article] [PubMed] [Google Scholar]
- Hotulainen P, Lappalainen P (2006) Stress fibers are generated by two distinct actin assembly mechanisms in motile cells. J Cell Biol 173: 383–394 [DOI] [PMC free article] [PubMed] [Google Scholar]
- Ito W, Ishiguro H, Kurosawa Y (1991) A general method for introducing a series of mutations into cloned DNA using the polymerase chain reaction. Gene 102: 67–70 [DOI] [PubMed] [Google Scholar]
- Kemp JP, Brieher WM (2018) The actin filament bundling protein α‐actinin‐4 actually suppresses actin stress fibers by permitting actin turnover. J Biol Chem 293: 14520–14533 [DOI] [PMC free article] [PubMed] [Google Scholar]
- Kumeta M, Yoshimura SH, Harata M, Takeyasu K (2010) Molecular mechanisms underlying nucleocytoplasmic shuttling of actinin‐4. J Cell Sci 123: 1020–1030 [DOI] [PubMed] [Google Scholar]
- Lee SH, Dominguez R (2010) Regulation of actin cytoskeleton dynamics in cells. Mol Cells 29: 311–325 [DOI] [PMC free article] [PubMed] [Google Scholar]
- van de Linde S, Löschberger A, Klein T, Heidbreder M, Wolter S, Heilemann M, Sauer M (2011) Direct stochastic optical reconstruction microscopy with standard fluorescent probes. Nat Protoc 6: 991–1009 [DOI] [PubMed] [Google Scholar]
- McDonald D, Carrero G, Andrin C, Vries GD, Hendzel MJ (2006) Nucleoplasmic beta‐actin exists in a dynamic equilibrium between low‐mobility polymeric species and rapidly diffusing populations. J Cell Biol 172: 541–552 [DOI] [PMC free article] [PubMed] [Google Scholar]
- Melak M, Plessner M, Grosse R (2017) Actin visualization at a glance. J Cell Sci 130: 525–530 [DOI] [PubMed] [Google Scholar]
- Moore HM, Vartiainen MK (2017) F‐actin organizes the nucleus. Nat Cell Biol 19: 1386–1388 [DOI] [PubMed] [Google Scholar]
- Ohkawa T, Welch MD (2018) Baculovirus actin‐based motility drives nuclear envelope disruption and nuclear egress. Curr Biol 28: 2153–2159 e2154 [DOI] [PMC free article] [PubMed] [Google Scholar]
- Ovesný M, Křížek P, Borkovec J, Svindrych Z, Hagen GM (2014) ThunderSTORM: a comprehensive ImageJ plug‐in for PALM and STORM data analysis and super‐resolution imaging. Bioinformatics 30: 2389–2390 [DOI] [PMC free article] [PubMed] [Google Scholar]
- Parisis N, Krasinska L, Harker B, Urbach S, Rossignol M, Camasses A, Dewar J, Morin N, Fisher D (2017) Initiation of DNA replication requires actin dynamics and formin activity. EMBO J 36: 3212–3231 [DOI] [PMC free article] [PubMed] [Google Scholar]
- Plessner M, Melak M, Chinchilla P, Baarlink C, Grosse R (2015) Nuclear F‐actin formation and reorganization upon cell spreading. J Biol Chem 290: 11209–11216 [DOI] [PMC free article] [PubMed] [Google Scholar]
- Plessner M, Grosse R (2019) Dynamizing nuclear actin filaments. Curr Opin Cell Biol 56: 1–6 [DOI] [PubMed] [Google Scholar]
- Rao X, Huang X, Zhou Z, Lin X (2013) An improvement of the 2ˆ(–delta delta CT) method for quantitative real‐time polymerase chain reaction data analysis. Biostat Bioinform Biomathem 3: 71–85 [PMC free article] [PubMed] [Google Scholar]
- Schindelin J, Arganda‐Carreras I, Frise E, Kaynig V, Longair M, Pietzsch T, Preibisch S, Rueden C, Saalfeld S, Schmid B et al (2012) Fiji ‐ an open source platform for biological image analysis. Nature methods 9: 676–682 [DOI] [PMC free article] [PubMed] [Google Scholar]
- Schooley A, Vollmer B, Antonin W (2012) Building a nuclear envelope at the end of mitosis: coordinating membrane reorganization, nuclear pore complex assembly, and chromatin de‐condensation. Chromosoma 121: 539–554 [DOI] [PMC free article] [PubMed] [Google Scholar]
- Schrank BR, Aparicio T, Li Y, Chang W, Chait BT, Gundersen GG, Gottesman ME, Gautier J (2018) Nuclear ARP2/3 drives DNA break clustering for homology‐directed repair. Nature 559: 61–66 [DOI] [PMC free article] [PubMed] [Google Scholar]
- Tokunaga M, Imamoto N, Sakata‐Sogawa K (2008) Highly inclined thin illumination enables clear single‐molecule imaging in cells. Nat Methods 5: 159–161 [DOI] [PubMed] [Google Scholar]
- Travers T, Shao H, Wells A, Camacho CJ (2013) Modeling the assembly of the multiple domains of alpha‐actinin‐4 and its role in actin cross‐linking. Biophys J 104: 705–715 [DOI] [PMC free article] [PubMed] [Google Scholar]
- Tsopoulidis N, Kaw S, Laketa V, Kutscheidt S, Baarlink C, Stolp B, Grosse R, Fackler OT (2019) T cell receptor‐triggered nuclear actin network formation drives CD4(+) T cell effector functions. Sci Immunol 4: eaav1987 [DOI] [PubMed] [Google Scholar]
- Turkowyd B, Virant D, Endesfelder U (2016) From single molecules to life: microscopy at the nanoscale. Anal Bioanal Chem 408: 6885–6911 [DOI] [PMC free article] [PubMed] [Google Scholar]
- Virant D, Traenkle B, Maier J, Kaiser PD, Bodenhöfer M, Schmees C, Vojnovic I, Pisak‐Lukáts B, Endesfelder U, Rothbauer U (2018) A peptide tag‐specific nanobody enables high‐quality labeling for dSTORM imaging. Nat Commun 9: 930 [DOI] [PMC free article] [PubMed] [Google Scholar]
- Wang Y, Sherrard A, Zhao B, Melak M, Trautwein J, Kleinschnitz E‐M, Tsopoulidis N, Fackler OT, Schwan C, Grosse R (2019) GPCR‐induced calcium transients trigger nuclear actin assembly for chromatin dynamics. Nat Commun 10: 5271 [DOI] [PMC free article] [PubMed] [Google Scholar]
- Webster M, Witkin KL, Cohen‐Fix O (2009) Sizing up the nucleus: nuclear shape, size and nuclear‐envelope assembly. J Cell Sci 122: 1477–1486 [DOI] [PMC free article] [PubMed] [Google Scholar]
- Winkelman JD, Suarez C, Hocky GM, Harker AJ, Morganthaler AN, Christensen JR, Voth GA, Bartles JR, Kovar DR (2016) Fascin‐ and alpha‐actinin‐bundled networks contain intrinsic structural features that drive protein sorting. Curr Biol 26: 2697–2706 [DOI] [PMC free article] [PubMed] [Google Scholar]
- Wolter S, Löschberger A, Holm T, Aufmkolk S, Dabauvalle M‐C, van de Linde S, Sauer M (2012) rapidSTORM: accurate, fast open‐source software for localization microscopy. Nat Methods 9: 1040–1041 [DOI] [PubMed] [Google Scholar]
Associated Data
This section collects any data citations, data availability statements, or supplementary materials included in this article.
Supplementary Materials
Expanded View Figures PDF
Movie EV1
Movie EV2
Movie EV3
Review Process File
Data Availability Statement
No data were deposited in a public database.