

Abstract
In mammalian interphase nuclei, more than one thousand large genomic regions are positioned at the nuclear lamina (NL). These lamina‐associated domains (LADs) are involved in gene regulation and may provide a backbone for the folding of interphase chromosomes. Little is known about the dynamics of LADs during interphase, in particular at the onset of G1 phase and during DNA replication. We developed an antibody‐based variant of the DamID technology (named pA‐DamID) that allows us to map and visualize genome–NL interactions with high temporal resolution. Application of pA‐DamID combined with synchronization and cell sorting experiments reveals that LAD–NL contacts are generally rapidly established early in G1 phase. However, LADs on the distal ~25 Mb of most chromosomes tend to contact the NL first and then gradually detach, while centromere‐proximal LADs accumulate gradually at the NL. Furthermore, our data indicate that S‐phase chromatin shows transiently increased lamin interactions. These findings highlight a dynamic choreography of LAD–NL contacts during interphase progression and illustrate the usefulness of pA‐DamID to study the dynamics of genome compartmentalization.
Keywords: cell cycle, DamID, genome organization, nuclear lamina, telomeres
Subject Categories: Chromatin, Epigenetics, Genomics & Functional Genomics; Methods & Resources
pA‐DamID generates “snapshots” of protein – genome interactions by microscopy and by genome‐wide mapping. It here reveals the dynamics of chromosome positioning relative to the nuclear lamina during the cell cycle.
Introduction
The nuclear lamina (NL) is a protein layer underneath the inner nuclear membrane, consisting of lamins and a variety of other proteins. The NL is thought to serve as an anchoring platform for the genome. DNA contacts the NL through large genomic regions named lamina‐associated domains (LADs; Guelen et al, 2008). Mammalian cells have approximately one thousand LADs that are distributed across the genome. LADs have a median size of ~0.5 Mb and jointly cover 30–50% of the genome. LADs are associated with gene repression and have been hypothesized to form a backbone for genome organization (Luperchio et al, 2014; Gonzalez‐Sandoval & Gasser, 2016; van Steensel & Belmont, 2017; Collas et al, 2019; Lochs et al, 2019; Shevelyov & Ulianov, 2019).
When dividing cells enter prophase, LADs lose their NL contacts concomitant with chromosome condensation (Kind et al, 2013). In metaphase, the NL is disassembled and most of its proteins are excluded from the chromatin (Gerace et al, 1978; Moir et al, 2000a). After completion of mitosis, the NL reforms around the still‐condensed DNA. B‐type lamins localize at the surface of the decondensing chromosomal mass, while Lamin A is initially present throughout the chromatin and only later concentrates at the nuclear periphery (Moir et al, 2000b; Dechat et al, 2004). The formation of a functional NL is dependent on various other NL‐localizing proteins that all have distinct reassembly kinetics and functions (Ellenberg et al, 1997; Dechat et al, 2000, 2004; Haraguchi et al, 2008).
How LAD–NL contacts are re‐established during telophase and early interphase is poorly understood. From a genomic perspective, it is not known whether all LADs engage equally in these early contacts, or whether a specific subset of LADs acts as early nucleation sites, with the remainder following later. Microscopy studies found that telomeres are enriched near the NL in early G1 phase, leading to the hypothesis that telomeres may assist in NL reassembly onto chromatin (Dechat et al, 2004; Crabbe et al, 2012). Whether other chromosomal regions also engage in early contacts with the NL is not known, because systematic analysis of these contacts has not been possible. Similarly, it is not known how the NL contacts of individual LADs are established. For example, it is conceivable that these contacts initiate at specific sequences within LADs, such as LAD boundaries or internal sites, and then gradually spread to cover entire LADs. Testing such models requires mapping of LAD–NL contacts with high temporal resolution.
It is also poorly understood how LAD–NL contacts develop throughout interphase. Microscopy studies have shown that chromatin is relatively mobile early after cell division, but a few hours into interphase this mobility becomes substantially constrained (Abney et al, 1997; Marshall et al, 1997; Thomson et al, 2004) and LADs show only movements over a range of ~0.5 μm (Chubb et al, 2002; Kind et al, 2013). It may thus be expected that genome–NL contacts do not change much after their establishment, but this has not been investigated by genome‐wide analysis.
Similarly, little data are available on the dynamics of LADs during S‐phase. This is of interest, because several links have been reported between the NL and DNA replication. Mid‐ to late‐replicating DNA is concentrated near the NL, and genome‐wide maps show that late‐replicating DNA overlaps strongly with LADs (Hiratani et al, 2008; Peric‐Hupkes et al, 2010). A handful of studies have implicated a role for B‐type lamins in replication, but the direct role of the lamina in this process remains unclear (reviewed in ref. Hutchison, 2014). These observations raise the interesting question whether interactions of LADs with the NL are subject to changes during S‐phase.
So far, the cell cycle dynamics of genome–NL interactions have primarily been studied by microscopy. While these studies have been highly informative, they were often limited to a few selected loci or visualized bulk LADs without the ability to track individual loci. Hence, a genome‐wide view of the dynamics of LAD–NL interactions is still lacking. For genome‐wide mapping of NL interactions, DamID has been the major method (Pickersgill et al, 2006; Guelen et al, 2008). DamID is based on expression of a fusion protein of Dam and a NL protein (e.g., Lamin B1), which results in gradual accumulation of adenine methylation (m6A) on DNA that contacts the NL (van Steensel & Henikoff, 2000). This m6A‐labeled DNA is then amplified and sequenced. An added advantage of DamID is that the m6A tags can be detected by a fluorescently labeled m6A‐Tracer protein (Kind et al, 2013). This enables visualization of genome–NL contacts in situ, which greatly assists in the interpretation of genome‐wide DamID mapping data.
However, a major limitation of DamID is its poor temporal resolution. The activation of Dam and deposition of m6A requires at least several hours (Vogel et al, 2007; Kind et al, 2013), precluding detailed analysis of the NL interaction dynamics. To overcome these limitations, we developed pA‐DamID—a hybrid of DamID and the CUT&RUN method (Skene & Henikoff, 2017). This allows for both mapping and visualization of NL contacts with high temporal resolution. Using pA‐DamID, we show that after mitosis NL contacts do not initiate at defined loci, but rather are widespread with an enrichment at LADs on distal regions of chromosomes. Furthermore, small LADs appear to be gradually displaced from the NL by larger LADs. Additionally, we found that replicating DNA shows transiently increasing lamin contacts.
Results
Principle of pA‐DamID to map and visualize NL‐associated DNA
The pA‐DamID method is a hybrid of the CUT&RUN and DamID technologies (Fig 1A). In CUT&RUN, cells are permeabilized and incubated with an antibody against a nuclear protein of interest, followed by protein A (pA) fused to micrococcal nuclease (MNase). Subsequent activation of the tethered MNase by Ca++ ions results in excision of DNA sequences that are in molecular proximity to the protein of interest. These sequences are then identified by high‐throughput sequencing (Skene & Henikoff, 2017). For pA‐DamID, we used a highly similar strategy, except that we replaced the pA‐MNase fusion protein by a pA‐Dam fusion protein, which is then activated by addition of its methyl donor S‐adenosyl‐methionine (SAM). This results in adenine methylation (m6A) of DNA that is in molecular proximity of the protein of interest. The pattern of deposited m6A can then be mapped genome‐wide as in conventional DamID (Vogel et al, 2007).
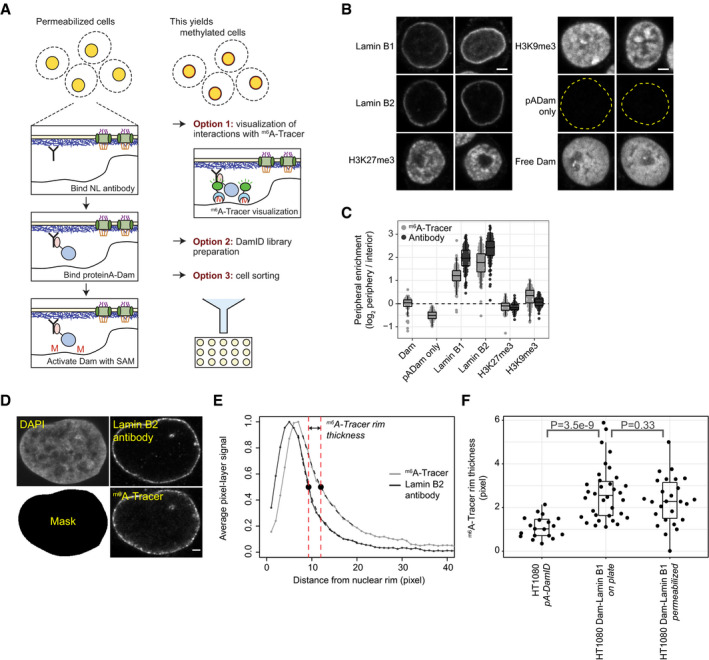
Figure 1. pA‐DamID can visualize NL interactions and does not affect peripheral genome organization.
-
ASchematic overview of pA‐DamID. Permeabilized cells are incubated with a primary antibody against a NL component, which in turn is bound by a pA‐Dam fusion protein. Nearby DNA is then m6A methylated upon Dam activation by incubation with SAM. The m6A pattern can be visualized by staining with fluorescent m6A‐Tracer protein, or mapped genome‐wide. Optionally, cells can be flow sorted to isolate specific cell populations prior to genome‐wide mapping of m6A. All steps are performed on ice, with the exception of 30‐minute Dam activation at 37°C.
-
BRepresentative confocal microscopy sections of m6A‐Tracer signal in HAP‐1 cells following pA‐DamID with indicated antibodies. pA‐Dam only: primary antibody was omitted, the dotted yellow line indicates DAPI segmentation. Free Dam: permeabilized cells were treated with freely diffusing pure Dam protein and SAM for 30 min. Scale bar corresponds to 2 μm.
-
CQuantification of peripheral enrichment of antibody staining and m6A‐Tracer signals after pA‐DamID with indicated antibodies. The nuclear rim and interior were segmented using DAPI signal and the mean m6A or antibody signal was determined and transformed to a log2 ratio. The nuclear rim mask extends slightly beyond the NL, resulting in underestimation of the real enrichment. Boxplots: horizontal lines represent 25th, 50th, and 75th percentiles; whiskers extend to the smallest values no further than 1.5 times distance between 25th and 75th percentiles. Every point represents a single cell; results are combined from two or three independent experiments.
-
DHT1080 cells expressing inducible Dam‐Lamin B1 (Kind et al, 2013) were treated with Shield1 to induce m6A methylation. Cells were either fixed immediately or processed according to the pA‐DamID protocol (as negative controls) and then fixed on poly‐L-lysine‐coated cover slips. Cells were imaged by confocal microscopy for the NL (Lamin B2 antibody) and methylation (m6A‐Tracer) for both conditions. Laser settings were changed between images to optimize image quality. The mask for defining the nuclear rim was obtained by segmentation of the DAPI image. The scale bar corresponds to 2 μm.
-
EFor every cell, the 50% decay distance from the nuclear periphery was determined for Lamin B2 and m6A‐Tracer by fitting exponential decay functions from the nuclear rim as defined by segmentation of the DAPI image (Mask in D, see Materials and Methods). The difference in 50% decay distance between Lamin B2 and m6A‐Tracer was used as a measure of the thickness of the m6A‐Tracer layer.
-
FDistribution of the m6A‐Tracer layer thickness for HT1080 cells expressing Dam‐Lamin B1, visualized before and after the pA‐DamID protocol. For comparison, a similar analysis was performed with HT1080 cells not expressing Dam‐Lamin B1, subjected to Lamin B2 pA‐DamID. Boxplots are as specified for (C). Every point represents a single cell; results are combined from three biological experiments, where every condition is assayed in at least two of those. Statistical significance was determined using a two‐way Wilcoxon test.
An important advantage of pA‐DamID is that the labeled DNA can also be visualized in situ using the m6A‐Tracer, before this DNA is sequenced. As will be shown below, this microscopy visualization can serve as a powerful quality control (e.g., to check that the tagged DNA is indeed close to the protein of interest) and can provide new biological insights. Additionally, labeled cells can be sorted following pA‐DamID to study (rare) subpopulations of interest.
Proof‐of‐principle of pA‐DamID visualized by m6A‐Tracer staining
First, we expressed and purified pA‐Dam fusion protein (Fig EV1A). We confirmed that the Dam moiety of the fusion protein was active, as judged from its ability to protect an unmethylated plasmid from digestion by the restriction enzyme Mbo I, which only cuts unmethylated GATC motifs (Fig EV1B). In addition, we expressed and purified m6A‐Tracer protein tagged with enhanced GFP (EGFP) (Fig EV1C). Staining of fixed cells expressing either Dam or Dam‐Lamin B1 with this protein showed the expected pan‐nuclear and peripheral fluorescence pattern, respectively (Fig EV1D). We concluded that the purified pA‐Dam and m6A‐Tracer proteins were functional.
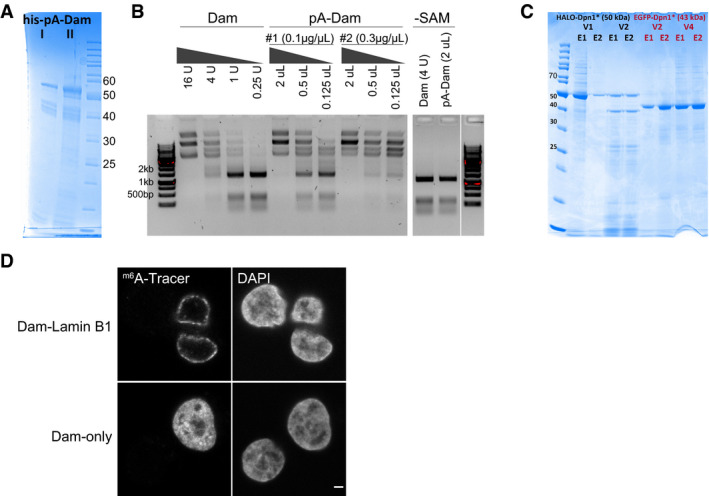
Figure EV1. Production and validation of the pA‐DamID proteins.
-
ASDS–PAGE gel of two batches of bacterial purified pA‐Dam protein (expected molecular weight: 52 kDa) with concentrations of ˜0.1 and ˜0.3 μg/μl, respectively.
-
BAgarose gel analysis of Mbo I protection assay. Unmethylated plasmid is m6A methylated by a range of Dam and pA‐Dam concentrations. The DNA is subsequently digested by Mbo I, which can cut GATC but not Gm6ATC sequences. The pA‐Dam batches have Dam activities estimated to be ˜8 and ˜32 units (see Materials and Methods for definition) per ˜0.1 μg and ˜0.3 μg pA‐Dam protein, respectively. No Mbo I protection is observed without the methyl donor SAM.
-
CSDS–PAGE gel of m6A‐Tracer protein purified from insect cells, with the truncated DpnI fused to EGFP and HALO tags. Two elutions (labeled E1/E2) obtained with two independent baculovirus pools (labeled V1/V2 and V2/V4) produced protein of the expected size (50 and 43 kDa for EGFP and HALO‐tagged protein, respectively) and were pooled.
-
DConfocal sections of m6A‐Tracer signal in HAP‐1 cells transduced with lentivirus expressing Dam‐Lamin B1 (top panel) and Dam‐only (bottom panel). Negative cells are presumably non‐transduced cells. The scale bar corresponds to 2 μm.
We then applied the pA‐DamID protocol (Fig 1A) to human HAP‐1 cells using antibodies against Lamin B1, Lamin B2, and the histone modifications H3K27me3 and H3K9me3. Visualization with purified m6A‐Tracer (Fig 1B) and subsequent quantitative image analysis (Fig 1C) showed that pA‐DamID with both lamins yielded a clear rim staining. In contrast, the m6A signals obtained with antibodies against H3K27me3 and H3K9me3 were found throughout the nucleus with only a modest enrichment at the periphery for H3K9me3. A no‐antibody control yielded virtually no staining, and permeabilized cells incubated with free Dam in the presence of SAM showed a homogenous nuclear staining except for the weakly labeled nucleoli (Fig 1B and C). These data indicate that application of the pA‐DamID protocol results in adenine methylation of DNA at the expected nuclear locations.
When Dam‐Lamin B1 is expressed in vivo for 5–25 h during interphase, LADs that interact with the NL become progressively labeled, eventually resulting in a layer of labeled chromatin of up to ~1 μm thick (Kind et al, 2013). This is because LADs are in dynamic contact with the NL. We expected that in pA‐DamID this layer would be thinner, because the NL‐tethered Dam is only activated for 30 min. In addition, permeabilization depletes small molecules including ATP and thus prevents active DNA remodeling in the nucleus (Adam et al, 1990). Indeed, pA‐DamID yields a m6A layer that is ~2.5‐fold thinner than the layer in cells that express Dam‐Lamin B1 in vivo (Fig 1D–F). This is not an artifact due to collapse of chromatin onto the NL caused by the permeabilization, because permeabilization of cells expressing Dam‐Lamin B1 in vivo did not significantly reduce the thickness of the m6A layer compared with directly fixed cells (Fig 1F). The thin layer of labeled DNA obtained by pA‐DamID points to an improved temporal resolution of pA‐DamID compared with conventional DamID.
Genome‐wide pA‐DamID maps are reproducible and specific
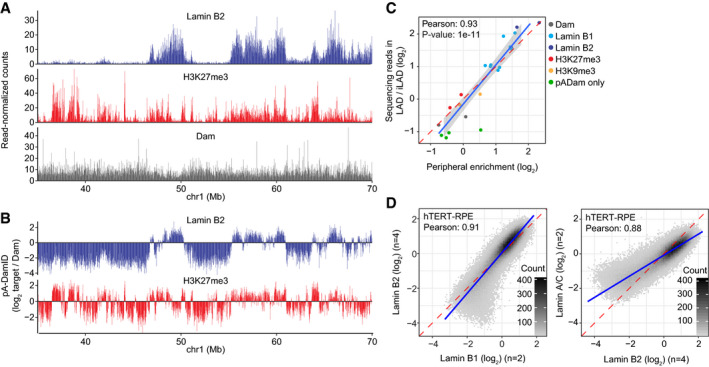
Encouraged by these results, we proceeded to generate genome‐wide pA‐DamID maps, using a Lamin B2 antibody in HAP‐1 cells (Fig 2A, top panel). Amplification of m6A‐marked DNA fragments from genomic DNA was dependent on both the antibody and SAM (Appendix Fig S1A), indicating that the mapping procedure is specific. Additionally, amplification was dependent on the m6A‐specific restriction enzyme DpnI, which ruled out the formation of apoptotic fragments in pA‐DamID that could affect the data quality (Appendix Fig S1A). For comparison, we also generated pA‐DamID maps with an antibody against H3K27me3 (Fig 2A, middle panel). Consistent with previous DamID studies (Guelen et al, 2008; Harr et al, 2015), Lamin B2 yielded a clear pattern of domains (LADs) that only partially overlaps with the H3K27me3 domains. Furthermore, incubation with freely diffusing Dam (instead of pA‐Dam tethered by an antibody) resulted in a more homogeneous pattern that presumably reflects chromatin accessibility (Fig 2A, bottom panel).
Figure 2. pA‐DamID can map NL interactions and correlates with microscopy observations.
-
AExample of raw pA‐DamID data tracks from 2 million HAP‐1 cells for Lamin B2, H3K27me3, and the Dam control from a single experiment. Sequenced reads are counted in 20 kb bins and normalized for library size.
-
BSame pA‐DamID tracks of Lamin B2 and H3K27me3 as in (A) but after normalization to the Dam‐only control (to correct for accessibility and amplification biases) and log2 transformation.
-
CCorrelation between the median peripheral enrichment of m6A‐Tracer determined by confocal microscopy and enrichment of sequencing reads within LADs in HAP‐1 cells. The LAD definition is based on conventional Lamin B1 DamID data. Every point represents a single pA‐DamID experiment for which both microscopy and sequencing data were generated, colored by the antibody used. The blue line represents a linear model with a standard error confidence interval in gray. The red dashed line represents the diagonal. The Pearson correlation coefficient was converted to a t‐statistic and a one‐sided t‐test with n‐2 degrees of freedom was used to determine statistical significance.
-
DComparisons of pA‐DamID genome‐wide data (bin size 20 kb) for different lamin antibodies in hTERT‐RPE cells: Lamin B1 vs. Lamin B2 (left panel) and Lamin B2 vs. Lamin A/C (right panel). n denotes the number of independent biological experiments that were averaged for each data track. The blue line represents a linear model. The red dashed line represents the diagonal.
In conventional DamID, m6A maps obtained with a Dam‐fusion protein are typically normalized to a Dam‐only control. This is done to correct for local variation in chromatin accessibility and for possible biases in PCR amplification or sequencing (Greil et al, 2006). We applied a similar normalization in pA‐DamID, using the data obtained with freely diffusing Dam as reference (Fig 2B). Reproducibility between biological replicates was high (Appendix Fig S1B). pA‐DamID data tracks of histone modifications show a high resemblance to ENCODE ChIP‐seq data (Consortium, 2012) (Appendix Fig S1C). Noteworthy, the visualized peripheral enrichment of m6A‐Tracer signals correlates strongly with the enrichment of sequencing reads in LADs according to genome‐wide DamID maps (Pearson correlation: 0.93; Fig 2C). Thus, the pA‐DamID maps are generally consistent with the microscopy data.
Conventional DamID has indicated that Lamin B1, Lamin B2, and Lamin A/C all interact with the same LADs (Meuleman et al, 2013; Kind & van Steensel, 2014). Consistent with these results, we did not observe any major differences between maps generated by pA‐DamID with antibodies against these three lamins, although Lamin A/C yielded data with a smaller dynamic range (Fig 2D). Together, these results show that pA‐DamID can be used to map NL associations effectively.
pA‐DamID and DamID maps are highly similar but not identical
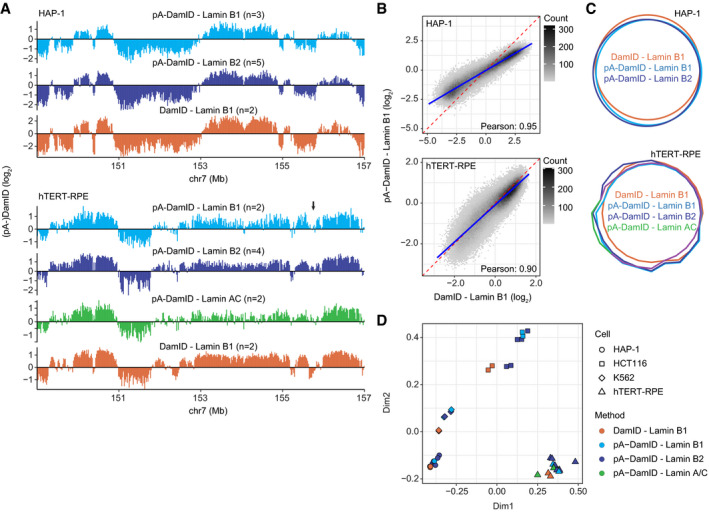
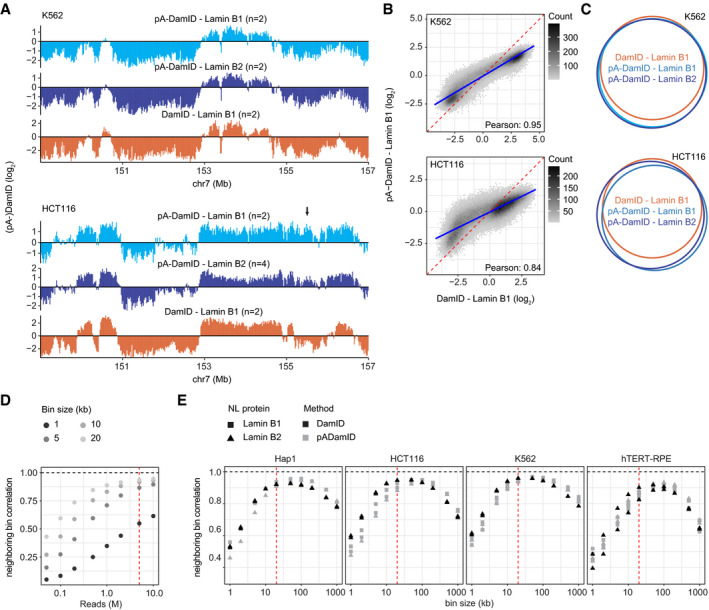
Next, we systematically compared Lamin B1 DamID and pA‐DamID in four different human cell types: HAP‐1, HTC116, hTERT‐RPE, and K562. In pA‐DamID, we expect “snapshots” of NL interactions, while DamID is an integration of signal over time and thus potentially more sensitive to transient NL interactions. Overall, DamID and pA‐DamID patterns are highly similar (Fig 3 all panels, Fig EV2A–C), although DamID data tended to have a larger dynamic range. In some cell types, especially in HCT116 and hTERT‐RPE cells, we noted local discrepancies between the two methods (Figs 3A and EV2A, bottom panels). These differences involve mostly regions with low signals in DamID that have higher signals in pA‐DamID. However, such differences are not obvious in HAP‐1 and K562 cells.
Figure 3. Comparison of NL interactions determined by pA‐DamID and DamID.
-
AComparison of pA‐DamID and DamID data for various lamins across a representative genomic locus in HAP‐1 and hTERT‐RPE cells. Arrow indicates a region with dissimilar pA‐DamID and DamID scores.
-
BGenome‐wide correlation of Lamin B1 pA‐DamID and Lamin B1 DamID data. The blue line represents a linear model. The red dashed line represents the diagonal.
-
CVenn Diagram showing the overlap in LADs defined by a Hidden Markov Model. Results in (A–C) are based on averaged data from n independent experiments (see panel A), bin size 20 kb.
-
DMultidimensional scaling (MDS) plot (Robinson et al, 2010) showing all individual replicates of DamID and pA‐DamID experiments for various lamins and cell types.
Figure EV2. Comparison of NL interactions determined by pA‐DamID and DamID for K562 and hTERT‐RPE cells.
-
A–CPlots similar to Fig 3A–C, but for K562 and HCT116 cells. Data are averages of n biological replicates (see panel A). Arrow indicates a region with dissimilar pA‐DamID and DamID scores (panel A). The blue line represents a linear model, and the red dashed line represents the diagonal (panel B).
-
DPearson correlation coefficients between neighboring bins on chromosome 1 for different bin sizes, calculated for increasing numbers of sequence reads that end in GATC. The red line highlights 5 million Lamin B2 and 5 million Dam counts, which is used in panel (E). Data are from Replicate 1 of Lamin B2 pA‐DamID in K562 cells.
-
ECorrelation between neighboring bins on chromosome 1 for pA‐DamID data downsampled to 5 million Lamin B2 and 5 million Dam sequence reads, calculated for various bin sizes. All pA‐DamID and DamID experiments for Lamin B1 and Lamin B2 are included that had sufficient read counts. The red line highlights the 20 kb bin size, which is used throughout this report.
We considered that the discrepancies could be explained by differences in nuclear roundness in the two assays. In DamID, adherent cells remain attached to the culture dish, while in pA‐DamID we normally harvest the cells by trypsinization before applying the protocol. Indeed, nuclei of hTERT‐RPE cells are flat in adherent cells and become less flat in trypsinized cells (Appendix Fig S2A and B). Nevertheless, pA‐DamID maps generated in cells that remained adherent (by leaving out the trypsinization step and performing the incubations in the culture dish) showed high correlation with those obtained after trypsinization (Appendix Fig S2C and D). Thus, the change in nuclear shape does not affect NL interactions.
We also compared general data quality and resolution of DamID and pA‐DamID data. For this, we used the correlation between neighboring bins along the genome. Genome–NL interactions occur in large domains where neighboring bins have mostly similar values and thus are expected to be strongly correlated. To compare DamID and pA‐DamID, we first downsampled reads from both methods to 5 million lamin and 5 million Dam‐only counts for a fair comparison, because larger read numbers result in better data quality (Fig EV2D). We found that DamID and pA‐DamID datasets yield similar correlations between neighboring bins for a broad range of bin sizes (Fig EV2E), indicating that the data quality and resolution are similar.
We emphasize that the differences between the DamID and pA‐DamID maps are subtle compared with the differences between cell types, as is illustrated by dimensionality reduction analysis, which consistently clusters the datasets by cell type and not by method (Fig 3D). As will be discussed below, the minor discrepancies between the two methods may arise from a difference in m6A deposition during the cell cycle.
NL interactions initiate throughout the genome in early G1
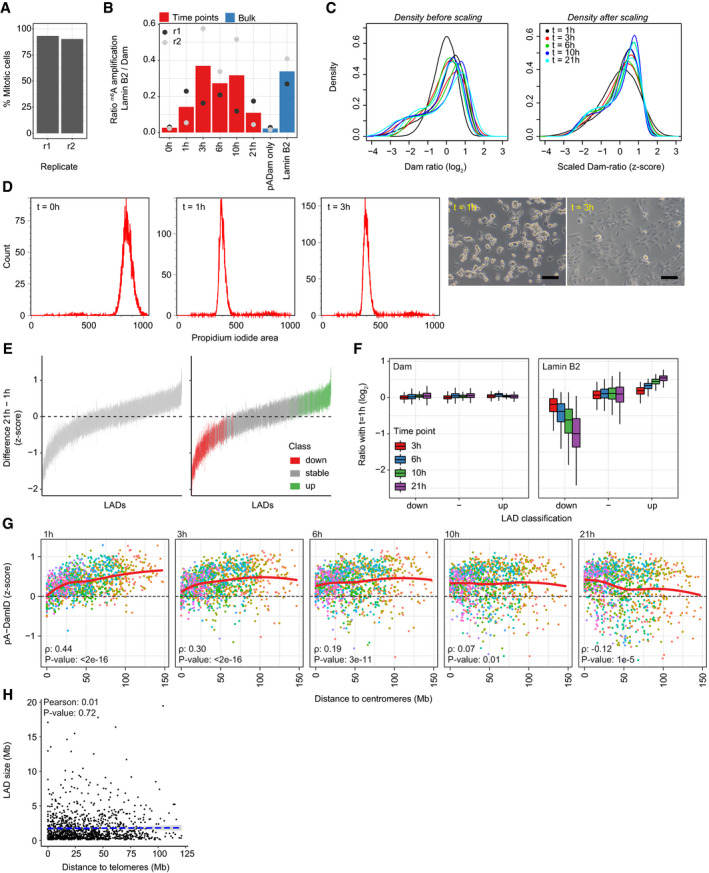
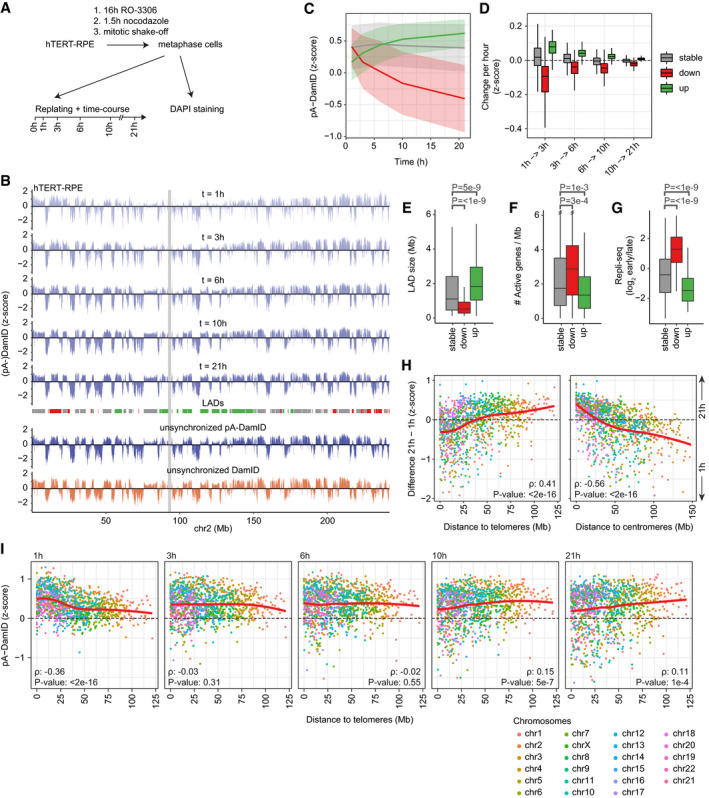
We then took advantage of the better time resolution of pA‐DamID to study genome–NL interactions during the cell cycle. Initially, we explored how these interactions are established genome‐wide after mitosis. To do so, we synchronized hTERT‐RPE cells in prometaphase by sequential treatment with inhibitors of CDK1 (RO‐3306) and microtubule polymerization (nocodazole), followed by mitotic shake‐off. Counting of mitotic cells indicated that 90% and 93% of the cells were synchronized for the two replicates (Fig EV3A). We re‐seeded these cells and mapped NL interactions by pA‐DamID at various time points from 0 to 21 h (Fig 4A). These time points are within one average cell cycle, which we estimated to take ~26 h (see Materials and Methods). At all time points except at 0 h (i.e., when cells are in metaphase), m6A‐labeled DNA could be readily amplified (Fig EV3B). The lack of labeling in metaphase cells is consistent with lamins being depolymerized and excluded from the chromosomes at this stage (Gerace et al, 1978; Moir et al, 2000a). No genome‐wide pA‐DamID map could thus be obtained from this time point. The other time points yielded high‐quality maps (Fig 4B), although we observed modest differences in dynamic range of pA‐DamID log‐ratios (Fig EV3C, left panel). Because such differences were also present between biological replicates, they are likely due to technical variation. To correct for this, we converted the log‐ratios to z‐scores (Fig EV3C, right panel).
Figure EV3. Analysis of NL interactions at various times after mitosis.
-
ASynchronized cells were fixed on poly‐L-lysine‐coated cover slips and stained with DAPI. Percentage of mitotic cells was estimated by visual scoring of metaphase and anaphase appearance in confocal microscopy images. 207 and 82 cells were assessed in the two replicates (r1, r2), respectively.
-
BRatio of gel intensities from amplified m6A fragments between Lamin B2 pA‐DamID and Dam control, normalized for input DNA. For the second replicate, input DNA was very low for the time points and could not be determined accurately. These samples thus show a large variation in amplification ratio compared with the first replicate. The 0 h time point consistently shows low amplification ratios, similar to unsynchronized samples without a primary antibody. This indicates that genome–NL interactions at this time point are very weak.
-
CData distribution before and after scaling to z‐scores. The distributions are not affected by this transformation. Every line represents a single replicate.
-
DDensity plots of propidium iodide (PI) signals of hTERT‐RPE cells following mitotic shake‐off and replating (left). Example light microscopy of hTERT‐RPE cells following replating (right). The scale bar corresponds to 100 μm.
-
EOverview of the classification of dynamic LADs. LADs were defined for every time point by selecting LADs that are called in both replicates using hidden Markov modeling, after which a union across time points was used as consensus LAD definition. For every LAD, per‐bin z‐score differences are calculated between 1 h and 21 h, and a line is drawn between the 25th and 75th percentiles of these values. This shows that numerous LADs change as complete units between 1 h and 21 h. The right panel shows the same figure, but is colored by LAD classification into stable and dynamic using limma‐voom differential analysis (Materials and Methods).
-
FRead counts for Dam and Lamin B2 (normalized for overall sequencing read depth) were calculated for stable and dynamic LADs. Plotted are log2‐ratios relative to the 1 h time point. This shows that Dam reads do not change between time points. Average two of biological replicates. Boxplots: horizontal lines represent 25th, 50th, and 75th percentiles; whiskers extend to the smallest values no further than 1.5 times distance between 25th and 75th percentiles.
-
GSimilar figure as Fig 4I, showing distance to centromeres instead.
-
HLAD size is not correlated with distance to telomeres (Pearson correlation coefficient: 0.01). The blue dashed line represents a linear model.
Figure 4. Mapping of NL interactions at various times after mitosis.
-
AStrategy for synchronization of hTERT‐RPE cells. Cells were first enriched in G2 phase by 16 h incubation with 2.0 μg/ml RO‐3306, washed, and incubated for another 1.5 h with 25 ng/ml nocodazole to arrest cells in metaphase. Metaphase cells were then collected by mitotic shake‐off. A small fraction was used to determine the proportion of mitotic cells by DAPI staining and confocal microscopy (Fig EV3A), while the remainder was replated for pA‐DamID time series analysis.
-
BNL interactions in hTERT‐RPE cells at indicated times after mitosis for chromosome 2, as determined by Lamin B2 pA‐DamID. Log2‐ratios were converted to z‐scores to account for differences in dynamic range between replicates (Fig EV3C). Average of two independent biological replicates. LADs are colored by their differential class (down:red, stable:gray, up:green, see panel C). The centromere is shown as gray box. These genome‐wide data are also used for the analyses in (C–I).
-
CpA‐DamID signal as a function of time after mitosis, for stable (gray, n = 717) and dynamic LADs (red and green: decreasing (n = 234) and increasing (n = 225) NL interactions, respectively). Lines represent mean signals of the three LAD classes and the shaded area one standard deviation on both sides.
-
DRate of changes in NL interactions (average pA‐DamID z‐score per hour) as function of time after mitosis for stable and dynamics LADs (see panel C). Boxplots: horizontal lines represent 25th, 50th, and 75th percentiles; whiskers extend to the smallest values no further than 1.5 times distance between 25th and 75th percentiles.
-
E–GLAD size distribution in basepairs (E), density of active genes (F) and Repli‐seq score distributions (G) for stable and dynamic LADs (see panel C). Statistical significance was determined using a two‐way Wilcoxon test with Benjamini–Hochberg P‐value correction to account for multiple testing. Boxplot specification as in (D).
-
HDifference in pA‐DamID z‐scores between 1‐h and 21‐h time points, plotted against the distance to telomeres (leftpanel) or centromeres (rightpanel). Each dot represents a single LAD. Chromosomes are colored and ordered by size. Red line is a fitted loess curve. The Spearman correlation coefficient (ρ) was used to test for a significant monotonic, non‐linear association.
-
ISimilar as (H), but showing pA‐DamID z‐scores for individual time points.
Interestingly, the mapping data show less defined bimodal distributions for early time points compared with later time points (Fig EV3C), suggesting that genome–NL interactions become progressively more defined after mitosis. Nevertheless, already at 1 h we observe widespread domain patterns of NL interactions (Fig 4B). At this moment, cells have just divided after the mitotic synchronization (Fig EV3D); thus, this time point captures the initial interactions with the reforming NL. Remarkably, the majority of NL associations are shared with later time points, indicating that most LADs can interact with the NL throughout interphase and are defined very soon after mitosis.
Dynamic NL interactions correlate with chromosome location
Even though globally the pattern of interactions is similar throughout interphase, visual inspection suggested that some interactions become stronger over time, while others become weaker (Fig 4B). To analyze this systematically, we defined a union set of 1176 LADs by a hidden Markov model per time point and classified them either as static, increasing over time, or decreasing over time (Fig EV3E, Materials and Methods). Most LADs are stable, but 234 and 225 LADs show decreasing or increasing interactions over time, respectively (Fig 4C). Changes occur mostly within the first few hours, although movements continue throughout interphase (Fig 4D). Importantly, these dynamics are not related to variation in chromatin accessibility, because they are generally not accompanied by changes in Dam reads over time (Fig EV3F).
We next looked into characteristics of the dynamic LADs. At early time points, LADs with decreasing interactions do not have lower pA‐DamID scores than stable LADs, suggesting that their dissociation from the NL is not simply due to weak initial interaction (Fig 4C). However, decreasing LADs are generally smaller than stable and increasing LADs (Fig 4E), which could make their interactions with the NL less persistent. In addition, decreasing LADs have a slightly higher density of active genes and replicate substantially earlier than stable or increasing LADs (Fig 4F and G). Thus, decreasing LADs tend to carry euchromatin features that are untypical of LADs, which may explain why they detach from the NL within a few hours after mitosis.
Strikingly, we found that dynamic LADs have markedly skewed distributions along the chromosomes. Decreasing LADs are primarily located in distal regions of most chromosomes (typically within ~25 Mb from the telomeres), and increasing LADs tend to be in centromere‐proximal parts (Figs 4H and EV3D). Early after mitosis, distal LADs tend to have stronger interactions with the NL than proximal LADs (Figs 4I and EV3G). Over time this skew is inverted, with centromere‐proximal LADs gradually gaining interactions and distal LADs showing weaker interactions. This dependency on chromosomal location is not linked to LAD size, because these features are not correlated (Fig EV3H; Pearson correlation: 0.01). These data indicate that chromosomes are gradually reoriented during interphase, with proximal LADs progressively taking over some of the NL interactions from distal LADs.
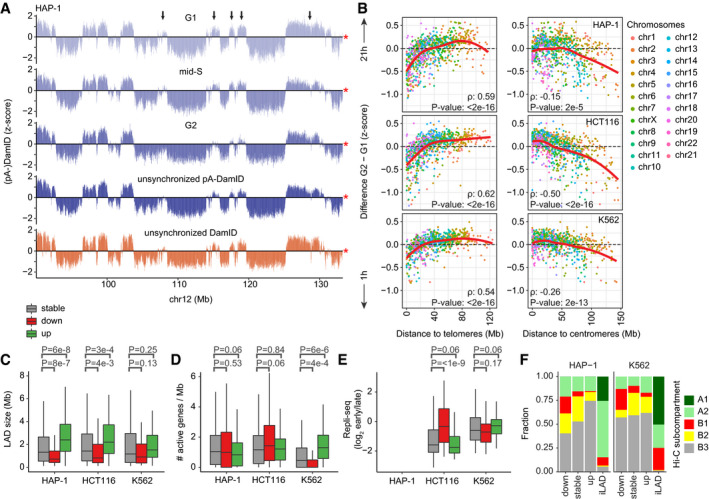
LAD dynamics are linked to telomere distance and LAD size in multiple cell types
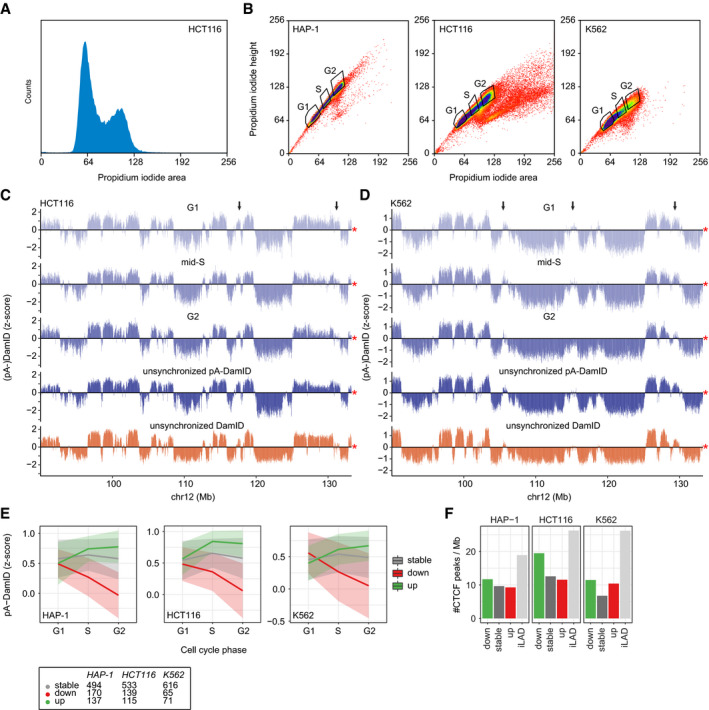
We considered that the observed dynamics may be artefacts of the drug treatments that we applied to obtain synchronized cells. In addition, the observations might be specific for hTERT‐RPE cells. To address these points, we performed pA‐DamID on unsynchronized populations of HAP‐1, K562, and HCT116 cells, and then sorted cells based on DNA content to obtain G1, mid‐S, and G2 pools (Fig EV4A and B). Overall, the resulting maps are very similar between cell cycle stages but not identical (Figs 5A and EV4C and D).
Figure EV4. LAD dynamics in flow sorted HCT116 and K562 cells.
-
ADensity plot of propidium iodide (PI) signals of HCT116 cells after application of the pA‐DamID protocol and PI staining.
-
BSorting strategy of pA‐DamID processed cells stained PI. Single cells were selected based on PI height and area and sorted into three pools: G1, mid‐S, and G2. G1 and G2 gates were set around the two PI peaks (see also A). The mid‐S gate was set to covering intermediate PI signals, clearly distinct from the G1 and G2 peaks. For every condition, 2 or 3 wells were filled with 1,000 cells and processed to generate one sequencing library.
-
C, DSame locus as Fig 5A for HCT116 (C) (n = 2) and K562 cells (D) (n = 2). The arrows highlight dynamic regions. The red asterisk indicates the end of the chromosome.
-
ESimilar plot as Fig 4C, with cell cycle stages on the x‐axis. The numbers of stable and dynamic LADs are shown for the three cell types.
-
FCTCF ChIP‐seq peak density per Mb for stable and dynamic LADs. iLADs are defined as genomic regions not overlapping with stable or dynamic LADs. CTCF data are from (Consortium EP, 2012; Haarhuis et al, 2017). A permutation test with 1,000 permutations (R‐package regioneR (Gel et al, 2016)) was used to test for a significant enrichment of CTCF peaks in decreasing LADs, resulting in P‐values of 1e‐3, 1e‐3, and 1e‐3 for HCT116, HAP‐1, and K562, respectively.
Figure 5. LAD dynamics in other cell types.
-
ALamin B2 pA‐DamID z‐scores of a representative locus in HAP‐1 cells sorted for G1, mid‐S, and G2 phases. Arrows point to regions that lose NL interaction from G1 to G2. The red star indicates the end of the chromosome. Average of three biological replicates.
-
BSimilar plot as Fig 4H, showing the difference in pA‐DamID z‐scores between G2 and G1 sorted pools as function of distance to either telomere or centromere for HAP‐1 (n = 3), HCT116 (n = 2), and K562 cells (n = 2).
-
C–ELAD size distribution in basepairs (C), density of active genes (D) and Repli‐seq scores (E) for stable and dynamic LADs. Repli‐seq data are not available for HAP‐1 cells. Statistical significance was determined using a two‐way Wilcoxon test with Benjamini–Hochberg P‐value correction to account for multiple testing. Boxplots: horizontal lines represent 25th, 50th, and 75th percentiles; whiskers extend to the smallest values no further than 1.5 times distance between 25th and 75th percentiles.
-
FOverlapping fractions of stable and dynamic LADs and iLADs with Hi‐C subcompartments in HAP‐1 and K562 cells, as imputed by SNIPER (Xiong & Ma, 2019). A permutation test with 1,000 permutations (R‐package regioneR; Gel et al, 2016) was used to test for a significant enrichment of B1 subcompartments in decreasing LADs, resulting in P‐values of 1e‐3 and 1e‐3 for HAP‐1 and K562, respectively.
We separated LADs into three classes of stable, increasing, or decreasing NL interactions over time by comparing the pA‐DamID signals in G1 and G2 phases (Fig EV4E). Similar to what we observed in synchronized hTERT‐RPE cells, decreasing interactions involved predominantly distal LADs (Fig 5B, left panel). We also find that small LAD size is a consistent characteristic of decreasing interactions, although this is less pronounced in K562 cells (Fig 5C). In contrast, increasing interactions for centromere‐proximal LADs and enriched euchromatin features in decreasing LADs are only apparent for HCT116 cells (Fig 5B, right panel, Fig 5D and E). We conclude that the links between dynamic NL interactions and the chromosomal positions and sizes of LADs are not specific to synchronized hTERT‐RPE cells, but apply more generally to cultured cells of various origins.
Furthermore, we compared dynamic LAD–NL interactions with other aspects of genome organization. Binding sites for CTCF (Consortium EP, 2012; Haarhuis et al, 2017), a key regulator of chromosome architecture (Merkenschlager & Nora, 2016), are enriched in decreasing LADs in HCT116 cells, but only marginally for HAP‐1 and K562 cells (Fig EV4F). Next, we compared LAD dynamics with the major nuclear compartments as detected by Hi‐C. LADs generally overlap with the B compartment (van Steensel & Belmont, 2017), particularly with subcompartments B2 and B3 and less with B1 (Rao et al, 2014). We find that both stable and dynamic LADs are strongly enriched in the B2 and B3 subcompartments (Fig 5F). LADs overlapping the B1 subcomparment are mostly losing NL interaction. Combined, this suggests that the B1 subcompartment lacks certain characteristics to maintain NL interactions during the cell cycle.
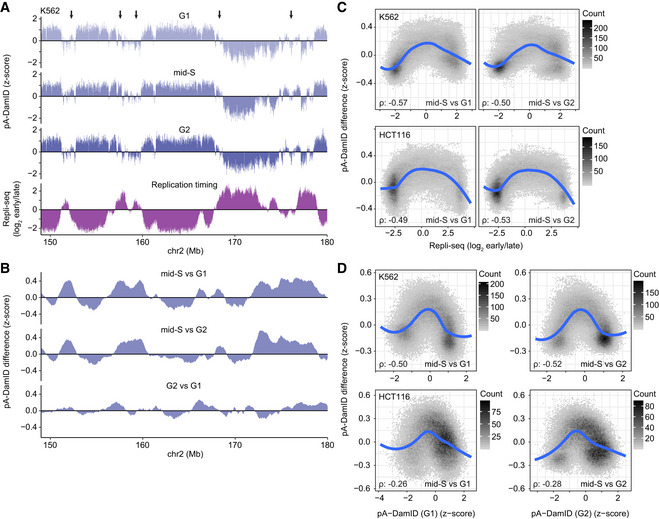
S‐phase chromatin shows increased lamin interactions
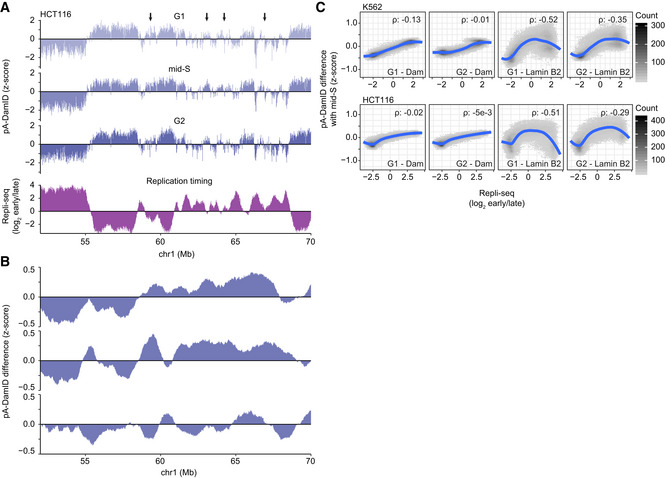
Next, we inspected the pA‐DamID profiles obtained in mid‐S phase in more detail. We frequently observed that LAD border regions or weak LADs have transiently increased pA‐DamID scores in mid‐S compared with G1 and G2 (Figs 6A and B, and EV5A and B). These regions often coincide with areas that replicate in mid‐S phase (Fig 6A). To test this genome‐wide, we calculated the changes in pA‐DamID scores between mid‐S and either G1 or G2, and plotted this against replication timing (Dekker et al, 2017; Marchal et al, 2018; Fig 6C). Indeed, regions that replicate in mid‐S phase show on average a small but consistent increase in NL interactions in mid‐S cells compared with G1 and G2 cells. The increase in pA‐DamID signal is not caused by a change in accessibility, as Dam reads remain constant except for duplication of early replicating DNA (Fig EV5C).
Figure 6. Mid‐S chromatin has transiently increased Lamin B2 interactions.
-
ARepresentative K562 locus comparing Lamin B2 pA‐DamID z‐scores in cell cycle sorted cells with replication timing. Arrows point to regions with increased mid‐S signal compared with G1 and G2, which tend to overlap with regions that exhibit intermediate replication timing. Average of two biological replicates.
-
BDifference tracks in pA‐DamID z‐scores between the cell cycle stages for the same locus as (A). Data were smoothed by a running mean of 5 bins (bin size 20 kb).
-
CScatter plots of Repli‐seq vs. the difference in smoothed pA‐DamID z‐scores between mid‐S sorted cells and either G1 or G2 sorted cells for K562 and HCT116 cells (two replicates). Bins with pA‐DamID differences between G1 and G2 bigger than 0.2 were filtered out to prevent artifacts from cell cycle dynamics. Blue line shows a fitted loess curve. The Spearman correlation coefficient (ρ) between the absolute Repli‐seq signal and pA‐DamID difference was used as a measure of the enriched signal at mid‐S replicating DNA (with a Repli‐seq score around zero).
-
DScatterplots of changes in pA‐DamID signal versus the pA‐DamID signal in G1 (left‐hand panels) or G2 cells (right‐hand panels), represented in a similar way as (C). Repli‐seq data are from the 4D Nucleome data repository (https://data.4dnucleome.org; Dekker et al, 2017).
Figure EV5. Transiently increased Lamin B2 interactions during mid‐S are not due to increased Dam reads.
-
A, BSimilar figures as Fig 6A and B for a locus in HCT116 cells. Arrows highlight regions with increased mid‐S signal compared with G1 and G2. Average of two biological replicates.
-
CSimilar plot as Fig 6C, showing the difference in read‐normalized counts for Dam and Lamin B2 samples. This plot shows a gradual increase in S‐phase enrichment for Dam reads, reflecting DNA duplication of early replicating DNA. In contrast, Lamin B2 reads show an increase in S‐phase enrichment for Repli‐seq scores around 0, reflecting mid‐S chromatin. The Lamin B2 Spearman correlation coefficients are significantly higher than for Dam (P < 2e‐16 for both G1 and G2, William's t‐test using R‐package cocor; Diedenhofen & Musch, 2015). Repli‐seq data are from the 4D Nucleome data repository (https://data.4dnucleome.org) (Dekker et al, 2017).
We investigated whether the LADs with increased lamin interactions in S‐phase were already partially associated with the NL in G1 phase. Indeed, the strongest increases in NL contacts during S‐phase involve regions with intermediate pA‐DamID signals in G1 (Fig 6D, left‐hand panels). In G2 phase, these regions revert again to intermediate pA‐DamID signals (Fig 6D, right‐hand panels). These results indicate that S‐phase chromatin, at least during mid‐S phase, exhibits temporarily increased contacts with lamin B2, suggesting a transient strengthening of NL interactions.
Minor differences between pA‐DamID and DamID are linked to cell cycle bias
Finally, we revisited the minor differences between pA‐DamID and DamID data in unsynchronized cells (Fig 3). We asked whether DamID data might be somewhat skewed due to an unequal representation of specific stages of the cell cycle. For example, DNA replication converts DNA that was fully Dam‐methylated in G1 into hemi‐methylated DNA. The latter shows impaired cutting by DpnI, the restriction enzyme that is used to identify m6A‐methylated DNA in the DamID protocol (Hermann & Jeltsch, 2003). Thus, NL interactions that occur in G1 phase may be somewhat under‐detected by DamID in unsynchronized cells. To test this, we compared conventional DamID data with the pA‐DamID data from each cell cycle phase. This indicated that the DamID data are most similar to G2 phase pA‐DamID, especially for the HCT116 cells that showed the biggest differences (Appendix Fig S3). This result suggests that the minor differences between pA‐DamID and DamID in unsynchronized cells are mostly related to somewhat different representations of cells across the cell cycle.
Discussion
In the past decade, DamID has been used to identify and characterize LADs (Pickersgill et al, 2006; Guelen et al, 2008; van Steensel & Belmont, 2017; Lochs et al, 2019). However, conventional DamID lacks the temporal resolution needed to study dynamics of LAD–NL interactions that occur within time spans of about one hour. Here, we present pA‐DamID, a method to take “snapshots” of NL contacts. We applied pA‐DamID to reveal the dynamics of LAD–NL contacts during initial interphase and during DNA replication.
Cell cycle dynamics of genome–NL interactions
Our data indicate that most changes in NL contacts occur in the first hours after mitosis, consistent with the higher mobility of chromatin at this stage, as observed by microscopy (Thomson et al, 2004). Initial NL contacts are widespread throughout the genome and quickly mature in a more bimodal distribution. This is in agreement with single‐cell Hi‐C analysis in mouse embryonic stem cells, which showed that the B compartment (largely overlapping with LADs; van Steensel & Belmont, 2017) gradually moves toward a more radial positioning in early G1 (Nagano et al, 2017). Similarly, Hi‐C in synchronized cells showed that chromatin compartments appear in telophase and gradually gain in strength (Abramo et al, 2019; Zhang et al, 2019). Noteworthy, the self‐aggregation of LADs occurs before NL positioning (preprint: Luperchio et al, 2018), suggesting that the formation of the B compartment and NL positioning are correlated but still separate processes.
Earlier work indicated that telomeres are enriched near the nuclear periphery during postmitotic nuclear assembly (Dechat et al, 2004; Crabbe et al, 2012). A modified version of DamID could also detect telomere‐NL associations in non‐synchronized cells (Sobecki et al, 2018). Our results show that this enrichment is not limited to the telomeres, but rather involves distal chromosome regions up to ~25 Mb from the telomeres, typically including multiple LADs. Interestingly, LAP2α, which can interact with Lamin A/C, has been found to localize on the distal regions of mitotic chromosomes, i.e., prior to NL assembly. Later, LAP2α migrates toward the nuclear interior (Dechat et al, 2004). Possibly, LAP2α marks mitotic chromosomal regions that are destined to become the early NL assembly sites in telophase. However, it is also possible that distal chromosome regions are more probable sites for early NL interactions because they are more likely to be at the surface of the telophase chromatin mass, as a consequence of the pulling motion on centromeres earlier in mitosis (Dechat et al, 2004). Because most LADs begin to interact with the NL soon after mitosis, it is possible that LADs are generally “bookmarked” for such interactions, for example by heterochromatin marks such as H3K9me2 (Poleshko et al, 2019).
In situ labeling experiments have shown that DNA replication occurs in a specific spatial sequence inside the nucleus, initiating in interior foci before moving toward the NL and nucleolus and ending in large nuclear foci corresponding to pericentric heterochromatin (O'Keefe et al, 1992; Rhind & Gilbert, 2013). According to these studies, juxtaposition of replicating DNA to the NL occurs primarily during mid‐S phase. In addition, B‐type lamins have been found to overlap with replication foci in the nuclear interior during mid‐late S phase (Moir et al, 1994). Our pA‐DamID results showing a transient increase in lamin B2 contacts with mid‐S chromatin are in agreement with both findings. The precise function of this transient association of lamins with S‐phase chromatin remains to be elucidated.
pA‐DamID as a tool for studying NL interactions
pA‐DamID is an alternative implementation of protein A‐based enzyme targeting to study protein–DNA interactions, following the principle of CUT&RUN (Skene & Henikoff, 2017) and its derivative CUT&TAG (Kaya‐Okur et al, 2019). Compared with CUT&RUN, a major advantage of pA‐DamID is that m6A‐marked DNA can be visualized microscopically (using purified m6A‐Tracer). This provides a simple visual check that m6A is deposited near the antibody used, in this case near the NL. Furthermore, in our pA‐DamID protocol the genome‐wide maps obtained with Dam tethered to a lamin antibody are normalized to maps obtained with untethered Dam. This way the data are corrected for local differences in chromatin accessibility, similar to the standard DamID protocol (Greil et al, 2006; Vogel et al, 2007). We believe that such a normalization is important to reduce mapping biases. This may be particularly relevant for LADs, which are mostly heterochromatic. This normalization is to our knowledge not commonly applied in current CUT&RUN or CUT&TAG protocols (Skene & Henikoff, 2017; Kaya‐Okur et al, 2019).
pA‐DamID is inherently limited in resolution due to its dependence on GATC sequence motifs, but in contrast to CUT&RUN the template is not destroyed (Skene & Henikoff, 2017). Processed cells can therefore be stained and sorted for specific subpopulations, as we illustrated here by flow sorting based on DNA content. Possibly this is also feasible with CUT&TAG, although the applicability for the NL has not been tested to our knowledge (Kaya‐Okur et al, 2019). pA‐DamID can readily be performed with small numbers of sorted cells—in this study 3,000 cells per sample—and thus provides an alternative way to study cell type‐specific DNA interactions, without the need for transgenic animals with selective Dam expression (Southall et al, 2013; Pindyurin et al, 2016; Cheetham et al, 2018).
Similar to CUT&RUN and CUT&TAG, pA‐DamID requires permeabilization of unfixed cells. This could potentially affect protein localization and genome organization. Upon digitonin treatment, most nuclear protein is retained but small amounts can leak out (Liu & Fagotto, 2011). High concentrations of digitonin (> 500 μg/ml) result in nuclear shrinking (Dimitrova & Gilbert, 1998), but more subtle effects on genome architecture have not been ruled out at lower concentrations. However, by direct visualization of m6A‐tagged DNA we observed no effect of this permeabilization on the peripheral genome organization. Presumably, small molecules including ATP are depleted from the nucleus after permeabilization [as illustrated by the depletion of endogenous SAM in pA‐DamID and Ca++ in CUT&RUN (Skene & Henikoff, 2017) and previous observations (Adam et al, 1990)]. This may prevent active remodeling of the nuclear organization, enabling “snapshot” genome‐wide mapping.
TSA‐seq is a recently developed alternative “snapshot” method to map genome positioning relative to nuclear compartments (Chen et al, 2018b). TSA‐seq relies on diffusion of free radicals and thus measures distances rather than contacts. However, the current implementation of TSA‐seq requires > 100 million cells, making it less suitable for studies of cell cycle dynamics or other applications with small numbers of cells.
Compared with conventional DamID, pA‐DamID yields data of approximately similar quality as DamID, although it has a slightly reduced dynamic range and resolution. This may be due to imperfect antibody‐based localization of Dam. We also noticed a nucleosomal‐like pattern of m6A‐labeled DNA fragments after pA‐DamID (Appendix Fig S1A), which suggests an inability of Dam to methylate nucleosomal DNA in permeablized nuclei. This may reduce the number of GATC motifs available for m6A tagging. A nucleosomal pattern has not been observed in conventional DamID (Vogel et al, 2007), in which case m6A is deposited in living cells, where nucleosomes may undergo a more dynamic repositioning than in permeabilized cells. A major practical advantage of pA‐DamID is that it does not require in vivo expression of a Dam‐fusion protein. This will greatly facilitate the mapping of NL contacts in primary cells and tissues. Together with the increased time resolution, this creates new opportunities to study the role of the NL in genome organization (Adriaens et al, 2018).
Materials and Methods
Cloning
The DNA sequence encoding the proteinA‐Dam fusion protein was codon optimized for bacterial expression and ordered as gBlock (IDT). Sequences for ligation‐independent cloning (LIC) were added to the flanks and used to insert the gBlock into the pETNKI‐his‐3C‐LIC‐kan vector (Luna‐Vargas et al, 2011). m6A‐Tracer DNA (EGFP‐DpnI*) was PCR amplified from the original plasmid (Kind et al, 2013) with LIC sequences attached to the primers. The PCR fragment was purified and cloned by LIC into the pFastBacNKI‐his‐3C‐LIC vector (Luna‐Vargas et al, 2011). We also replaced EGFP with a HALO tag in the m6A‐Tracer plasmid with PCR amplification and cloning into the AgeI and BglII restriction sites. This plasmid was processed identical to the EGFP plasmid to create an expression vector and to obtain purified protein.
Expression and purification of his‐pA‐Dam
The his‐pA‐Dam fusion protein was expressed in Rosetta2(DE3) cells in LB medium supplemented with 30 μg/ml kanamycin and 40 μg/ml chloramphenicol. Cells were grown at 37°C to OD600 = 0.6–0.8. Cells were cooled to 20°C before 0.4 mM Isopropyl β‐d‐1‐thiogalactopyranoside (IPTG) was added and protein was expressed overnight. Cells were harvested by centrifugation (1 min 3,000 g) and resuspended in lysis buffer (25 mM Tris pH 8.0, 200 mM NaCl, 1 mM Tris(2‐carboxyethyl)phosphine (TCEP)). Cells were lysed by sonication and the lysate was clarified by centrifugation (30 min 50,000 g at 4°C). The soluble fraction was loaded on 1 ml Nickel beads (GE Healthcare—17526801). Beads were washed with lysis buffer containing 20 mM imidazole before protein was eluted by 250 mM imidazole in lysis buffer. Fractions were analyzed by SDS–PAGE, pooled, and concentrated. Protein was diluted fourfold with 25 mM Tris pH 8.0 and purified by anion‐exchange chromatography using a Resource Q column (GE Healthcare—17117701), equilibrated in 25 mM Tris pH 8.0, 1 mM TCEP. Protein was eluted by a NaCl gradient (20–500 mM) in the same buffer. Fractions were concentrated and glycerol was added to a final concentration of 50%. His‐pA‐Dam protein was stored at −20°C. About 0.1 mg of pA‐Dam could be purified from 1 l of Rosetta2(DE3) culture.
Expression and purification of his‐m6A‐Tracer
The pFastBacNKI‐his‐3C‐m6A‐Tracer construct was used for creation of baculovirus according to the Bac‐to‐Bac system (Thermo Fisher Scientific). Briefly, plasmid DNA was transformed into E. coli EMBACY cells (Trowitzsch et al, 2010) and positive clones were selected by blue/white screening. Bacmid DNA was isolated and used for transfection of sf9 insect cells. 10 μg of DNA was incubated with 5 μl of Cellfectin reagent (Thermo Fisher Scientific) and added to sf9 cells grown in Insect‐Express medium (Lonza) in 6‐well plates (Corning). After 3 days, medium containing the virus (P0 virus) was harvested and added to 50 ml of sf9 suspension culture. After 3 days of infection, medium containing P1 virus was harvested and after addition of 0.5% FCS, P1 virus was stored in the dark at 4°C. 500 ml of sf9 cells (density 1 million cells/ml) were infected with 500 μl P1 virus and his‐m6A‐Tracer was expressed for 3 days. Cells were harvested by centrifugation (15 min, 1,000 g) and resuspended in lysis buffer (25 mM Tris pH 8.0, 100 mM NaCl, 0.5 mM TCEP). After sonication and centrifugation (30 min, 50,000 g), the soluble lysate was loaded onto 1 ml Nickel beads (GE healthcare). The column was washed with lysis buffer containing 15 mM imidazole and his‐m6A‐Tracer was eluted by 250 mM imidazole in lysis buffer. Fractions were pooled and diluted 1:1 with milliQ water and loaded onto a 6 ml Resource S column (GE healthcare). His‐m6A‐Tracer was eluted by a NaCl gradient (20–500 mM) in 25 mM Tris, 0.5 mM TCEP. Fractions were pooled and loaded on a SEC70 size exclusion chromatography column (Bio‐Rad), equilibrated with 25 mM Tris pH 8.0, 150 mM NaCl, and 0.5 mm TCEP. Fractions were pooled, concentrated, and flash frozen in liquid nitrogen before storing at −80°C. A working batch was supplemented with 50% glycerol and stored at −20°C. About 1.5 mg of his‐m6A‐Tracer could be purified from 1 l of sf9 insect cell culture. A HALO‐tagged m6A‐Tracer was produced using the same strategy. EGFP‐labeled m6A‐Tracer protein was used throughout this manuscript and referred to as m6A‐Tracer for brevity.
MboI protection assay
Dam activity of the purified pA‐Dam proteins was assayed as follows. Unmethylated control plasmid was produced in dam − bacteria (New England BioLabs #C2925H), and methylation status was confirmed by DpnI and DpnII digestion. A concentration range (0.125, 0.5, 2 μl) of pA‐Dam protein was incubated with 500 ng of unmethylated plasmid in 20 μl of 1× dam MethylTransferase buffer (New England BioLabs #M0222S) supplemented with 80 μM S‐adenosylmethionine (SAM) for 30 min at 37°C. As a positive control, a concentration range (0.25, 1, 4, 16 units) of Dam enzyme was used (New England BioLabs #M0222S). Next, the reaction mix was heat inactivated for 15 min at 65°C, and 10 μl was mixed with 40 μl of 1× NEBuffer 3 supplemented with 10 mM MgCl2 and 5 units of Mbo I (New England BioLabs #R0147L). This reaction was incubated for 1 h at 37°C, followed by analysis on agarose gel. For Dam activity, one unit is defined by New England Biolabs as the amount of enzyme required to protect 1 μg (dam −) Lambda DNA in 1 h at 37°C in a total reaction volume of 10 μl against cleavage by MboI restriction endonuclease.
Cell culture
HAP‐1 cells (https://4dnucleome.org/cell-lines.html) were cultured in IMDM (Gibco) supplemented with 10% fetal bovine serum (FBS) (Seradigm). K562 cells (ATCC CCL‐243), HCT116 cells (ATCC CCL‐247), and hTERT‐RPE cells (ATCC CRL‐4000) were cultured according to ATCC protocol. For HCT116, 0.05% Trypsin‐EDTA (Gibco) was used for passaging according to 4D Nucleome guidelines (https://data.4dnucleome.org/biosources/4DNSRMYUIVGD/). Cells were tested for mycoplasma every 2–3 months.
Cell cycle duration of hTERT‐RPE cells was estimated by passaging the cells and counting the number of seeded and harvested cells over a period of 24 and 48 h (Bio‐Rad, TC20).
HT1080 cells expressing inducible Dam‐Lamin B1 [new clone kindly provided by Kind et al (2013)] and wild‐type HT1080 cells were cultured in DMEM supplemented with 10% FBS and 1% penicillin and streptomycin. Dam‐Lamin B1 was stabilized for 16 h with 500 nM Shield1 (Aobious #AOB1848).
Cell synchronization
hTERT‐RPE cells were synchronized in mitosis (metaphase) using a sequence of G2 enrichment, mitotic synchronization, and shake‐off. First, cells were cultured for 16 h with 2.0 μg/ml RO‐3306 (CDK1 inhibitor) to enrich cells in G2. Cells were then washed three times with DMEM‐F12 and incubated for another 1.5 h with 25 ng/ml nocodazole (microtubule inhibitor) to synchronize in metaphase. This resulted in ~40% mitotic cells estimated by morphology. Next, mitotic shake‐off was used to obtain a nearly pure population of synchronized metaphase cells. The majority of synchronized cells was replated and used to determine NL contacts during interphase, but a fraction was used to estimate synchronization efficiency. For the latter, DigWash‐permeabilized cells (see pA‐DamID below) were put on poly‐L‐lysine‐coated coverslips (see below) and fixed for 10 min in 2% formaldehyde in phosphate‐buffered saline (PBS). After washes with PBS and H2O, coverslips were mounted with Vectashield + DAPI (Vector Laboratories, #H‐1200), dried and sealed with nail polish. The percentage of mitotic cells was determined manually by counting metaphase and anaphase appearance from confocal sections. For the replated cells, light microscopy analysis confirmed adherence of the cells to the culture dish and completion of cell division. Additionally, synchronized DigWash‐permeabilized cells were stained with 2 μg/ml propidium iodide (PI) and 50 μg/ml RNAse A. DNA content was measured using flow cytometry on an Attune NxT (Invitrogen, Thermo Fisher Scientific).
Lamin B1 DamID
DamID‐seq and data processing were performed as reported previously (Leemans et al, 2019). The K562 DamID data are also from (Leemans et al, 2019). To prevent amplification of apoptotic fragments present in HAP‐1 cell culture, DNA was first dephosphorylated before DpnI digestion. To do so, up to 500 ng of gDNA was incubated in 10 μl H2O with 1× CutSmart buffer and 0.5 U rSAP (New England BioLabs #M0371L) for 1 h at 37°C, followed by heat inactivation for 10 min at 65°C. Next, 10 U DpnI (New England BioLabs #R0176L) was added and sample processing continued as described (Leemans et al, 2019).
DamID and pA‐DamID sequence reads are binned in 20 kb bins, which provides a good balance between resolution and data quality for the synchronization and cell sorting experiments. For data visualization, the mean signal of all replicates was used.
pA‐DamID
A detailed protocol of pA‐DamID is provided as Appendix Information S1. pA‐DamID is a hybrid of DamID and CUT&RUN (Skene & Henikoff, 2017). It is performed with similar buffers as CUT&RUN for consistency, although there is no need to deplete bivalent ions in pA‐DamID. One million cells were harvested by centrifugation (3 min, 500 g, this speed and duration were used in all subsequent wash steps) and washed in ice‐cold phosphate‐buffered saline (PBS). Adherent cells were trypsinized before harvesting. For haploid HAP‐1 cells, two million cells were used. Cells were washed with ice‐cold digitonin wash buffer (DigWash) (20 mM HEPES‐KOH pH 7.5, 150 mM NaCl, 0.5 mM spermidine (Sigma, #S0266‐5G), 0.02% digitonin (Millipore, #300410‐250MG), cOmplete Protease Inhibitor Cocktail EDTA‐free (Roche, #11873580001)). Permeabilized cells were resuspended in 200 μl DigWash with a primary antibody and slowly rotated for 2 h at 4°C, followed by a wash step with 0.5 ml DigWash buffer. In case of mouse or goat primary antibodies, the above steps were repeated with a secondary rabbit antibody for 1 h. Nuclei were resuspended in 200 μl DigWash with 1:100 pA‐Dam (between 20 and 60 New England BioLabs units, Fig EV1B) and rotated for 1 h at 4°C, followed by 2 washes with 0.5 ml DigWash to remove unbound pA‐Dam. Dam was activated by resuspension in 100 μl DigWash supplemented with 80 μM SAM (New England BioLabs, #B9003S) and incubated for 30 min at 37°C. The reaction was stopped by cooling the samples to 4°C and washing with 0.5 ml DigWash. Library preparation for high‐throughput sequencing is identical to conventional DamID (Vogel et al, 2007; Leemans et al, 2019), except that we left out the DpnII digestion as this digestion step prevented almost all amplification. Possibly, this is because methylation by pA‐Dam in vitro is sparser than by expression of Dam proteins in vivo, and the DpnII digestion suppresses amplification unless two neighboring GATC motifs are both methylated. Sequenced pA‐DamID reads are processed similarly as DamID reads.
We routinely included three controls: First, a negative control without any Dam enzyme. This control should be completely negative for m6A. Second, a pA‐DamID sample without a primary antibody, which would reveal potential non‐specific binding of pA‐Dam. Third and most important, a sample without antibody or pA‐Dam incubation, but with 0.5 μl Dam enzyme (New England BioLabs #M0222S) added during the activation step. This control is used to normalize pA‐DamID signals for local accessibility and amplification bias.
pA‐DamID on‐the‐plate was performed identical to regular pA‐DamID, but with cells still attached in a 6‐well plate. The volumes were increased to 400 μl for every step to fully cover the cells, and plates were slowly shaken instead of rotated.
For pA‐DamID, we generally used primary antibody dilutions similar to those used for immunofluorescence labeling. We used a 1:100 dilution for Lamin B2 (Abcam ab8983, mouse), Lamin A/C (SCBT sc‐6215, goat), H3K27me3 (CST C36B11, rabbit), and H3K9me3 (Abcam ab8898, rabbit). A 1:500 dilution was used for Lamin B1 (Abcam ab16048, rabbit). For mouse primary antibodies, a secondary rabbit anti‐mouse was used in 1:100 dilution (Abcam ab6709, rabbit). For goat antibodies, we used rabbit anti‐goat (ab6697) diluted 1:100.
Cell cycle sorted pA‐DamID
For pA‐DamID of cells in specific cell cycle phases, pA‐DamID was first performed as described above for HAP‐1, K562, and HCT116 cells, using the Lamin B2 antibody as well as a Dam‐only control as described above. Next, the cells were washed once in PBS with 2% fetal bovine serum and resuspended in the same buffer with 2 μg/ml PI. Cells were sorted by PI signal in a MoFlo Astrios cell sorter (Beckman Coulter), with gate settings as shown in Fig EV4A and B. Sorted cells were collected in a 96‐well PCR plate with each well pre‐filled with 3 μl 1.33× lysis buffer (1× lysis buffer: 10 mM Tris acetate pH 7.5, 10 mM Mg acetate, 50 mM potassium acetate, 0.67% Tween‐20, 0.67% Igepal, 0.67 mg/ml Proteinase K). For every sample and cell cycle phase, 2 or 3 wells were filled with 1,000 cells, corresponding roughly to 1 μl. This thus resulted in a 1× lysis buffer concentration. Proteinase K digestion was performed for 4 h of 53°C and was heat inactivated for 10 min at 80°C. Further processing was done according to a previously reported single‐cell DamID protocol (Kind et al, 2015), using 22 cycles of PCR amplification.
m6A‐Tracer visualization of pA‐DamID cells
Nuclear staining with m6A‐Tracer was performed before fixation to minimize background signal. Coverslips were first coated with 0.1% (w/v) poly‐L‐lysine (Sigma‐Aldrich, #P8920) for 15 min, washed with H2O (1×) and PBS (3×) and stored in 70% ethanol for later use. Processed cells were centrifuged (3 min, 500 g) and resuspended in 100 μl DigWash (see pA‐DamID section) or PBS with 1:500 m6A‐Tracer protein (1.15 mg/ml) and 1:500 secondary anti‐rabbit antibody (Jackson 711‐585‐152, donkey, Alexa 594) and rotated for 1 h at 4°C. Cells were washed 2× with 0.5 ml cold DigWash or PBS to remove unbound fluorophores and then bound to poly‐L‐lysine‐coated coverslips on ice. The last wash was always performed with PBS. Cells were fixed at room temperature on the coverslips for 10 min with 2% formaldehyde/PBS and washed with PBS. After a final wash with H2O, coverslips were mounted with Vectashield + DAPI (Vector Laboratories, #H‐1200), dried, and sealed with nail polish.
Effect of pA‐DamID on endogenous LADs
HT1080 cells expressing inducible Dam‐Lamin were plated both on coverslips and in a regular culture dish and Dam‐Lamin B1 expression was activated overnight with 500 nM Shield1 (Aobious #AOB1848). Cells grown in the culture dish were trypsinized and processed with the pA‐DamID protocol, but without pA‐Dam or Dam added. The cells were then fixed on poly‐L‐lysine‐coated coverslips as described above. As soon as the culture dish cells were permeabilized, the cells on coverslips were fixed with 2% formaldehyde/PBS for 10 min, permeabilized for 20 min with 0.5% NP‐40/PBS and blocked with 1% BSA/PBS for 1 h. Next, coverslips were incubated for 1 h at room temperature with 1:500 Lamin B1 antibody (Abcam ab16048, rabbit) and washed 3× with PBS. PBS with 1:500 m6A‐Tracer protein (1.15 mg/ml) and 1:500 secondary anti‐rabbit antibody (Jackson 711‐585‐152, donkey, Alexa 594) was added and incubated for 1 h, followed by washing with PBS (3×) and H2O (1×), and mounted with Vectashield + DAPI. For comparison, wild‐type HT1080 cells (not expressing Dam‐Lamin B1) were subjected to pA‐DamID using Lamin B2 antibody and processed as the HT1080 Dam‐Lamin B1 HTC75 cells.
Microscopy and image analysis
Single 1,024 × 1,024 confocal sections were imaged on a Leica SP5 with a 63× NA 1.47 oil immersion objective, using bidirectional scanning, 3× electronic zoom, and 8× line averaging.
Image analysis was performed in ImageJ 2.0.0 and R. To calculate peripheral enrichment, nuclei were segmented on the DAPI staining and split into a peripheral ring and interior. Mean signal was determined for both compartments. Peripheral enrichment was defined as the log2 ratio of the mean peripheral compartment signal over the interior compartment. The peripheral compartment was defined as the outline of a DAPI mask dilated by 2 pixels to capture all signal. This mask thus extended the boundaries of the nucleus and could lead to a negative enrichment. Laser power varied between experiments but was kept constant within each experiment.
To calculate halfway decay distances, DAPI‐segmented nuclei were morphologically dilated by 2 pixels and a distance map to the mask edge was calculated. This distance map was used to determine the mean pixel‐score to the periphery for lamin B2 antibody and m6A‐Tracer. A trimmed mean was used to make the average more robust to outliers, where 20% on both sides was discarded. For both the lamin B2 antibody and m6A‐Tracer, an exponential decay function was fitted starting from the maximum value and used to determine the halfway decay distance. The difference in halfway decay distances was used as measure of LAD positioning relative to the NL. Laser power varied between images to achieve optimal quality to estimate the halfway decay distance.
Differential analysis for LADs
We accounted for differences in dynamic range in pA‐DamID signals between experiments by converting the log2 (Lamin B2 : Dam) data to z‐scores (mean of zero and a standard deviation of one), thus keeping the data distribution identical. For every population (i.e., HCT116 G1; hTERT‐RPE 3 h), a consensus LAD definition was determined by selecting LADs that are called in more than half of the replicates using hidden Markov modeling (https://github.com/gui11aume/HMMt). Next, we determined the union across different conditions (i.e., HCT116 G1 and G2). The LAD score was defined as the mean signal of scaled data tracks.
Significant changes were called using a modified limma‐voom approach (Law et al, 2014). Limma‐voom is a limma extension that models the mean–variance relationship of log counts. The reasoning is that high counts generally have lower variation. DamID data are already in log scale and can easily be adapted for this purpose. However, a high log ratio in DamID can be supported by few reads and thus have a high variation. Instead, we use the number of lamin reads to model the mean–variance relation for LAD scores. This explained the mean–variance relation better than combined lamin and Dam reads, most likely because Dam signal is more widespread than lamin signal and therefore less informative. We used a linear spline between the time points to call significant changes for the hTERT‐RPE time course experiment (Ritchie et al, 2015). Significance was defined as a Benjamini–Hochberg adjusted P‐value lower than 0.01. For the cell cycle sorting experiment, we performed pairwise testing on the LAD scores between G1 and G2. The power to detect significant changes was lower because it uses two data points (G1, G2) per replicate instead of five (all the hTERT‐RPE time points). To keep the number of differential LADs roughly identical, we decided to change the significance threshold for this experiment (0.05 for K562 and HCT116, 0.001 for HAP‐1 which has an additional replicate and thus more power to detect significance).
Active genes definition
RNA‐seq reads were downloaded from ENCODE and published reports (Appendix Table S1). Reads were processed with fastp 0.12.2 to remove potential adapter sequences and low‐quality reads (Chen et al, 2018a) and aligned to GRCh38 v15 and counted in Gencode genes v24 with STAR 2.5.4a (Dobin et al, 2013). Regularized log2 transformed values from DESeq2 1.18.1 were used a measure of gene expression (Love et al, 2014). Active genes were defined as genes with a mean cell score of 7 or higher, which falls between the bimodal distribution of inactive and active genes.
Replication timing comparison
Processed replication timing data at a 5 kb resolution for hTERT‐RPE, K562 and HCT116 cells were downloaded from the 4D Nucleome data repository (https://data.4dnucleome.org). The mean signal of four adjacent bins was used to compare to the 20 kb binned pA‐DamID data.
Hi‐C subcompartments
Hi‐C subcompartments were used as imputed by SNIPER (Xiong & Ma, 2019), based on Hi‐C data from K562 (Rao et al, 2014) and Hap1 (Sanborn et al, 2015).
CTCF‐binding sites
CTCF‐binding sites for HCT116 and K562 were downloaded from ENCODE (HCT116 : ENCFF518MQA; K562 : ENCFF519CXF) (Consortium EP, 2012). CTCF‐binding sites for HAP‐1 were used from Haarhuis et al (2017) and converted to hg38 using UCSC liftOver.
Telomere and centromere distance
Telomeres were defined as the first and last base of GRCh38. Centromere locations for GRCh38 were downloaded from the UCSC table browser (group: mapping and sequencing; track: centromeres).
Boxplot visualization
All boxplots were generated in R with ggplot2, using default settings. The box represents 25th, 50th, and 75th percentiles of the data distribution. The whiskers extend to the smallest values no further than 1.5 times the interquartile distance (distance between 25th and 75th percentiles).
Author contributions
TS: Conceived and designed study, conducted majority of experiments and data analysis, wrote manuscript. DP‐H: Performed experiments. MV: Performed experiments. PHNC: Produced and purified proteins. BS: Designed study, wrote manuscript, and supervised project.
Conflict of interest
TvS and BvS are exploring possible commercial applications of pA‐DamID.
Supporting information
Appendix
Expanded View Figures PDF
Review Process File
Acknowledgements
We thank the NKI Genomics, Flow Cytometry, Digital Microscopy, and RHPC core facilities for technical assistance. We thank Andrew Belmont, Jian Ma, David Gilbert, and other members of the 4DN Center for Nuclear Cytomics for helpful discussions. We thank the laboratory of David Gilbert for sharing Repli‐seq data prior to publication. We thank the laboratory of Jop Kind for sharing an unpublished HT1080 inducible Dam‐Lamin B1 clone. Supported by NIH Common Fund “4D Nucleome” Program grant U54DK107965 (BvS). The Oncode Institute is partly supported by KWF Dutch Cancer Society.
EMBO Reports (2020) 21: e50636
Data availability
The datasets and computer code produced in this study are available in the following repositories:
DamID and pA‐DamID data, raw and processed files: 4D Nucleome data repository (https://data.4dnucleome.org/publications/5a5117c9-face-4648-bbb7-d54e468af2ba/#overview).
Computer scripts: https://github.com/vansteensellab/Lamina_CellCycleDynamics
Lab journal records: https://osf.io/ravmc/
References
- Abney JR, Cutler B, Fillbach ML, Axelrod D, Scalettar BA (1997) Chromatin dynamics in interphase nuclei and its implications for nuclear structure. J Cell Biol 137: 1459–1468 [DOI] [PMC free article] [PubMed] [Google Scholar]
- Abramo K, Valton AL, Venev SV, Ozadam H, Fox AN, Dekker J (2019) A chromosome folding intermediate at the condensin‐to‐cohesin transition during telophase. Nat Cell Biol 21: 1393–1402 [DOI] [PMC free article] [PubMed] [Google Scholar]
- Adam SA, Marr RS, Gerace L (1990) Nuclear protein import in permeabilized mammalian cells requires soluble cytoplasmic factors. J Cell Biol 111: 807–816 [DOI] [PMC free article] [PubMed] [Google Scholar]
- Adriaens C, Serebryannyy LA, Feric M, Schibler A, Meaburn KJ, Kubben N, Trzaskoma P, Shachar S, Vidak S, Finn EH et al (2018) Blank spots on the map: some current questions on nuclear organization and genome architecture. Histochem Cell Biol 150: 579–592 [DOI] [PMC free article] [PubMed] [Google Scholar]
- Cheetham SW, Gruhn WH, van den Ameele J, Krautz R, Southall TD, Kobayashi T, Surani MA, Brand AH (2018) Targeted DamID reveals differential binding of mammalian pluripotency factors. Development 145: dev170209 [DOI] [PMC free article] [PubMed] [Google Scholar]
- Chen S, Zhou Y, Chen Y, Gu J (2018a) fastp: an ultra‐fast all‐in‐one FASTQ preprocessor. Bioinformatics 34: i884–i890 [DOI] [PMC free article] [PubMed] [Google Scholar]
- Chen Y, Zhang Y, Wang Y, Zhang L, Brinkman EK, Adam SA, Goldman R, van Steensel B, Ma J, Belmont AS (2018b) Mapping 3D genome organization relative to nuclear compartments using TSA‐Seq as a cytological ruler. J Cell Biol 217: 4025–4048 [DOI] [PMC free article] [PubMed] [Google Scholar]
- Chubb JR, Boyle S, Perry P, Bickmore WA (2002) Chromatin motion is constrained by association with nuclear compartments in human cells. Curr Biol 12: 439–445 [DOI] [PubMed] [Google Scholar]
- Collas P, Liyakat Ali TM, Brunet A, Germier T (2019) Finding friends in the crowd: three‐dimensional cliques of topological genomic domains. Front Genet 10: 602 [DOI] [PMC free article] [PubMed] [Google Scholar]
- Consortium EP (2012) An integrated encyclopedia of DNA elements in the human genome. Nature 489: 57–74 [DOI] [PMC free article] [PubMed] [Google Scholar]
- Crabbe L, Cesare AJ, Kasuboski JM, Fitzpatrick JA, Karlseder J (2012) Human telomeres are tethered to the nuclear envelope during postmitotic nuclear assembly. Cell Rep 2: 1521–1529 [DOI] [PMC free article] [PubMed] [Google Scholar]
- Dechat T, Korbei B, Vaughan OA, Vlcek S, Hutchison CJ, Foisner R (2000) Lamina‐associated polypeptide 2alpha binds intranuclear A‐type lamins. J Cell Sci 113(Pt. 19): 3473–3484 [DOI] [PubMed] [Google Scholar]
- Dechat T, Gajewski A, Korbei B, Gerlich D, Daigle N, Haraguchi T, Furukawa K, Ellenberg J, Foisner R (2004) LAP2alpha and BAF transiently localize to telomeres and specific regions on chromatin during nuclear assembly. J Cell Sci 117: 6117–6128 [DOI] [PubMed] [Google Scholar]
- Dekker J, Belmont AS, Guttman M, Leshyk VO, Lis JT, Lomvardas S, Mirny LA, O'Shea CC, Park PJ, Ren B et al (2017) The 4D nucleome project. Nature 549: 219–226 [DOI] [PMC free article] [PubMed] [Google Scholar]
- Diedenhofen B, Musch J (2015) cocor: a comprehensive solution for the statistical comparison of correlations. PLoS ONE 10: e0121945 [DOI] [PMC free article] [PubMed] [Google Scholar]
- Dimitrova DS, Gilbert DM (1998) Regulation of mammalian replication origin usage in Xenopus egg extract. J Cell Sci 111(Pt. 19): 2989–2998 [DOI] [PubMed] [Google Scholar]
- Dobin A, Davis CA, Schlesinger F, Drenkow J, Zaleski C, Jha S, Batut P, Chaisson M, Gingeras TR (2013) STAR: ultrafast universal RNA‐seq aligner. Bioinformatics 29: 15–21 [DOI] [PMC free article] [PubMed] [Google Scholar]
- Ellenberg J, Siggia ED, Moreira JE, Smith CL, Presley JF, Worman HJ, Lippincott‐Schwartz J (1997) Nuclear membrane dynamics and reassembly in living cells: targeting of an inner nuclear membrane protein in interphase and mitosis. J Cell Biol 138: 1193–1206 [DOI] [PMC free article] [PubMed] [Google Scholar]
- Gel B, Diez‐Villanueva A, Serra E, Buschbeck M, Peinado MA, Malinverni R (2016) regioneR: an R/Bioconductor package for the association analysis of genomic regions based on permutation tests. Bioinformatics 32: 289–291 [DOI] [PMC free article] [PubMed] [Google Scholar]
- Gerace L, Blum A, Blobel G (1978) Immunocytochemical localization of the major polypeptides of the nuclear pore complex‐lamina fraction. Interphase and mitotic distribution. J Cell Biol 79: 546–566 [DOI] [PMC free article] [PubMed] [Google Scholar]
- Gonzalez‐Sandoval A, Gasser SM (2016) On TADs and LADs: spatial control over gene expression. Trends Genet 32: 485–495 [DOI] [PubMed] [Google Scholar]
- Greil F, Moorman C, van Steensel B (2006) DamID: mapping of in vivo protein‐genome interactions using tethered DNA adenine methyltransferase. Methods Enzymol 410: 342–359 [DOI] [PubMed] [Google Scholar]
- Guelen L, Pagie L, Brasset E, Meuleman W, Faza MB, Talhout W, Eussen BH, de Klein A, Wessels L, de Laat W et al (2008) Domain organization of human chromosomes revealed by mapping of nuclear lamina interactions. Nature 453: 948–951 [DOI] [PubMed] [Google Scholar]
- Haarhuis JHI, van der Weide RH, Blomen VA, Yanez‐Cuna JO, Amendola M, van Ruiten MS, Krijger PHL, Teunissen H, Medema RH, van Steensel B et al (2017) The cohesin release factor WAPL restricts chromatin loop extension. Cell 169: 693–707.e614 [DOI] [PMC free article] [PubMed] [Google Scholar]
- Haraguchi T, Kojidani T, Koujin T, Shimi T, Osakada H, Mori C, Yamamoto A, Hiraoka Y (2008) Live cell imaging and electron microscopy reveal dynamic processes of BAF‐directed nuclear envelope assembly. J Cell Sci 121: 2540–2554 [DOI] [PubMed] [Google Scholar]
- Harr JC, Luperchio TR, Wong X, Cohen E, Wheelan SJ, Reddy KL (2015) Directed targeting of chromatin to the nuclear lamina is mediated by chromatin state and A‐type lamins. J Cell Biol 208: 33–52 [DOI] [PMC free article] [PubMed] [Google Scholar]
- Hermann A, Jeltsch A (2003) Methylation sensitivity of restriction enzymes interacting with GATC sites. Biotechniques 34: 924–926, 928, 930. [DOI] [PubMed] [Google Scholar]
- Hiratani I, Ryba T, Itoh M, Yokochi T, Schwaiger M, Chang CW, Lyou Y, Townes TM, Schubeler D, Gilbert DM (2008) Global reorganization of replication domains during embryonic stem cell differentiation. PLoS Biol 6: e245 [DOI] [PMC free article] [PubMed] [Google Scholar]
- Hutchison CJ (2014) B‐type lamins in health and disease. Semin Cell Dev Biol 29: 158–163 [DOI] [PMC free article] [PubMed] [Google Scholar]
- Kaya‐Okur HS, Wu SJ, Codomo CA, Pledger ES, Bryson TD, Henikoff JG, Ahmad K, Henikoff S (2019) CUT&Tag for efficient epigenomic profiling of small samples and single cells. Nat Commun 10: 1930 [DOI] [PMC free article] [PubMed] [Google Scholar]
- Kind J, Pagie L, Ortabozkoyun H, Boyle S, de Vries SS, Janssen H, Amendola M, Nolen LD, Bickmore WA, van Steensel B (2013) Single‐cell dynamics of genome‐nuclear lamina interactions. Cell 153: 178–192 [DOI] [PubMed] [Google Scholar]
- Kind J, van Steensel B (2014) Stochastic genome‐nuclear lamina interactions: modulating roles of Lamin A and BAF. Nucleus 5: 124–130 [DOI] [PMC free article] [PubMed] [Google Scholar]
- Kind J, Pagie L, de Vries SS, Nahidiazar L, Dey SS, Bienko M, Zhan Y, Lajoie B, de Graaf CA, Amendola M et al (2015) Genome‐wide maps of nuclear lamina interactions in single human cells. Cell 163: 134–147 [DOI] [PMC free article] [PubMed] [Google Scholar]
- Law CW, Chen Y, Shi W, Smyth GK (2014) voom: Precision weights unlock linear model analysis tools for RNA‐seq read counts. Genome Biol 15: R29 [DOI] [PMC free article] [PubMed] [Google Scholar]
- Leemans C, van der Zwalm MCH, Brueckner L, Comoglio F, van Schaik T, Pagie L, van Arensbergen J, van Steensel B (2019) Promoter‐Intrinsic and Local Chromatin Features Determine Gene Repression in LADs. Cell 177: 852–864.e814 [DOI] [PMC free article] [PubMed] [Google Scholar]
- Liu X, Fagotto F (2011) A method to separate nuclear, cytosolic, and membrane‐associated signaling molecules in cultured cells. Sci Signal 4: pl2 [DOI] [PubMed] [Google Scholar]
- Lochs SJA, Kefalopoulou S, Kind J (2019) Lamina associated domains and gene regulation in development and cancer. Cells 8 [DOI] [PMC free article] [PubMed] [Google Scholar]
- Love MI, Huber W, Anders S (2014) Moderated estimation of fold change and dispersion for RNA‐seq data with DESeq2. Genome Biol 15: 550 [DOI] [PMC free article] [PubMed] [Google Scholar]
- Luna‐Vargas MP, Christodoulou E, Alfieri A, van Dijk WJ, Stadnik M, Hibbert RG, Sahtoe DD, Clerici M, Marco VD, Littler D et al (2011) Enabling high‐throughput ligation‐independent cloning and protein expression for the family of ubiquitin specific proteases. J Struct Biol 175: 113–119 [DOI] [PubMed] [Google Scholar]
- Luperchio TR, Wong X, Reddy KL (2014) Genome regulation at the peripheral zone: lamina associated domains in development and disease. Curr Opin Genet Dev 25: 50–61 [DOI] [PubMed] [Google Scholar]
- Luperchio T, Sauria M, Hoskins V, Wong X, DeBoy E, Gaillard M‐C, Tsang P, Pekrun K, Ach R, Yamada N et al (2018) The repressive genome compartment is established early in the cell cycle before forming the lamina associated domains. bioRxiv 10.1101/481598 [PREPRINT] [DOI] [Google Scholar]
- Marchal C, Sasaki T, Vera D, Wilson K, Sima J, Rivera‐Mulia JC, Trevilla‐Garcia C, Nogues C, Nafie E, Gilbert DM (2018) Genome‐wide analysis of replication timing by next‐generation sequencing with E/L Repli‐seq. Nat Protoc 13: 819–839 [DOI] [PMC free article] [PubMed] [Google Scholar]
- Marshall WF, Straight A, Marko JF, Swedlow J, Dernburg A, Belmont A, Murray AW, Agard DA, Sedat JW (1997) Interphase chromosomes undergo constrained diffusional motion in living cells. Curr Biol 7: 930–939 [DOI] [PubMed] [Google Scholar]
- Merkenschlager M, Nora EP (2016) CTCF and cohesin in genome folding and transcriptional gene regulation. Annu Rev Genomics Hum Genet 17: 17–43 [DOI] [PubMed] [Google Scholar]
- Meuleman W, Peric‐Hupkes D, Kind J, Beaudry JB, Pagie L, Kellis M, Reinders M, Wessels L, van Steensel B (2013) Constitutive nuclear lamina‐genome interactions are highly conserved and associated with A/T‐rich sequence. Genome Res 23: 270–280 [DOI] [PMC free article] [PubMed] [Google Scholar]
- Moir RD, Montag‐Lowy M, Goldman RD (1994) Dynamic properties of nuclear lamins: lamin B is associated with sites of DNA replication. J Cell Biol 125: 1201–1212 [DOI] [PMC free article] [PubMed] [Google Scholar]
- Moir RD, Spann TP, Lopez‐Soler RI, Yoon M, Goldman AE, Khuon S, Goldman RD (2000a) Review: the dynamics of the nuclear lamins during the cell cycle– relationship between structure and function. J Struct Biol 129: 324–334 [DOI] [PubMed] [Google Scholar]
- Moir RD, Yoon M, Khuon S, Goldman RD (2000b) Nuclear lamins A and B1: different pathways of assembly during nuclear envelope formation in living cells. J Cell Biol 151: 1155–1168 [DOI] [PMC free article] [PubMed] [Google Scholar]
- Nagano T, Wingett SW, Fraser P (2017) Capturing three‐dimensional genome organization in individual cells by single‐cell Hi‐C. Methods Mol Biol 1654: 79–97 [DOI] [PubMed] [Google Scholar]
- O'Keefe RT, Henderson SC, Spector DL (1992) Dynamic organization of DNA replication in mammalian cell nuclei: spatially and temporally defined replication of chromosome‐specific alpha‐satellite DNA sequences. J Cell Biol 116: 1095–1110 [DOI] [PMC free article] [PubMed] [Google Scholar]
- Peric‐Hupkes D, Meuleman W, Pagie L, Bruggeman SW, Solovei I, Brugman W, Graf S, Flicek P, Kerkhoven RM, van Lohuizen M et al (2010) Molecular maps of the reorganization of genome‐nuclear lamina interactions during differentiation. Mol Cell 38: 603–613 [DOI] [PMC free article] [PubMed] [Google Scholar]
- Pickersgill H, Kalverda B, de Wit E, Talhout W, Fornerod M, van Steensel B (2006) Characterization of the Drosophila melanogaster genome at the nuclear lamina. Nat Genet 38: 1005–1014 [DOI] [PubMed] [Google Scholar]
- Pindyurin AV, Pagie L, Kozhevnikova EN, van Arensbergen J, van Steensel B (2016) Inducible DamID systems for genomic mapping of chromatin proteins in Drosophila. Nucleic Acids Res 44: 5646–5657 [DOI] [PMC free article] [PubMed] [Google Scholar]
- Poleshko A, Smith CL, Nguyen SC, Sivaramakrishnan P, Wong KG, Murray JI, Lakadamyali M, Joyce EF, Jain R, Epstein JA (2019) H3K9me2 orchestrates inheritance of spatial positioning of peripheral heterochromatin through mitosis. Elife 8: e49278 [DOI] [PMC free article] [PubMed] [Google Scholar]
- Rao SS, Huntley MH, Durand NC, Stamenova EK, Bochkov ID, Robinson JT, Sanborn AL, Machol I, Omer AD, Lander ES et al (2014) A 3D map of the human genome at kilobase resolution reveals principles of chromatin looping. Cell 159: 1665–1680 [DOI] [PMC free article] [PubMed] [Google Scholar]
- Rhind N, Gilbert DM (2013) DNA replication timing. Cold Spring Harb Perspect Biol 5: a010132 [DOI] [PMC free article] [PubMed] [Google Scholar]
- Ritchie ME, Phipson B, Wu D, Hu Y, Law CW, Shi W, Smyth GK (2015) limma powers differential expression analyses for RNA‐sequencing and microarray studies. Nucleic Acids Res 43: e47 [DOI] [PMC free article] [PubMed] [Google Scholar]
- Robinson MD, McCarthy DJ, Smyth GK (2010) edgeR: a Bioconductor package for differential expression analysis of digital gene expression data. Bioinformatics 26: 139–140 [DOI] [PMC free article] [PubMed] [Google Scholar]
- Sanborn AL, Rao SS, Huang SC, Durand NC, Huntley MH, Jewett AI, Bochkov ID, Chinnappan D, Cutkosky A, Li J et al (2015) Chromatin extrusion explains key features of loop and domain formation in wild‐type and engineered genomes. Proc Natl Acad Sci USA 112: E6456–E6465 [DOI] [PMC free article] [PubMed] [Google Scholar]
- Shevelyov YY, Ulianov SV (2019) The nuclear lamina as an organizer of chromosome architecture. Cells 8 [DOI] [PMC free article] [PubMed] [Google Scholar]
- Skene PJ, Henikoff S (2017) An efficient targeted nuclease strategy for high‐resolution mapping of DNA binding sites. Elife 6 [DOI] [PMC free article] [PubMed] [Google Scholar]
- Sobecki M, Souaid C, Boulay J, Guerineau V, Noordermeer D, Crabbe L (2018) MadID, a versatile approach to map protein‐DNA interactions, highlights telomere‐nuclear envelope contact sites in human cells. Cell Rep 25: 2891–2903.e2895 [DOI] [PMC free article] [PubMed] [Google Scholar]
- Southall TD, Gold KS, Egger B, Davidson CM, Caygill EE, Marshall OJ, Brand AH (2013) Cell‐type‐specific profiling of gene expression and chromatin binding without cell isolation: assaying RNA Pol II occupancy in neural stem cells. Dev Cell 26: 101–112 [DOI] [PMC free article] [PubMed] [Google Scholar]
- van Steensel B, Belmont AS (2017) Lamina‐associated domains: links with chromosome architecture, heterochromatin, and gene repression. Cell 169: 780–791 [DOI] [PMC free article] [PubMed] [Google Scholar]
- van Steensel B, Henikoff S (2000) Identification of in vivo DNA targets of chromatin proteins using tethered dam methyltransferase. Nat Biotechnol 18: 424–428 [DOI] [PubMed] [Google Scholar]
- Thomson I, Gilchrist S, Bickmore WA, Chubb JR (2004) The radial positioning of chromatin is not inherited through mitosis but is established de novo in early G1. Curr Biol 14: 166–172 [DOI] [PubMed] [Google Scholar]
- Trowitzsch S, Bieniossek C, Nie Y, Garzoni F, Berger I (2010) New baculovirus expression tools for recombinant protein complex production. J Struct Biol 172: 45–54 [DOI] [PubMed] [Google Scholar]
- Vogel MJ, Peric‐Hupkes D, van Steensel B (2007) Detection of in vivo protein‐DNA interactions using DamID in mammalian cells. Nat Protoc 2: 1467–1478 [DOI] [PubMed] [Google Scholar]
- Xiong K, Ma J (2019) Revealing Hi‐C subcompartments by imputing inter‐chromosomal chromatin interactions. Nat Commun 10: 5069 [DOI] [PMC free article] [PubMed] [Google Scholar]
- Zhang H, Emerson DJ, Gilgenast TG, Titus KR, Lan Y, Huang P, Zhang D, Wang H, Keller CA, Giardine B et al (2019) Chromatin structure dynamics during the mitosis‐to‐G1 phase transition. Nature 576: 158–162 [DOI] [PMC free article] [PubMed] [Google Scholar]
Associated Data
This section collects any data citations, data availability statements, or supplementary materials included in this article.
Supplementary Materials
Appendix
Expanded View Figures PDF
Review Process File
Data Availability Statement
The datasets and computer code produced in this study are available in the following repositories:
DamID and pA‐DamID data, raw and processed files: 4D Nucleome data repository (https://data.4dnucleome.org/publications/5a5117c9-face-4648-bbb7-d54e468af2ba/#overview).
Computer scripts: https://github.com/vansteensellab/Lamina_CellCycleDynamics
Lab journal records: https://osf.io/ravmc/