

Abstract
Visual cortical circuits show profound plasticity during early life and are later stabilized by molecular “brakes” limiting excessive rewiring beyond a critical period. The mechanisms coordinating the expression of these factors during the transition from development to adulthood remain unknown. We found that miR‐29a expression in the visual cortex dramatically increases with age, but it is not experience‐dependent. Precocious high levels of miR‐29a blocked ocular dominance plasticity and caused an early appearance of perineuronal nets. Conversely, inhibition of miR‐29a in adult mice using LNA antagomirs activated ocular dominance plasticity, reduced perineuronal nets, and restored their juvenile chemical composition. Activated adult plasticity had the typical functional and proteomic signature of critical period plasticity. Transcriptomic and proteomic studies indicated that miR‐29a manipulation regulates the expression of plasticity brakes in specific cortical circuits. These data indicate that miR‐29a is a regulator of the plasticity brakes promoting age‐dependent stabilization of visual cortical connections.
Keywords: DNA methylation, microRNA, ocular dominance plasticity, perineuronal net
Subject Categories: Neuroscience, RNA Biology
Ocular dominance plasticity is maximal during critical periods of development. miR‐29a expression increases during development resulting in the suppression of key regulators of plasticity, such as perineuronal nets.
Introduction
Brain postnatal development is characterized by function‐specific and temporally delimited windows of high plasticity called critical or sensitive periods, the best known being the natural acquisition of a language in infants. Ocular dominance (OD) plasticity in the visual cortex represents the most widely employed paradigm to study critical periods (CPs). Deprivation of vision from one eye (monocular deprivation, MD) depresses cortical responses to stimulation of the deprived eye with maximal effects during the CP for OD plasticity. This paradigm has been exploited to identify cellular and molecular mechanisms delimiting CPs. A canonical view posits that OD plasticity decays passively with age; it is becoming increasingly clear, however, that plasticity levels are set by the coordinated action of age‐ and experience‐dependent molecular actors actively promoting or suppressing circuit plasticity (“plasticity brakes”; Hensch & Quinlan, 2018; Levelt & Hübener, 2012). These factors regulate different cellular processes, from transcriptional to translational control, and can act at different subcellular locations such as intracellular and extracellular synaptic compartments. For instance, perineuronal nets (PNNs) enwrapping parvalbumin‐positive (PV+) neurons increase in number and density with age and change their chemical composition inhibiting OD plasticity in the adult visual cortex (Pizzorusso et al, 2002; Carulli et al, 2010; Beurdeley et al, 2012; Miyata et al, 2012; Rowlands et al, 2018). Epigenetic modifications, such as histone acetylation and DNA methylation, are also regulated in coincidence with the closure of the CP (Putignano et al, 2007; Tognini et al, 2015; Stroud et al, 2017), and their experimental modulation in adulthood activates levels of plasticity normally encountered only at the juvenile stage (Putignano et al, 2007; Silingardi et al, 2010; Apulei et al, 2019). However, the upstream mechanisms coordinating the expression of these seemingly unrelated plasticity mechanisms remain unexplored.
MicroRNAs (miRNAs) are short non‐coding RNAs that regulate gene expression by binding mRNAs that show sequence complementarity, thereby repressing translation and reducing transcript stability (Bartel, 2018). Since each miRNA can target hundreds of transcripts, miRNAs can efficiently coordinate different cellular pathways acting as master regulators of complex biologically processes (Lippi et al, 2016; Rajman & Schratt, 2017). We hypothesized that miRNAs mediate the coordinated age‐regulation of different plasticity mechanisms setting CP timing. Previous work showed that during postnatal development, there is a dramatic regulation of the mouse visual cortex transcriptome accompanied by conspicuous changes in miRNA expression (Mazziotti et al, 2017a). In particular, the most upregulated miRNA was miR‐29a‐3p (miR‐29a), a member of a family including miR‐29a, miR‐29b, and miR‐29c. Mir‐29 family is strongly regulated by age across different species and different tissues (Somel et al, 2010; Ugalde et al, 2011; Baumgart et al, 2012; Inukai et al, 2012; Takahashi et al, 2012; Fenn et al, 2013; Nolan et al, 2014). Moreover, it regulates age‐dependent processes such as neuronal maturation (Kole et al, 2011) and aging‐associated accumulation of iron in the brain (Ripa et al, 2017). Finally, its predicted targets show overrepresentation of extracellular matrix remodeling enzymes and epigenetic factors (Fabbri et al, 2007; Amodio et al, 2015), two classes of molecules regulating the CP for OD plasticity. Thus, we set to investigate whether miR‐29a could act as an age‐dependent regulator of plasticity in the visual cortex.
Results
MiR‐29a age‐dependent increase controls extracellular matrix and gene transcription regulating factors
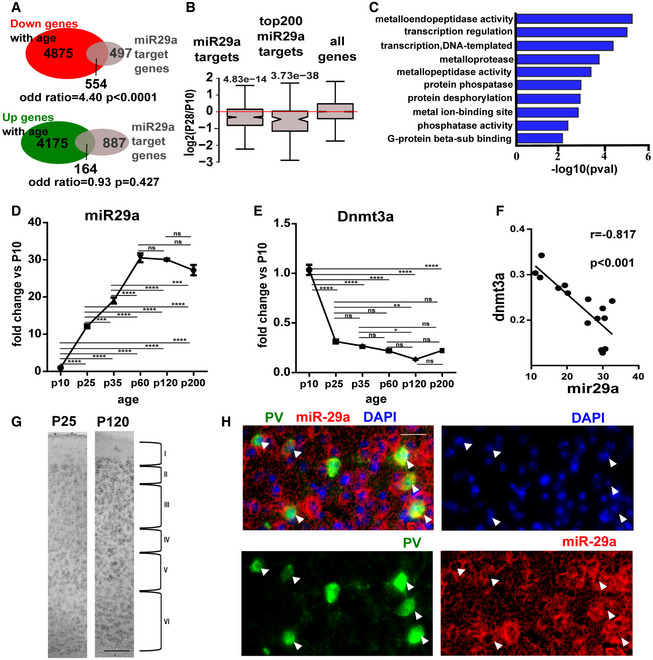
In order to unravel key miRNAs that regulate postnatal development of the visual cortex, we reanalyzed a dataset of coupled miRNA‐seq and RNA‐seq in the developing mouse visual cortex (Mazziotti et al, 2017a; Data ref: Mazziotti et al, 2017b). This analysis compared two time points: postnatal day 10 (P10), immediately before eye opening and CP onset, and P28, when mouse cortex reaches functional maturity (Espinosa & Stryker, 2012). The miR‐29 family, and in particular miR‐29a‐3p, was the microRNA with the largest age‐dependent upregulation. Importantly, we found a highly significant overrepresentation of miR‐29a‐predicted targets among the genes downregulated with age, but not among age‐upregulated genes (Fig 1A). Moreover, we observed that miR‐29a targets were selectively downregulated with age with respect to all expressed genes (Fig 1B). Age‐dependent downregulation of miR‐29a targets was even more evident for the targets with the strongest support (i.e., top 200 miR‐29a targets according to TargetScan ranking; Fig 1B). These data suggest that miR‐29a contributes to the age‐dependent repression of gene expression by destabilization of its target transcripts.
Figure 1. Developmental increase in miR‐29a regulates the expression of extracellular and epigenetic remodeling factors.
-
AVenn diagram showing the intersection between putative miR‐29a target genes (gray) and age‐upregulated (green, bottom) or age‐downregulated (red, top) genes. Ellipse area is proportional to the size of the sets. The numbers indicate the numerosity of the sets. 1,051 miR‐29a-predicted targets by TargetScan, 5,429 genes downregulated with age; 554 genes in the intersection, odds ratio 4.40; Fisher exact test, P < 0.0001; 4,339 upregulated genes with age; 164 genes in the intersection, odds ratio 0.93; Fisher exact test P = 0.427.
-
BBox plot showing the distribution of log2(FC) of all or selected miR‐29a targets in the Data ref: Mazziotti et al, 2017b dataset of age‐regulated genes in the visual cortex. Notches represent confidence intervals for the median. Whiskers indicate 95th and 5th percentile, the box marks the 25th and 75th percentile. Significance vs. all detected genes were assessed by Wilcoxon's test (miR‐29a targets P = 4.9 × 10⁻¹⁴, top 200 miR‐29a targets P = 3.7 × 10−38).
-
CDAVID functional annotation clustering analysis showing the most significantly overrepresented GO terms in age‐downregulated miR‐29 targets.
-
D, EMature miR‐29a (n = 3/4 mice for each age; one‐way ANOVA, P < 0.0001; post hoc Tukey's test ***P < 0.001, ****P < 0.0001, ns not significant) and Dnmt3a expression level (normalized to P10) at different ages measured by qPCR (n = 3/4 mice for each age; one‐way ANOVA, P < 0.0001; post hoc Tukey's test: *P < 0.05, **P < 0.01, ****P < 0.0001, ns not significant). One‐way ANOVA P‐values are reported. Error bars represent ±SEM.
-
FScatter plot showing correlation of miR‐29a and Dnmt3a levels in the visual cortex displays a strong negative correlation (Pearson correlation: r = −0.817, P < 0.001). Each circle represents data from a single animal.
-
GRepresentative examples of in situ hybridization on visual cortex (left P25, right P120) using a LNA probe against miR‐29a. Scale bar 180 μm. Cortical layers are delimited by roman numerals and brackets
-
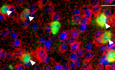
HExample of co‐staining for PV (green), miR‐29a (red), and nuclear marker (blue) in a P120 mouse. White triangles represent PV+/miR-29a+ cells. Scale bar 20 μm.
To gain insights into the molecular consequences of miR‐29a upregulation with age, we performed a gene ontology (GO) overrepresentation analysis of downregulated miR‐29a putative targets using DAVID (Huang et al, 2009a,b). We found a significant overrepresentation in the categories related to extracellular matrix (“metalloendopeptidase activity”, “metalloprotease”, “metallopeptidase”) and transcription regulation (“transcription regulation”, “transcription DNA templated”; Fig 1C), including key transcripts such as Mmps, Adamts, Dnmt3a, Dnmt3b, Tdg, Tet1, Tet2, and Tet3. Both pathways are well known to regulate OD plasticity of visual cortex during CP, and their experimental activation in the adult cortex promotes plasticity (Pizzorusso et al, 2002, 2006; Carulli et al, 2010; Tognini et al, 2015; Rowlands et al, 2018; Apulei et al, 2019).
To obtain a time‐resolved profile of miR‐29a expression in the visual cortex, we performed a qPCR analysis on six time points in an independent mouse cohort and observed a dramatic 30‐fold increase in mir‐29a levels beginning after P10 and reaching a plateau around P120, when OD plasticity is strongly reduced (Fig 1D). In parallel, we analyzed the age‐dependent regulation of Dnmt3a, a canonical and well‐validated target of miR‐29 (Fabbri et al, 2007; Morita et al, 2013; Amodio et al, 2015; Kuc et al, 2017). Dnmt3a expression was strongly downregulated with age (Fig 1E), and, as shown in Fig 1F, its levels were negatively correlated with miR‐29a levels. To investigate the distribution of miR‐29a in visual cortical cells, we performed in situ hybridization at P25 and P120 using a locked nucleic acid (LNA) probe recognizing the mature miRNA. The results confirmed the strong age‐dependent upregulation of miR‐29a (Fig 1G, N = 3). Furthermore, at both ages, the vast majority of cortical cells expressed miR‐29a. Considering the importance of PV+ interneurons in CP regulation (Levelt & Hübener, 2012; Takesian & Hensch, 2013), we specifically investigated miR‐29a expression in these cells by triple staining for miR‐29a, PV, and a nuclear marker at P120 (Fig 1H). We found that miR‐29a was expressed by many, if not all, PV+ interneurons (N = 3, 155 PV+ cells, 96.8% mir‐29a positive).
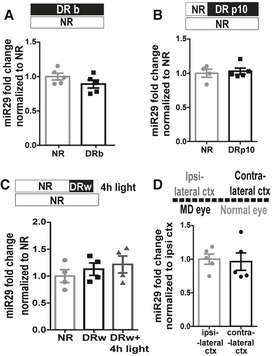
The expression of several molecular mediators of visual cortical plasticity, such as miR‐132, Arc, Bdnf, and Npas4, is regulated by the sensory input (Klein et al, 2007; Gao et al, 2010; Tognini et al, 2011, 2015; Kim et al, 2018). Thus, we investigated the effects of sensory stimulation on miR‐29a expression in four different conditions of experimentally altered visual input: i) dark rearing from birth (Fig 2A); ii) dark rearing from P10 (Fig 2B); iii) one week in darkness (P30‐P37) followed by 4 h of light exposure (Fig 2C); and iv) 3 days of MD (P25‐P28; Fig 2D). To investigate whether miR‐29a could be regulated by visual experience specifically in PV cells, we also performed miR‐29a in situ coupled with PV staining in dark reared mice (Fig EV2). The intensity of miR‐29a staining within PV cells and the percentage of PV and miR‐29a double‐stained cells were measured. None of these manipulations significantly affected miR‐29a levels, demonstrating that the regulation of miR‐29a is dictated by an intrinsic developmental timing that is not influenced by visual experience.
Figure 2. miR‐29a expression is not experience‐dependent.
-
A–DMature miR‐29a expression (miR29) in visually deprived mice: (A) normal rearing (NR, N = 5) vs. dark rearing (DRb, N = 5); t‐test, P = 0.19, (B) NR (N = 4) vs. dark rearing from P10 (DRp10, N = 5; t‐test, P = 0.70). In both experiments, analysis was performed at P25, (C) one week period of dark rearing beginning at P30 (DRw) followed by a 4‐h exposure to light (DRw + 4 h light) vs. control animals (ctr, N = 4 for each group; one‐way ANOVA, P = 0.68), (D) days of MD beginning at P25, contralateral cortex vs. ipsilateral cortex to deprived eye(N = 5; paired t‐test, P = 0.52). Error bars represent ±SEM, and symbols represent individual cases.
Figure EV2. miR29a expression in PV + cells of p25 mice reared normally (NR) or in darkness from birth (DRb).
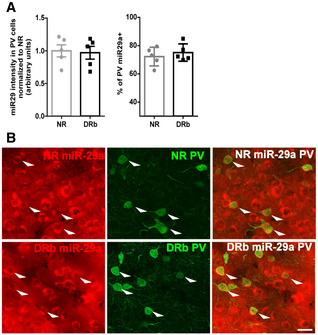
- Left: mir29a staining intensity was quantified in PV+ cells. No difference was present between NR and DRb mice (unpaired t‐test, N = 5 per group, P = 0.83). Right: Percentage of PV+ cells expressing miR‐29a is not affected by DRb (unpaired t‐test, N = 5 per group, P = 0.5). Symbols represent single animals. Bars represent mean ± SEM.
- Examples of miR‐29a (left) and PV (center) staining in NR and DRb mice. On the right the overlap between the two stainings. White arrowheads point at double‐stained cells. Scale bar = 60 μm.
Taken together, these results show that miR‐29a expression in the visual cortex is strongly age‐dependent and correlates with the plasticity reduction occurring at the end of the CP, naturally leading to the hypothesis that miR‐29a is causally linked to the age‐dependent regulation of experience‐dependent plasticity in visual cortical circuits.
Increasing miR‐29a levels during the CP blocks OD plasticity
If our hypothesis is correct, a premature increase in miR‐29a during CP should be sufficient to reduce plasticity and induce CP closure. To test this possibility, we experimentally increased miR‐29a levels during CP through intracortical administration of a synthetic miR‐29a mimic (mim29a) and assessed OD plasticity (Fig 3A). P24 mice were acutely injected with mim29a at three cortical sites surrounding the binocular visual cortex, as identified by optical imaging of the intrinsic signal (IOS). Baseline visual responses were acquired 24 h after injections, and the eyelids of the eye contralateral to the treated cortex were subsequently sutured shut. A second injection was performed at P26, and OD and molecular analyses were performed at P28. A separate group of mice underwent the same procedure but received injections of an oligonucleotide with a scrambled sequence matching miR‐29a nucleotide composition (scr) and served as controls.
Figure 3. miR‐29a upregulation blocks OD plasticity of young mice.
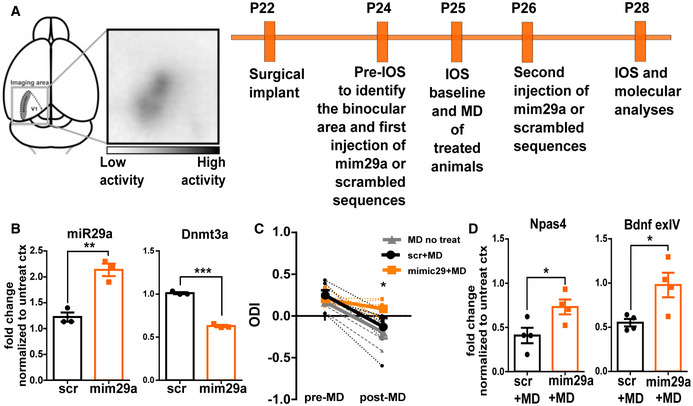
- Experimental design for miR‐29a mimic treatment in young mice. Primary visual cortex (V1).
- MiR‐29a and Dnmt3a expression in the cortex treated with scrambled or miR‐29a mimic (N = 3 mice). Data were normalized to the untreated cortex of the same animal. Mir‐29a: scr vs. mim29a, t‐test, P = 0.005; Dnmt3a scr vs. mim29a t‐test, P < 0.0001.
- IOS analysis. Ocular dominance index (ODI) of deprived animals treated with scrambled (scr, N = 6 black lines) or miR‐29a mimic (mimic29, N = 8 orange lines), or left untreated (MD no treat, N = 5 gray lines) before and after 3 days of MD. Dashed lines represent single animals, continuous lines the group average. Two‐way ANOVA RM, treatment × time, P = 0.028; post hoc Sidak's comparison, post‐MD mim29a vs. scr P < 0.05, mim29a vs. MD no treat P < 0.01; pre‐MD scr vs. post‐MD scr P < 0.001; pre‐MD MD no treat vs. post‐MD MD no treat P < 0.01; other comparisons not significant.
- The effects of MD on expression of Npas IV and Bdnf exIV are reported as ratio between expression level of deprived and non‐deprived cortex for animals treated with scrambled (scr+MD) and miR‐29a mimic (mim29a+MD). Each symbol represents the result of a single mouse. (MD+scr vs. MD+mim29a; N = 4; t‐test, Npas4: P = 0.038; Bdnf exIV: P = 0.049). Data information: Error bars represent ±SEM, asterisks statistical significance, *P < .05, **P < 0.001, ***P < 0.001.
To quantify the efficacy of mim29a treatment, we measured the levels of miR‐29a and of its validated target Dnmt3a at P28 by qPCR. We detected a near doubling of miR‐29a levels and a corresponding significant decrease in Dnmt3a levels in the visual cortex treated with mim29a with respect to scr‐treated cortex (Fig 3B).
We then assessed OD plasticity by recording IOS elicited by stimulation of either eye twice: before MD at P24 and after MD at P28. No difference in OD was present between mim29a‐treated and scr‐treated mice before MD. However, while in scr‐treated mice MD resulted in a reduction in the OD index (ODI), in mice treated with mim29a this shift of OD was not observed (Fig 3C). The OD shift induced by MD in scr‐treated mice did not differ from the OD shift present in naive mice (Fig 3C). The loss of plasticity induced by miR‐29a mimic was confirmed by analyzing the MD regulation of the molecular plasticity markers Npas4 and Bdnf exon IV in mim29a‐treated mice. The expression of these activity‐dependent transcripts is known to be reduced by MD (Tognini et al, 2015); however, the amplitude of their downregulation was smaller in mim29a‐treated mice with respect to controls (Fig 3D).
Overall, these data demonstrate that precocious upregulation of miR‐29a is sufficient to close the CP.
MiR‐29a antagonization in adult mice promotes OD plasticity
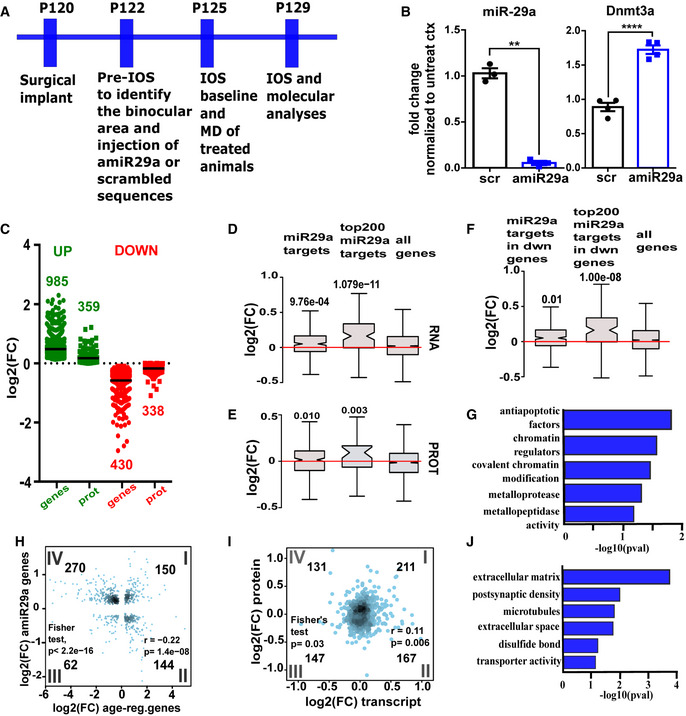
We then tested whether reduction in miR‐29a expression in the adult (P > 120) visual cortex is sufficient to induce OD plasticity. We injected an antagomiR, an LNA oligonucleotide whose sequence is complementary to miR29a (amiR‐29a) or a control LNA oligonucleotide with a scrambled sequence. LNA oligonucleotides stably bind their complementary miRNA, thereby blocking its activity and are resistant to enzymatic degradation. LNAs are extremely well tolerated and validated; indeed, they are approved for use in humans (Braasch & Corey, 2001; Khvorova & Watts, 2017; Smith et al, 2019). Injections were performed at three sites surrounding the binocular visual cortex identified by IOS imaging. Molecular analyses were performed seven days after amiR‐29a injections (Fig 4A).
Figure 4. Transcriptomic and proteomic effects of miR‐29a downregulation.
-
AExperimental design for amiR‐29a treatment in adult mice.
-
BEffects of amiR‐29a on the expression of miR‐29a and Dnmt3a. Fold change values with respect to the contralateral untreated cortex are reported (±SEM) for mice treated with amiR‐29a or scr. scr vs. amiR‐29a; N = 3 t‐test, miR‐29a **P = 0.0010; Dnmt3a ****P = 0.0019.
-
CDistribution of log2(FC) for the significant cases in transcriptomics (N = 4 scr‐treated and N = 3 amiR‐29a-treated biological replicates) and proteomics (N = 4 biological replicates per group) datasets of animals treated with amiR‐29a versus scr animals. The black line represents the average.
-
D, EBox plot showing distribution of log2(FC) of miR29a targets as (D) transcripts (RNA) and (E) proteins (PROT) in transcriptomic and proteomic datasets of adult animals treated with amiR‐29a. Notches correspond to confidence intervals of the median. Whiskers indicate 95th and 5th percentile, and the box marks the 25th and 75th percentile. Significance vs. all detected genes and proteins, respectively, assessed by Wilcoxon's test (P‐values shown in figure).
-
FBox plots reporting distribution of log2(FC) of age‐downregulated miR29a targets after amiR‐29a treatment (N = 4 scr‐treated and N = 3 amiR‐29a-treated biological replicates). Notches correspond to confidence intervals of the median. Whiskers indicate 95th and 5th percentile, and the box marks the 25th and 75th percentile. Significance was assessed with Wilcoxon's test (P‐values shown in figure).
-
GDAVID functional annotation clustering analysis showing the most significantly overrepresented GO terms of miR29a targets downregulated with age and upregulated by amiR‐29a treatment.
-
HScatter plot correlating the expression changes in genes significantly regulated by age (log2FC, x‐axis) and miR‐29a antagonization by amiR29a in adult mice (log2FC, y‐axis). (Spearman r = −0.22 P = 1.4 × 10⁻⁸; Fisher test showing significant enrichment in the IV quadrant P = 2.2 × 10⁻¹⁶). The number of genes for each quadrant is reported in figure.
-
IScatter plot correlating the expression changes induced by miR‐29a antagonization in adult mice at the transcript level (log2FC, x‐axis) and protein level (log2FC, y‐axis). Spearman coefficient correlation, r = 0.11; P = 0.006, Fisher test showing significant enrichment in the I quadrant P = 0.03. The number of genes for each quadrant is reported in figure.
-
JDAVID functional annotation clustering analysis showing the most overrepresented GO terms among genes showing consistent regulation at the transcript and protein level.
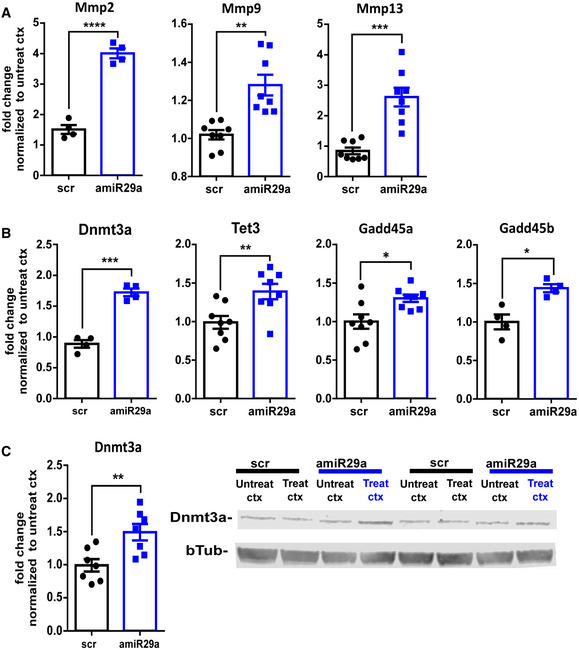
To assess the efficacy and the specificity of the amiR‐29a treatment, we performed qPCR and RNA‐seq analysis from the treated cortex. qPCR revealed that amiR‐29a treatment caused a decrease in miR‐29a and an increase in the miR‐29a target Dnmt3a (Fig 4B). RNA‐seq detected 15,303 expressed genes and 1,421 differentially expressed genes (DEGs) between amiR‐29a and control‐treated mice (adjusted P < 0.05), with 985 genes showing upregulation and 430 genes downregulation (Fig 4C; Dataset EV1; Fig EV1). Importantly, upregulated genes showed a significant overrepresentation of miR29a targets, but not of targets of other miRNAs (miTEA‐miRNA Target Enrichment Analysis, P < 0.001; Steinfeld et al, 2013; Eden et al, 2009). Moreover, we observed that miR‐29a targets were upregulated by amiR‐29a treatment (Fig 4D) and upregulation was larger for the top two hundreds miR‐29a targets in TargetScan ranking (Fig 4D, Wilcoxon test P = 10−11). We also found that 26% of the amiR‐29a upregulated genes were also significantly downregulated with age in the (Data ref: Mazziotti et al, 2017b) dataset (Fisher exact test, P < 0.001). Accordingly, miR‐29a target genes that were downregulated with age were selectively upregulated by amiR‐29a treatment (Fig 4F). Again, the effect was more pronounced in the top two hundreds TargetScan miR‐29a targets (Fig 4F). DAVID analysis revealed that miR‐29a targets downregulated with age and upregulated by amiR‐29a showed overrepresentation of the categories “chromatin regulators”, “metalloprotease”, and “metallopeptidase activity” (Fig 4G). Regulation of transcripts belonging to these categories was also quantified by qPCR in an independent cohort of mice detecting a significant increase in the transcripts coding for matrix metallopeptidases Mmp2, Mmp9, and Mmp13 (Fig EV3A), and for the epigenetic modifiers Dnmt3a, Tet3, Gadd45a, and Gadd45b (Fig EV3B). The increased expression of the canonical miR‐29a target DNMT3a was further confirmed at the protein level by Western blot (Fig EV3C). All these factors were previously shown to contribute to the developmental regulation of OD plasticity (Spolidoro et al, 2012; Kelly et al, 2015; Tognini et al, 2015; Murase et al, 2017; Apulei et al, 2019), suggesting that the age‐dependent increase in miR‐29a initiates and maintains the repression of plasticity by a coordinated downregulation of these permissive factors.
Figure EV1. RNA‐seq volcano plot.
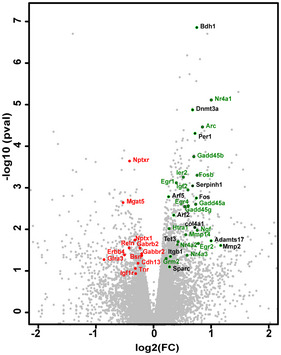
Volcano plot of RNA‐seq analysis showing for each differentially expressed gene (scr versus amiR29a) the relationship between its log2(fold change) and statistical significance (Cyber‐T, ‐log10pval) comparing the scr‐ and amiR‐29a‐treated cortex. Black dots correspond to selected targets of miR‐29, red dots to plasticity‐related downregulated genes, and green dots to activity‐dependent and plasticity‐related upregulated genes.
Figure EV3. miR‐29a regulates extracellular matrix and epigenetic transcripts.
-
A, BqPCR analysis of the expression of (A) extracellular matrix remodelers (MMP2, MMP9, MMP13) and (B) epigenetic factors (Dnmt3a, Tet3, Gadd45a, Gadd45b) in animals treated with amiR‐29a with respect to control animals treated with scrambled LNA (scr). Data for scr‐ and amiR‐29-treated cortices are normalized to the contralateral untreated cortex of the same animal.
-
CDnmt3a upregulation is confirmed also by Western blot analysis of visual cortex. Left: Quantification of the data shows Dnmt3a upregulation by amiR‐29a. The results are expressed as fold change normalized to untreated cortex. Each symbol represents the result of one animal. Right: example of Dnmt3a Western blot. The lanes corresponding to the treated (treat scr or treat amiR‐29a) and untreated (untreat scr or untreat amiR‐29a) cortex (ctx) of two amiR‐29a-treated and two scr‐treated mice are reported. Data information: Error bars represent ±SEM. Unpaired t‐test, N = 4–8, asterisks indicate statistical significance, *P < 0.05, **P < 0.01, ***P < 0.0001 ****P < 0.0001.
Reversal of transcriptome developmental regulation by miR‐29a inhibition could also be observed by global analysis of the cortical transcriptome after amiR‐29a treatment. Indeed, Fig 4H shows that the fold changes in genes significantly regulated both by age and by amiR‐29a were significantly negatively correlated. Overall, these data demonstrate that miR‐29a inhibition reverses part of the age‐dependent transcriptional program of the visual cortex.
To assess amiR‐29a effects at protein level, we performed proteomic analysis by means of mass spectroscopy‐based proteomics with data‐independent acquisition (DIA) in a cohort of mice different from those used for RNA‐seq. First, hierarchical clustering analysis of samples based of protein abundance showed clustering of animals treated with amiR‐29a, demonstrating that the treatment has a consistent effect on global protein composition in the treated mice (Appendix Fig S1). Among the 4,595 detected proteins, we found 359 proteins to be significantly upregulated and 338 proteins to be significantly downregulated (Dataset EV2, Fig 4C). We observed that miR‐29a targets were selectively upregulated by amiR‐29a treatment also at protein level (Fig 4E). The fold changes in differentially expressed proteins and transcripts showed a significant correlation (Fig 4I, Dataset EV3). To characterize the factors responsive to amiR‐29a, we selected significantly regulated genes showing a consistent regulation at the protein and transcript level. DAVID gene ontology analysis of these genes demonstrated an overrepresentation of extracellular matrix remodelers and synaptic proteins (Fig 4J). In light of the expression of miR‐29a in PV+ cells, and the role of these inhibitory neurons in CP closure, we investigated the effect of amiR‐29a on this cell population. We used the single‐cell portal for brain research launched by the Broad Institute of the MIT to visualize the density of regulated proteins in the cell clusters obtained by single‐cell RNA‐seq of the adult mouse visual cortex (Tasic et al, 2016; Fig EV4A). We found that the PV+ cell class showed the largest enrichment in amiR‐29a downregulated proteins (Fig EV4B). Sensitivity of PV+ cells to miR‐29a antagonization was also confirmed by the analysis of PV labeling in visual cortical sections (Fig EV4C) revealing a preserved density of PV+ cells, but a significant shift (Mann–Whitney test, P < 0.0001) of PV labeling intensity toward lower levels in the amiR‐29a‐treated visual cortex (Fig EV4D).
Figure EV4. PV cells are affected by miR‐29a antagonization.
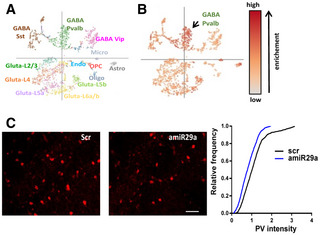
- Clusters of neurons in adult visual cortex based on single‐cell expression profiles from Tasic et al, 2016.
- Projection of downregulated proteins in adult mice treated with amiR‐29a on the clusters in (A). The intensity of the hue indicates the enrichment score. The most affected cell population is the “GABA parvalbumin” cell cluster.
- Examples of PV immunostaining in adult mice treated with scrambled (left) and amiR‐29a LNA (center). Scale bar 60 μm. On the right: quantification of PV relative intensity. Error bars represent ±SEM. Mann–Whitney test, P < 0.0001.
To test whether miR‐29a adult levels repress OD plasticity, we injected adult (P120) mice with amiR‐29a or control LNA. Three days later, the eye contralateral to the treated cortex was sutured and molecular and functional assessments were performed after four days of MD (scheme in Fig 4A). The amplitude of the cortical response to visual stimulation of the deprived and the non‐deprived eye was quantified by both visual evoked potential (VEP) recordings and IOS imaging.
VEPs showed a significant reduction in the ratio between the responses to the deprived and the non‐deprived eye in mice treated with amiR‐29a LNA, but not in control mice (Fig 5A). IOS analysis confirmed the presence of OD plasticity in amiR‐29a‐treated mice as shown by the significant change in ODI after MD (Fig 5B). In addition, IOS revealed that no difference in visual responses of amiR‐29a and control mice was detectable before MD, hence excluding the possibility that the observed effects are due to changes in cortical responses to visual stimulation of the contralateral eye induced by amiR‐29a. Thus, both VEPs and IOS performed in two separate cohorts of mice confirmed activation of OD plasticity in adult mice by miR‐29a inhibition.
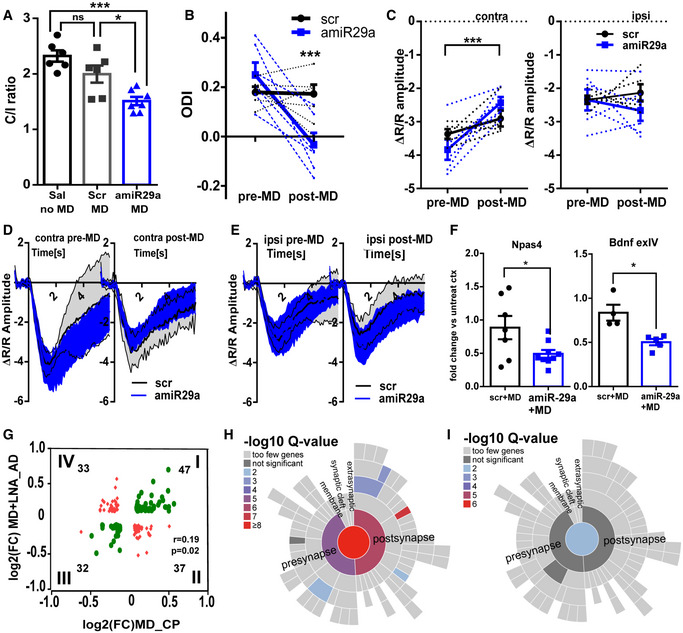
Figure 5. miR‐29a downregulation promotes experience‐dependent plasticity in adult mice with similar physiological and proteomics features of juvenile mice.
-
AVEP analysis. Ratio between contralateral and ipsilateral eye responses (C/I ratio ± SEM) in animals treated with saline and not deprived (sal no MD), with scrambled LNA and MD (scr MD), with amiR‐29a LNA and MD (amiR‐29a MD). N = 6/7; one‐way ANOVA, P = 0.0003; post hoc Tukey's test: sal noMD vs. scr+MD, ns; sal noMD vs. amiR‐29a+MD, P = 0.0002; scr+MD vs. amiR‐29a+MD, P = 0.0169.
-
BIOS analysis. ODI ± SEM of deprived animals treated with scr (N = 5, black lines) and amiR‐29a LNA (N = 6, blue lines). Dashed lines connect pre‐ and post‐MD ODI values of each animal. Solid lines represent the group average. Two‐way ANOVA RM, treatment × time, P = 0.0074; post hoc Sidak's test, pre‐MD scr vs. post‐MD scr, ns; pre‐MD vs. post‐MD amiR‐29a, P = 0.0005.
-
CIOS amplitude (± SEM) in response to contralateral eye (contra) and ipsilateral eye (ipsi) stimulation. Other conventions as in (B). amiR‐29a (N = 6) vs. scr (N = 5). Contra eye: two‐way ANOVA RM, time × treatment interaction P = 0.034; post hoc Sidak's test; pre‐MD vs. post‐MD scr, ns; pre‐MD vs. post‐MD amiR‐29a, P = 0.0008. Ipsi eye: two‐way ANOVA RM, time × treatment interaction, ns.
-
DAverage time course of the IOS response to visual stimulation of the contralateral eye (contra) pre‐ and post‐MD (thick black line). Gray area delimited by thin black lines envelops traces from scr animals (95% confidence interval); blue area envelops traces from amiR‐29a animals (95% confidence interval).
-
ESame as in (D) for ipsilateral eye (ipsi) pre‐ and post‐MD responses.
-
FThe effects of MD on Npas IV and Bdnf exIV expression are reported as the ratio between expression levels of deprived and non‐deprived cortex for animals treated with scrambled (scr+MD) and amiR‐29a (amiR‐29a+MD). Each symbol represents the result of one animal. Error bars represent ±SEM. scr vs. amiR‐29a; t‐test; N = 7–9, Npas4: P = 0.035; N = 4–5; Bdnf exIV: P = 0.026.
-
GScatter plot correlating the changes in protein abundance induced by MD in young mice (MD CP, x‐axis) with the effects observed in the adult deprived mice treated with amiR‐29a (MD+LNA_AD, y‐axis). Proteins present in both datasets and showing an absolute expression fold change (FC > 0.1) are represented. Green symbols correspond to proteins with concordant direction of regulation; red symbols correspond to discordant regulation. Pearson correlation: r = 0.19, P = 0.019. The number of genes in each quadrant is reported in figure.
-
H, IHierarchical dendrograms of synaptic proteins (SynGO database) showing significant enrichment by color‐code: (H) proteins with concordant regulation. (I) proteins with discordant regulation. Data information: Asterisks report statistical significance, *P < 0.05, ***P < 0.001.
Common functional and molecular signatures of OD plasticity during the CP and after miR‐29a inhibition in adult mice
Previous work suggested that MD of short duration during the CP results in selective depression of deprived eye responses (Frenkel & Bear, 2004; Sato & Stryker, 2008). Thus, we investigated whether this mechanism underlies also adult OD plasticity elicited by amiR‐29a. We found that OD shift induced by MD in amiR‐29a‐treated mice was due to decreased amplitude of cortical responses to stimulation of the deprived eye (Fig 5C and D), with no effects on responses to stimulation of the non‐deprived eye (Fig 5C and E). These data demonstrate that adult OD plasticity induced by amir‐29a and CP plasticity share similar physiological mechanisms.
We then set to investigate whether CP plasticity and plasticity induced in the adult visual cortex by miR‐29a antagonization also share key molecular features. We initially studied two activity‐dependent genes (Npas4 and Bdnf exIV) robustly downregulated by MD during CP (Fig 3D) and found that MD repressed their expression in amiR‐29a‐treated mice as well (Fig 5F). To obtain a global and unbiased comparison of the molecular signature of amiR‐29a‐induced plasticity and CP plasticity, we performed label‐free mass spectrometry‐based proteomic analyses of MD visual cortices during CP or in adulthood after treatment with amiR‐29a ([Link], [Link]). A total of 2,170 proteins were quantified in mice during the CP, and 168 proteins resulted to be significantly regulated by MD (P < 0.05). The same analysis in adult mice treated with amiR‐29a enabled the quantification of 1,871 proteins, out of which 199 were significantly regulated by MD (P < 0.05). We then tested the correlation in the fold changes induced by MD in the two datasets including all proteins with log2(FC) > 0.1 in both conditions (N = 149) and detected a significant positive correlation (Fig 5G; Dataset EV6), indicating that MD induced a similar regulation of the proteome in the two datasets.
Proteins were further subdivided into two subgroups based on the concordance of their regulation in the two datasets, and a GO overrepresentation analysis was performed on each protein subgroup using REACTOME (Jassal et al, 2019) as reference. No significant overrepresentation of terms was detected for the discordant proteins set. By contrast, the concordant protein set showed a significant overrepresentation of OD plasticity‐related terms such as “CREB phosphorylation through the activation of CaMKII” (R‐MMU‐442729), “unblocking of NMDA receptor” (R‐MMU‐438006), “transmission across chemical synapses” (R‐MMU‐112315; Fig EV5; Levelt & Hübener, 2012), mostly belonging to excitatory synapses (Fig EV5, Dataset EV6). To get a more specific insight into synaptic proteins, we analyzed concordant and discordant proteins using SynGo, a new curated database of proteins involved in synaptic functions and plasticity (Koopmans et al, 2019). Highly significant enrichment was detected only for concordant proteins, for which a significant overrepresentation of presynaptic and post‐synaptic proteins was present (Fig 5H and I). A full list of the significant categories is shown in [Link], [Link]. Thus, the mechanisms underlying OD plasticity induced by miR‐29a antagonization in the adult visual cortex activate molecular processes similar to those activated during CP plasticity.
Figure EV5. Gene ontology of MD‐regulated genes in CP and amiR‐29a mice.
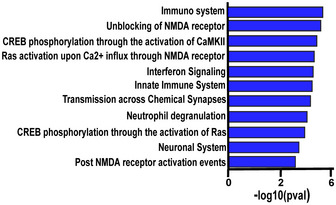
REACTOME categories showing significant (calculated by REACTOME) overrepresentation in the set of proteins with concordant regulation by MD during CP and in adult mice treated with amiR‐29a. Categories are ranked by significance.
miR‐29a age‐dependent expression regulates PNN structure and chemical composition
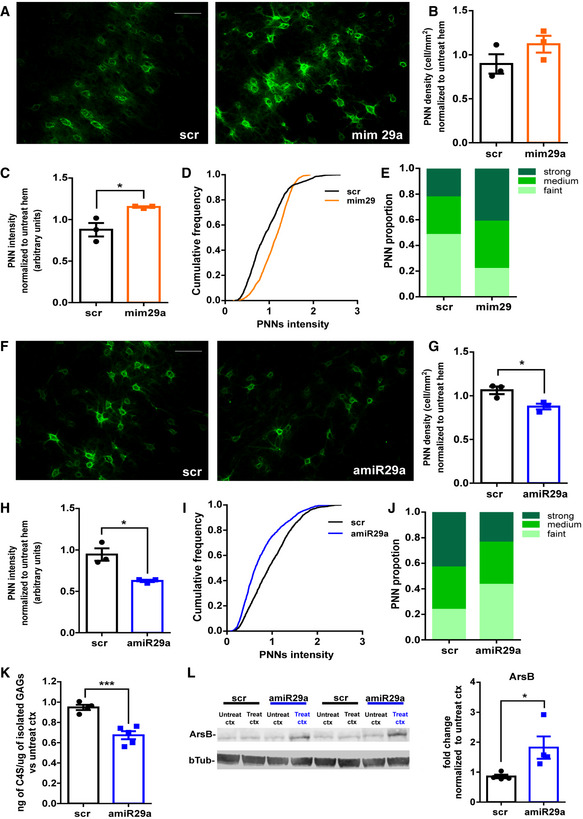
In order to understand the mechanisms by which juvenile and adult miR‐29a levels affect OD plasticity, we investigated PNN organization after experimental modulation of miR‐29a levels in the visual cortex of juvenile and adult mice. Indeed, previous work had shown that maturation of PNN enwrapping the soma of PV+ cells determines the closure of the CP for OD plasticity (Pizzorusso et al, 2002, 2006; Carulli et al, 2010; Beurdeley et al, 2012; Lensjø et al, 2017; Rowlands et al, 2018; Boggio et al, 2019). Moreover, our data show that age‐ and miR‐29a‐regulated genes are enriched in extracellular remodeling factors and that the PV+ cells show significant proteomic modulation by amiR‐29a (Fig 1C, Figs EV3A and EV4). Thus, we stained PNNs using Wisteria floribunda agglutinin (WFA) both in juvenile mice treated with mim29a and in adult mice treated with amiR‐29a (Fig 6A). PNN density was not different between juvenile mice treated with mim29a or scr (Fig 6B); however, a significant increase in PNN intensity (Fig 6C) was present in the mim29a‐treated group. Subdividing the distribution of PNN intensity in tertiles corresponding to strong, medium, and faint PNNs, we observed a significantly higher fraction of strong PNNs in miR‐29a mimic‐treated mice as compared to controls (Fig 6D and E). A high fraction of strongly labeled PNNs is typical of adult mice expressing low OD plasticity levels (Pizzorusso et al, 2002). Thus, premature adult‐like levels of miR‐29a resulted in PNN early maturation.
Figure 6. Manipulations of miR‐29a levels promote changes in PNNs.
-
AImages of WFA‐labeled PNNs of scrambled‐treated visual cortex (left) and miR‐29a mimic (right) in young mice. Scale bar 60 μm.
-
B, CQuantification of PNN density (scr vs. mim29a, N = 3 mice per group; t‐test, P = 0.20) and intensity for each animal (scr vs. mim29a, N = 3 mice per group; t‐test, P = 0.014).
-
DCumulative frequency of PNN staining intensity in scrambled‐ and mimic‐treated young mice scr (N = 1,438 cells vs. mim29a N = 1,749 cells, Kolmogorov–Smirnov test, P < 0.0001).
-
EPNN distribution in classes of intensity in mice treated with scrambled and mimic 29a.
-
FImages of WFA‐labeled PNNs of scrambled‐treated visual cortex (left) and amiR‐29a LNA (right) in adult mice. Scale bar 60 μm.
-
G, HQuantification of PNN density (scr vs. amiR‐29a, N = 3 mice per group; t‐test, P = 0.03) and intensity for each animal (scr vs. amiR‐29a, N = 3 mice per group; t‐test, P = 0.047).
-
ICumulative frequency of PNN intensity in scrambled and amiR‐29a-treated adult mice. scr N = 1,883 cells vs. amiR‐29a N = 1,937 cells, Kolmogorov–Smirnov test, P < 0.0001.
-
JPNN distribution in classes of intensity in mice treated with scrambled and amiR‐29a.
-
KBiochemical quantification of C4S in adult amiR‐29a-treated mice (N = 5) as compared to scrambled animals (N = 4). t‐test, P = 0.0008.
-
LExample of arylsulfatase B (ArsB) Western blot. Left: The lanes corresponding to the treated (treat scr or treat amiR‐29a) and untreated (untreat scr or untreat amiR‐29a) cortex (ctx) of two amiR‐29a-treated and two scr‐treated mice are reported. Right: Quantification of the data shows ArsB upregulation by amiR‐29a. The results are expressed as fold change normalized to untreated cortex. Each symbol represents the result of one animal. N = 4, scr vs. amiR‐29a-treated cortex, unpaired t‐test, P = 0.043 Data information: Error bars represent ±SEM. Asterisk statistical significance, *P < .05 **P < 0.001.
To test whether the high levels of miR‐29a observed in adult mice are necessary to maintain the mature PNN structure, we analyzed PNNs in adult mice treated with amiR‐29a. AmiR‐29a treatment resulted in a reduction in PNN density (Fig 6F and G) and intensity (Fig 6H), determining a lower fraction of strong PNNs (Fig 6I and J). Age‐dependent PNN maturation also involves changes in glycosaminoglycan (GAG) sulfation of chondroitin sulfate proteoglycans (CSPGs), mainly consisting in a shift from GAG sulfation in 6 position (C6S) to sulfation in 4 position (C4S; Foscarin et al, 2017). Previous work showed that restoring the juvenile form of GAG sulfation promotes plasticity in the adult visual cortex and renders CSPGs more permissive to axon growth, regeneration, and plasticity (Miyata et al, 2012; Yang et al, 2017). Thus, we tested whether amiR‐29a modifies PNNs also by reducing the adult C4S form of GAG sulfation. Biochemical analyses showed a significant decrease in C4S in adult animals treated with amiR‐29a (Fig 6K; ng of C4S/ug normalized to untreated cortex for scr and amiR‐29a mice), suggesting a reduced inhibitory action on plasticity of the residual PNNs present in the amiR‐29a‐treated cortex. C4S decrease was associated with a significant increased abundance of arylsulfatase B (ARSB), the enzyme that catalyzes the removal of 4‐sulfation from C4S (Yoo et al, 2013; Zhang et al, 2014), measured by mass spectrometry and independently confirmed by Western blot (Fig 6L). Thus, reducing the levels of miR‐29a in the adult visual cortex promotes CP plasticity mechanisms by acting both on PNN condensation and on chemical composition.
Discussion
The development and differentiation of neurons is clearly coordinated by a set of genes that act as master regulators. Although maturation of neuronal circuits is also a tightly coordinated processes, our knowledge of the gene networks that set the pace of neuronal maturation is very limited. In our work, we identify the microRNA family miR‐29 as an age‐dependent regulator of developmental plasticity in the visual cortex.
The regulation of miR‐29 family is strikingly conserved; its members are upregulated with age in fish, mice, and humans and in tissues as diverse as heart, skeletal muscle, aorta, skin, liver, kidney, lung, sympathetic neurons, and different brain regions (Somel et al, 2010; Ugalde et al, 2011; Baumgart et al, 2012; Inukai et al, 2012; Takahashi et al, 2012; Fenn et al, 2013; Nolan et al, 2014). Overexpression of miR‐29 family members induces premature maturation of sympathetic neurons (Kole et al, 2011), and knock‐down of miR‐29 family members modifies age‐related phenotypes in fish brain (Ripa et al, 2017) and heart (Heid et al, 2017). In the visual cortex, miR‐29a is the most upregulated miRNA during CP with a 30‐fold increase between P10 and P120. In addition, more than half of miR‐29‐predicted targets are downregulated with age, including key regulators of plasticity, suggesting that miR‐29a acts as a central hub to coordinate expression of apparently unrelated downstream pathways that remodel the epigenetic landscape and the composition of the extracellular matrix. Indeed, we showed that experimental modulations of miR‐29a action mimicking adult or juvenile levels of miR‐29a induce corresponding heterochronic levels of OD plasticity. Premature increase in miR‐29a levels in young mice blocked juvenile OD plasticity, while miR‐29a inhibition in adult animals reversed developmental downregulation of miR‐29a targets and induced a form of OD plasticity endowed with the typical physiological and proteomic signature of CP plasticity.
To characterize the global molecular correlates of miR‐29a action on OD plasticity, we performed transcriptomic and proteomic analyses after amiR‐29a treatment in adult mice. The results showed a remarkable convergence of miR‐29a action on plasticity brakes controlling plasticity levels by acting on different cell functions and compartments. For example, previous work showed that OD plasticity can be promoted in the visual cortex by inhibiting epigenetic enzymes decreasing histone acetylation such as HDACs, or activating DNA methylation regulatory pathways involving Gadd45b/g and Tets (Putignano et al, 2007; Silingardi et al, 2010; Apulei et al, 2019). Importantly, the results of these interventions restore the malleable epigenetic control of chromatin typical of juvenile animals (Putignano et al, 2007; Tognini et al, 2015; Baroncelli et al, 2016; Vierci et al, 2016; Stroud et al, 2017). Our analysis reveals that miR‐29a controls the levels of several plasticity‐related epigenetic enzymes. Indeed, miR‐29a levels are tightly correlated with Dnmt3a and that the manipulation of miR‐29a levels dramatically affects Dnmt3a; Tet1, Tet2, Tet3, and Gadd45a and Gadd45b. Moreover, antagonization of miR‐29a also resulted in induction of Arc, a gene capable of activating OD plasticity in the adult (McCurry et al, 2010; Jenks et al, 2017), and other plasticity factors such as Egr‐1 and Egr‐2, Arpc3, Grin2b, Nr4a1, and Nr4a2 (Knapska & Kaczmarek, 2004; Lippi et al, 2011; Chen et al, 2014; Mo et al, 2015). Furthermore, our work shows that miR‐29a level is a critical determinant of PNN maturation, another important plasticity brake in the visual cortex (Pizzorusso et al, 2002, 2006; Carulli et al, 2010; Lensjø et al, 2017; Rowlands et al, 2018), and in other brain areas (Fawcett et al, 2019; Reichelt et al, 2019). PNNs are specialized extracellular matrix structures predominantly associated with PV+ interneurons in the visual cortex. They have essentially two structural roles: acting as scaffold for plasticity by regulating the binding of molecules such as Otx2 (Beurdeley et al, 2012; Spatazza et al, 2013) and Sema3a (Boggio et al, 2019), and limiting new synaptic connections (Faini et al, 2018). Adult mice treated with amiR‐29a strongly upregulate extracellular matrix remodelers like MMP2, MMP13, and MMP9 and reduce PNN intensity and density, while young animals treated with miR‐29a mimic display a premature increase in PNN intensity. Mir‐29a also regulated the age‐related changes in chemical composition of PNNs. Downregulation of miR‐29a in adult mice caused a reduction in sulfonation of chondroitin sulfate in position 4 (C4S), a chemical modification of CSPGs typically enriched in adult brain and associated with reduced axon growth, regeneration, and OD plasticity in the visual cortex (Miyata et al, 2012; Foscarin et al, 2017; Yang et al, 2017). This decrease is accompanied by upregulation of ArsB (Bhattacharyya et al, 2015), the enzyme responsible for removal of sulfate groups from C4S. Extracellular matrix modulation could also affect excitatory cells; indeed, extracellular proteolytic activity is involved in regulating dendritic spine dynamics (Mataga et al, 2004; Oray et al, 2004; Spolidoro et al, 2012). These data indicate that miR‐29a modulation of extracellular matrix could be involved in miR‐29a regulatory action on plasticity; however, further work clarifying the causal relationship between the PNN alterations induced by miR‐29a/amiR‐29a and OD plasticity is needed. Overall, these data indicate that miR‐29a coordinates the age‐dependent regulation of several molecular pathways regulating CP plasticity.
Importantly, miR‐29a expression is not regulated by visual experience, suggesting that miR‐29a is a specific mediator of the action of age on CP timing. Thus, its action must be integrated with experience‐dependent signals unrelated to miR‐29a, such as NARP and BDNF (Huang et al, 1999; Gu et al, 2013), to achieve input specific plasticity and experience‐dependent regulation of CP. Mir‐29a could act on CP timing also by interacting with circadian clock mechanisms. Indeed previous work showed that clock mutation in PV cells causes an altered CP (Kobayashi et al, 2015), and miR‐29a has been shown to affect circadian rhythmicity period through regulation of Per1 and Per2 mRNA stability and translation (Chen et al, 2013). In support of this hypothesis, Per1 was also strongly upregulated by amiR‐29a in our dataset.
Although mir‐29a is broadly expressed in different cell types in the visual cortex, several data indicate that the effects miR29a on OD plasticity could involve PV cells. Our in situ hybridization and previous expression profiling data obtained with Ago‐CLIP (He et al, 2012) showed that PV cells express high levels of miR‐29a. Furthermore, the time course of cortical miR‐29a expression is correlated with the maturation of WFA‐positive PNNs enwrapping PV cells, while increasing or antagonizing miR‐29a correspondingly modulated PV cell PNNs. PV levels were also downregulated by miR‐29a antagonization in adult animals, and bioinformatic analysis of proteomic data showed that PV cells represent the most affected cell population in terms of protein downregulation after amiR‐29a treatment. Thus, PV cells could be a relevant cellular target for miR‐29a action on CP timing, although further experiments are necessary to fully clarify this point.
The observation that miR29a is a remodeler of PNNs opens novel and exciting therapeutic perspective for miR‐29a and other miR‐29 family members. Indeed, manipulations of PNNs, both PNN increase and decrease depending on the type of pathological condition, have been proposed as possible therapy for several diseases including schizophrenia, autism, genetic encephalopathies, addiction, and seizures (Krishnan et al, 2015; Pantazopoulos & Berretta, 2016; Sorg et al, 2016; Wen et al, 2018a,b). For example, preclinical studies and the analysis of human post‐mortem samples of schizophrenic patients showing reductions in aggrecan and WFA staining suggested that PNN alterations could be a key component of the pathophysiology of psychiatric disorders (Pantazopoulos et al, 2010, 2015). On the other hand, several works have demonstrated that the reduction in PNNs can be used to promote plasticity during aging and recovery from brain lesions (Hill et al, 2012; Soleman et al, 2012; Gherardini et al, 2015; Wiersma et al, 2017; Fawcett et al, 2019). Moreover, the miR‐29 family is acutely neuroprotective in stroke models (Khanna et al, 2013; Ouyang et al, 2013; Kobayashi et al, 2019), and it has been found to be downregulated in human post‐mortem samples of Alzheimer disease, Huntington disease, bipolar disorders, and schizophrenia (Hebert et al, 2008; Johnson et al, 2008; Geaghan & Cairns, 2015). Thus, considering that antimiRs and miRNA mimics are under clinical trials for different human pathologies (Rupaimoole & Slack, 2017), modulation of miR‐29 family levels could represent a novel and concrete strategy for treating a variety of brain diseases.
Materials and Methods
Animals
Mice used in all the experiments were of the C57BL/6J strain. Animals were maintained at 22°C under a 12‐h light–dark cycle (average illumination levels of 1.2 cd/m2) and housed in standard cages according to current regulations about animal welfare. Food (4RF25 GLP Certificate, Mucedola) and water were available ad libitum. All experiments were carried out in accordance with the European Directive of 22 September 2010 (EU/63/2010) and were approved by the Italian Ministry of Health. All tissue explants were performed at the same time of the day (10–12 am).
Light manipulation
Mice were either born and raised in darkness or they were transferred to a dark room at P10 (before eye opening). At P25, they were sacrificed; the procedure was carried out with the use of infrared binoculars and eyes covered with black tape. P25 normally reared were used as controls. To test the effects of one week of darkness experiments, mice were transferred at P29 in a dark room for a week. After this period, a group (0 h) was sacrificed in the dark as previously described and another group (4 h) was sacrificed after 4 h of re‐exposure to light. Controls were P36 mice that were always kept under a 12‐h dark‐to‐light cycle. Visual cortices were taken and processed to perform molecular analyses.
Monocular deprivation
P25 or P120 mice were anesthetized with isoflurane (Forane, 3%). Monocular deprivation was then accomplished by eyelid suture of the right eye. In the days following the procedure, mice were kept in a controlled environment and checked daily to ensure that the lids remained closed. For molecular analyses, right and left cortices of each animal were processed separately.
Stereotaxic injections
Mice were anesthetized with isoflurane (Forane, 3%) and fixed on a stereotaxic support through the use of metal bars in the ears. The skin was removed, and perforations were produced in the skull using a surgical drill around binocular visual cortex area. A glass microcapillary (100‐μm tip), was inserted into the cortex to inject miR‐29a mimic and antagonist or scrambled sequences. Injections were performed at three sites surrounding the binocular visual cortex identified by previous IOS imaging of visual responses. The skin was subsequently sutured, and physiological solution was injected subcutaneously to prevent dehydration. Moreover, paracetamol was administered in water ad libitum for two days.
Immunohistochemistry
Mice were anesthetized with chloral hydrate (1 ml/50 g) and perfused via intracardiac infusion with PBS and then 4% paraformaldehyde (PFA, wt/vol, dissolved in 0.1 M phosphate buffer, pH 7.4). Brains were quickly removed and post‐fixed overnight in PFA, then transferred to 30% sucrose (wt/vol), 0.05% sodium azide (wt/vol) solution, and finally stored at 4°C. 45‐μm coronal sections were cut on a freezing microtome (Leica), and free‐floating sections were processed for immunohistochemistry. Slices of visual cortex were pre‐incubated 2 h at RT in blocking solution of 3% bovine serum albumin (BSA) in PSB and incubated O/N at 4°C with a PBS solution of Fluorescein Wisteria floribunda lectin (Biotinylated Wisteria floribunda lectin, Vector Laboratories, 1:400). Then, slides were rinsed three times in PBS (10 min each) at RT and incubated for 2 h 30 min with a PBS solution of fluorescent streptavidin (Streptavidin Alexa Fluor 488 conjugate, Thermo Fisher Scientific, 1:400). Finally, slides were rinsed three times with PBS and used for parvalbumin staining. A pre‐incubation in a blocking solution of 3% BSA plus 0.2% of Triton in PBS was done at RT for 2 h. Slices were incubated O/N at 4°C in the primary antibody solution of anti‐parvalbumin (Swant, cat. no. 235, 1:300). Slices were then rinsed three times in PBS (10 min each) and incubated with a secondary antibody (Alexa Fluor 555 conjugate, Thermo Fisher Scientific, 1:400) for 2 h 30 min at RT. Slices were then rinsed three times in PBS (10 min each), coverslipped in mounting medium (VECTASHIELD® antifade mounting medium, Vector Laboratories, cat.no. H‐100), and stored at 4°C until acquisition section.
In situ hybridization
Mice were perfused, and slides were produced as previously described for immunostaining protocol. Then, in situ hybridization was performed using the following protocol:
1st day: Free‐floating sections were washed with PBS 0.1% Tween‐20 (PBT) tree times for 5 min and treated with 1:20,000 proteinase K (20 mg/ml) in PBT for 10 min at RT. The reaction was blocked by washing two times with glycine 2 mg/ml in PBT at RT. Slices were re‐fixed with 4% paraformaldehyde for 20 min at RT and washed three times in PBT. Slices were prehybridized 30 min at 48°C in hybridization buffer [HB, 50% formamide (Sigma, cat.no. F9037), 5× SSC (20× SSC: 3 M NaCl, 0.3 M trisodium citrate in H2O), 0.1% Tween‐20, 50 ug/ml Heparin (Sigma, cat.no. H3393), 500 ug/ml torula yeast RNA]. Sections were hybridized at 37°C overnight (O/N) with 80 nM of LNA probe to miR‐29a (mmu‐miR-29a‐3p, Qiagen, cat.no. 339111YD00616795‐BCF)
2nd day: Slices were washed twice with 2× SSC and once with 0.2× SSC at RT for 10 min and blocked 30 min at RT in blocking solution [1% blocking reagent (Roche, cat.no. 11096176001), 1% sheep serum in MABT (100 mM maleic acid, 150 mM NaCl at pH 7.5, 0.1% Tween‐20]. Sections were incubated with Anti‐Dig-AP Fab fragments Ab 1:2000 (Roche, cat.no. 11093274910) in blocking solution O/N at 4°C.
3rd day: Slices were washed three times with PBT (15 min) and three times with NMNT (100 mM NaCl, 100 mM Tris–HCl pH 9.5, 50 mM MgCl2, 0.1% Tween‐20, 2 mM tetramisole). Sections were incubated NBT/BCIP (1 tablet in 10 ml dH2O, Roche cat.no.11697471001), and the staining reaction was controlled every 10 min. The same slides were used for immunostaining against parvalbumin and a neuronal marker. After three washes on PBT, slides were directly incubated O/N 4°C in a primary antibody solution anti‐parvalbumin (synaptic system, cat.no. 195 004, 1:250) and anti‐NeuN (cell signaling, cat.no. 94403S, 1:300) with 1.5% BSA in PBS + 0.2% Triton.
4th day: Slides were washed three times in PBT and incubated for 2 h 30 min at RT with secondary antibody solution [anti‐mouse Alexa Fluor 488 (1:400) and anti‐pig Alexa Fluor 546 (1:400) with BSA 1.5% in PBT]. Finally, slides were washed in PBT and mounted using a medium with DAPI (Vector Laboratories, VECTASHIELD® Antifade Mounting Medium with DAPI, cat.no. H‐1200).
Image acquisition
Images from the visual cortex were acquired with an ApoTome.2 microscope (Zeiss, Oberkochen, Germany). Treated cortices were recognized by a tissue incision. Three z‐stack sections per slide and at least five slides per animal were obtained with a 20× objective. Laser intensity and exposure time were calculated by a pre‐acquisition section and were the same for all acquisitions. Then, a weak Fourier filter was applied, and then, the “Maximum projection” function was used to obtain a single image per stack. The number of positive PNNs and PV was counted using ImageJ, and a MATLAB script was elaborated to analyze density and intensity. A small (60 × 60 px) image of each cell has been extracted. Pixels belonging to the PNN have been selected with Otsu's binarization method. PNN intensity was defined as the average of the intensity values of all the pixels belonging to a PNN. The intensity value of every PNN of the treated hemisphere was normalized to the average PNN intensity of the same animal and same slice on the untreated hemisphere. For every field, a cell density (PNN/mm2) was calculated and the value was normalized to the average PNN density of the same animal and same slice on untreated hemisphere. To calculate PNN distribution in classes, the distribution of normalized values of intensity of all the left hemisphere PNNs was divided into three equal parts was assigned the labels of faint, medium, and strong PNNs. The number of cells belonging to each class was pooled across all the animals for each treatment, and statistical analyses were performed. The same approach was used to quantify miR29a in situ hybridization experiments.
RNA extraction and quantification (qPCR)
Tissue samples were homogenized in cell disruption buffer (Ambion). RNA was extracted by the addiction of Phenol/guanidine‐based QIAzol Lysis Reagent (Qiagen, cat. no. 79306). Chloroform was added, and the samples were shacked for 15 s. The samples were left at 20–24°C for 3 min and then centrifuged (12,000 g, 20 min, 4°C). The upper phase aqueous solution, containing RNA, was collected in a fresh tube, and the RNA was precipitated by the addiction of isopropanol. Samples were mixed by vortexing, left at 20–24°C for 15 min and then centrifuged (12,000 g, 20 min, 4°C). Supernatant was discarded, and the RNA pellet was washed in 75% ethanol by centrifugation (7500 g, 10 min, 4°C). Supernatant was discarded, and the pellet was left to dry for at least 15 min; then, it was resuspended in RNAse‐free water. Total RNA concentrations were determined by NanoDrop Spectrophotometer (Thermo Scientific 2000 C). RNA quality was analyzed through a gel running (1% agarose). Total RNA was reverse transcribed using the QuantiTeck Reverse Transcription Kit (Qiagen, cat. no. 205311), and miRNAs were reverse transcribed using TaqMan MicroRNA reverse transcription kit (Thermo Fisher, cat. no. 4366596). Gene expression was analyzed by real‐time PCR (Step one, Applied Biosystems). TaqMan inventoried assays were used for miR‐29a‐3p (assay ID: 002112), sno234 (assay ID:001234), Dnmt3a (Mm00432881_m1), Npas4 (Mm012207866_g1), Bdnf exIV (Mm00432069_m1), Gadd45a (Mm00532802_m1), Gadd45b (Mm00435121_g1), Tet3 (Mm 00805756_m1), Mmp2 (Mm00439498_m1), Mmp9 (Mm00442991_m1), and Mmp13 (Mm00439491_m1). TaqMan assay was used for glyceraldehyde 3‐phosphate dehydrogenase (Gapdh), GAPDH probe ATCCCAGAGCTGAACGG, GADPH forward CAAGGCTGTGGGCAAGGT, and GADPH reverse GGCCATGCCAGTGAGCTT. Quantitative values for cDNA amplification were calculated from the threshold cycle number (Ct) obtained during the exponential growth of the PCR products. Threshold was set automatically by the Step one software. Data were analyzed by the ΔΔCt methods using GAPDH or SNO234 to normalize the cDNA levels of the transcripts under investigation.
Western blotting
Visual cortices were collected and frozen on dry ice. The tissue samples were homogenized in cell disruption buffer (Ambion) and spun down for 5 min at 14,000 g at 4°C, and the supernatant was recovered. Protein concentration was determined by Bradford assay (Bio‐Rad). For the running, each sample was boiled and 40 μg of protein extracts were loaded in each lane of a 4–12% acrylamide gels, using the Precast gel System (Bio‐Rad). The samples were blotted onto nitrocellulose membrane (Bio‐Rad) using Tans‐Turbo Blot (Transfer system) apparatus (Bio‐Rad), washed four times in phosphate‐buffered saline (PBS) with 0.1% Tween‐20, and blocked for 2 h at room temperature (RT) using Blocking Odyssey Solution (LI‐COR 927‐40000). Then, the nitrocellulose membrane was incubated with the antibodies to DNMT3a (Abcam, cat. no. ab13888; 1:300), ARSB (Thermo Fisher, cat.no. MA524327, 1:500), and beta‐tubulin (Sigma‐Aldrich, cat. no. T4026, 1:3,000). Antibodies were diluted in Blocking Odyssey Solution and PSB (1:1) with 0.2% Tween‐20 and incubated overnight (O/N) at 4°C. Blots were than washed three times in PBS 0.1% Tween‐20 and incubated with, respectively, IRDye 800CW and IRDye 680RD secondary antibodies diluted in Blocking Odyssey Solution and PSB (1:1) with 0.2% Tween‐20 and 0.01% SDS for 2 h at RT (1:20,000). Finally, blots were washed for four times in PBS with 0.1% Tween‐20 and one time with PBS only. Acquisitions were done using Odyssey LI‐COR machinery.
RNA‐seq
Total RNA is extracted, prepared, and sequenced on Illumina HiSeq instrument during a pair‐end read 125 bp sequencing, producing sequencing result in FastQ format. The FastQ files are processed through the standard Tuxedo protocol [ref1], outputting the FPKM values for each gene of each replicate. The differential analysis of the FPKM values across all experiment and control groups is conducted with Cyber‐T, a differential analysis program using Bayesian‐regularized t‐test (Baldi & Long, 2001; Kayala & Baldi, 2012). The P‐value threshold used for determining differential expression is 0.05 for all groups.
Sample preparation for proteome analysis
Binocular visual cortices were collected and snap‐frozen in liquid nitrogen. On preparation for MS, protein amount was estimated based on fresh tissue weight (assuming 5% of protein w/w) and lysis buffer (4% SDS, 100 mM HEPES, pH 8, 1 mM EDTA, 100 mM DTT) was added accordingly to a final concentration of 1 μg/μl. Samples were then vortexed (5 times) prior to sonication (Bioruptor Plus, Diagenode) for 10 cycles (30 s ON/60 s OFF) at high setting, at 4°C. The samples were then centrifuged at 3,000 g for 5 min at room temperature, and the supernatant transferred to 2‐ml Eppendorf tubes. Reduction (15 min, 45°C) was followed by alkylation with 20 mM iodoacetamide (IAA) for 30 min at room temperature in the dark. Protein amounts were confirmed, following an SDS–PAGE gel of 4% of each sample against an in‐house cell lysate of known quantity. 100 μg protein of each sample was taken along for digestion. Proteins were precipitated overnight at 20°C after addition of a 4× volume (400 μl) of ice‐cold acetone. The following day, the samples were centrifuged at 20,800 g for 30 min at 4°C and the supernatant carefully removed. Pellets were washed twice with 500 μl ice‐cold 80% (v/v) acetone in water then centrifuged at 20,800 g at 4°C. They were then allowed to air‐dry before addition of 50 μl of digestion buffer (3M Urea, 100 mM HEPES, pH 8). Samples were resuspended with sonication (as above), LysC (Wako) was added at 1:100 (w/w) enzyme:protein and digestion proceeded for 4 h at 37°C with shaking (1,000 rpm for 1 h, then 650 rpm). Samples were then diluted 1:1 with Milli‐Q water and trypsin (Promega) added at the same enzyme to protein ratio. Samples were further digested overnight at 37°C with shaking (650 rpm). The following day, digests were acidified by the addition of TFA to a final concentration of 2% (v/v) and then desalted with Waters Oasis® HLB μElution Plate 30 μm (Waters Corporation, Milford, MA, USA) in the presence of a slow vacuum. In this process, the columns were conditioned with 3 × 100 μl solvent B (80% (v/v) acetonitrile; 0.05% (v/v) formic acid) and equilibrated with 3 × 100 μl solvent A (0.05% (v/v) formic acid in Milli‐Q water). The samples were loaded, washed three times with 100 μl solvent A, and then eluted into 0.2‐ml PCR tubes with 50 μl solvent B. The eluates were dried down with the speed vacuum centrifuge and dissolved at a concentration of 1 μg/μl in reconstitution buffer (5% (v/v) acetonitrile, 0.1% (v/v) formic acid in Milli‐Q water). For data‐independent analysis (DIA), peptides were spiked with retention time iRT kit (Biognosys AG, Schlieren, Switzerland) prior to analysis by LC‐MS/MS.
Data acquisition for label‐free analysis of monocular deprived young and adult treated with amiR29‐a animals
For experiments, 500 ng of peptides was separated using the nanoAcquity UPLC system (Waters) fitted with a trapping (nanoAcquity Symmetry C18, 5 μm, 180 μm × 20 mm) and an analytical column (nanoAcquity BEH C18, 1.7 μm, 75 μm × 250 mm). The outlet of the analytical column was coupled directly to an Orbitrap Fusion Lumos (Thermo Fisher Scientific) using the Proxeon nanospray source. Solvent A was water, 0.1% (v/v) formic acid, and solvent B was acetonitrile, 0.1% (v/v) formic acid. The samples (500 ng) were loaded with a constant flow of solvent A at 5 μl/min onto the trapping column. Trapping time was 6 min. Peptides were eluted via the analytical column with a constant flow of 0.3 μl/min. During the elution step, the percentage of solvent B increased in a linear fashion from 3% to 25% in 30 min, then increased to 32% in 5 more min and finally to 50% in a further 0.1 min. Total runtime was 60 min. The peptides were introduced into the mass spectrometer via a Pico‐Tip Emitter 360 μm OD × 20 μm ID; 10 μm tip (New Objective), and a spray voltage of 2.2 kV was applied. The capillary temperature was set at 300°C. The RF lens was set to 30%. Full‐scan MS spectra with mass range 375–1,500 m/z were acquired in profile mode in the Orbitrap with resolution of 120,000 FWHM. The filling time was set at maximum of 50 ms with limitation of 2 × 10⁵ ions. The “Top Speed” method was employed to take the maximum number of precursor ions (with an intensity threshold of 5 × 10³) from the full‐scan MS for fragmentation (using HCD collision energy, 30%) and quadrupole isolation (1.4 Da window) and measurement in the ion trap, with a cycle time of 3 s. The MIPS (monoisotopic precursor selection) peptide algorithm was employed but with relaxed restrictions when too few precursors meeting the criteria were found. The fragmentation was performed after accumulation of 2 × 10³ ions or after filling time of 300 ms for each precursor ion (whichever occurred first). MS/MS data were acquired in centroid mode, with the Rapid scan rate and a fixed first mass of 120 m/z. Only multiply charged (2 + ‐ 7 +) precursor ions were selected for MS/MS. Dynamic exclusion was employed with maximum retention period of 60s and relative mass window of 10 ppm. Isotopes were excluded. Additionally only 1 data‐dependent scan was performed per precursor (only the most intense charge state selected). Ions were injected for all available parallelizable time. In order to improve the mass accuracy, a lock mass correction using a background ion (m/z 445.12003) was applied. For data acquisition and processing of the raw data, Xcalibur 4.0 (Thermo Scientific) and Tune version 2.1 were employed.
Data‐independent acquisition for adult animals treated with amiR‐29a
Peptides were separated using the nanoAcquity UPLC system (Waters) with a trapping (nanoAcquity Symmetry C18, 5 μm, 180 μm × 20 mm) and an analytical column (nanoAcquity BEH C18, 1.7 μm, 75 μm × 250 mm). The outlet of the column was coupled to a QEHFX (Thermo Fisher Scientific) using the Proxeon nanospray source. Solvent A was water, 0.1% FA, and solvent B was acetonitrile, 0.1% FA. Samples were loaded at constant flow of solvent A at 5 μl/min onto the trap for 6 min. Peptides were eluted via the analytical column at 0.3 μl/min and introduced via a Pico‐Tip Emitter 360 μm OD × 20 μm ID; 10 μm tip (New Objective). A spray voltage of 2.2 kV was used. During the elution step, the percentage of solvent B increased in a non‐linear fashion from 0% to 40% in 120 min. The capillary temperature was set at 300°C. The RF lens was set to 40%. Data from a subset of samples were acquired in DDA in order to create a spectral library. MS conditions were as follows: Full‐scan spectra (350–1,650 m/z) were acquired in profile mode in the Orbitrap with resolution of 60,000. The fill time was set to 50 ms with limitation of 2 × 10⁵ ions. The “TopN = 15” method was employed to take the precursor ions (with an intensity threshold of 5 × 10⁴) from the full‐scan MS for fragmentation (using HCD collision energy, 30%) and quadrupole isolation (1.4 Da window) and measurement in the Orbitrap (resolution 15,000, fixed first mass 120 m/z), with a cycle time of 3 s. MS/MS data were acquired in profile mode (QEHFX). Only multiply charged precursor ions were selected. Dynamic exclusion was employed (15s and relative mass window of 10 ppm). Isotopes were excluded. For data acquisition and processing of the raw data, Xcalibur 4.0 (Thermo Scientific) and Tune version 2.9 were employed. For the DIA data acquisition, the same gradient conditions were applied to the LC as for the DDA and the MS conditions were varied as described: Full‐scan MS spectra with mass range 350–1,650 m/z were acquired in profile mode in the Orbitrap with resolution of 120,000. The filling time was set at maximum of 20 ms with limitation of 5 × 10⁵ ions. DIA scans were acquired with 34 mass window segments of differing widths across the MS1 mass range with a cycle time of 3 s. HCD fragmentation (30% NCE) was applied, and MS/MS spectra were acquired in the Orbitrap with a resolution of 30,000 over the mass range 200–2,000 m/z after accumulation of 2 × 10⁵ ions or after filling time of 70 ms (whichever occurred first). Ions were injected for all available parallelizable time. Data were acquired in profile mode.
Data analysis of label‐free analysis monocular deprived young and adult treated with amiR29‐a animals
The Andromeda search engine (Cox et al, 2011), part of MaxQuant (version 1.5.3.28; Cox & Mann, 2008), was used to search the data. The data were searched against a species‐specific (Mus musculus Swiss‐Prot) database and a list of common contaminants. The data were searched with the following modifications: carbamidomethyl (C) (fixed), and oxidation (M) and acetyl (protein N‐term; variable). The mass error tolerance for the full‐scan MS spectra was set at 20 ppm and for the MS/MS spectra at 0.5 Da. A maximum of two missed cleavages were allowed. Peptide and protein level 1% FDR were applied. LFQ (label‐free quantification) values from the MaxQuant output were used to perform differential protein expression analysis using scripts written in R (v3.4.1). After removal of reverse and contaminant hits, only protein groups quantified by at least two unique peptides were retained. Protein differential expression was evaluated using the limma package (Ritchie et al, 2015). Differences in protein abundances were statistically determined using Student's t‐test moderated by the empirical Bayes method. P values were adjusted for multiple testing using the Benjamini–Hochberg method (FDR, denoted as “q”).
DIA data analysis of adult animals treated with amiR‐29a
For library creation, the DDA and DIA data were searched using Pulsar in Spectronaut Professional+ (version 12.0.20491.0.21234, Biognosys AG, Schlieren, Switzerland). The data were searched against a species‐specific (Mus musculus Swiss‐Prot) database and a list of common contaminants. The data were searched with the following modifications: carbamidomethyl (C) (Fixed) and oxidation (M)/ acetyl (protein N‐term; variable). A maximum of two missed cleavages for trypsin were allowed. The identifications were filtered to satisfy FDR of 1% on peptide and protein level. The generated library contained 74,254 precursors, corresponding to 4,729 protein groups. Relative quantification was performed in Spectronaut for each pairwise comparison using the replicate samples from each condition. Precursor matching, protein inference, and quantification were performed in Spectronaut using default settings. The data (candidate table, SUP XX) were then exported, and further data analyses and visualization were performed with R‐studio using in‐house pipelines and scripts.
In vivo electrophysiology and Intrinsic optical imaging
For surgery, mice were sedated with isoflurane (Forane, 3%) followed by urethane (0.7 g /kg, i.p., at 20% w/v in ringer). Dexamethasone (Soldesam, 2 mg/kg) was administered subcutaneously to reduce secretions and edema. The animal was placed on a stereotaxic apparatus and maintained at 37.5 °C by a feedback‐controlled heating pad. The animal was also ventilated through an oxygen mask. During surgery, eyes were protected by applying a dexamethasone‐based ointment (Tobradex, tobramycin 0.3%, and dexamethasone 0.1%), then with a thin layer of silicon oil. Local anesthesia was obtained with a subcutaneous injection of lidocaine (Angelini). After exposing the skull, we performed a small craniotomy (2 mm in diameter) over the binocular visual cortex (2.8–3.3 mm lateral and 0.1 mm anterior to lambda) living dura mater intact. An electrode (2 × 2‐tet‐3 mm‐150‐150‐121‐A16‐15, NeuroNexus Technologies) was slowly lowered into the cortex to an appropriate depth to record local field potentials and single‐unit activity and was allowed to settle for 30–40 min before the beginning of recordings. The recording sites were located between layers III and V; therefore, the physiological data recorded mostly reflect the properties of these layers. At the end of the experiment, the animal was killed by overdose with of urethane. Signals were acquired using 4‐channel Neuralynx device, and data analysis was performed using a custom software written in MATLAB. Visual stimuli were generated in MATLAB using the Psychophysics Toolbox extension and displayed with gamma correction on a monitor (Sony Trinitron G500, 60 Hz refresh rate, 32 cd m−2 mean luminance) placed 20 cm from the mouse, subtending 60–75° of visual space. Local field potential—we measured the contralateral‐to‐ipsilateral ratio of VEPs to measure OD plasticity. Extracellular signal was filtered from 0.3 to 275 Hz and sampled at 30.3 kHz. VEPs in response to square wave patterns with a spatial frequency of 0.03 c/deg and abrupt phase inversion (1 Hz temporal period) were evaluated in the time domain by measuring the P1 peak‐to‐baseline amplitude and latency. We used computer controlled mechanical shutters to collect data from each eye, reducing possible effects due to changes in behavioral states, and adaptation. Intrinsic optical imaging recordings were performed under isoflurane anesthesia (0.5–1%) supplemented with an intraperitoneal injection of chlorprothixene hydrochloride (1.25 mg/kg). Images were obtained using an Olympus microscope (BX50WI). Red light illumination was provided by eight red LEDs (625 nm, Knight Lites KSB1385–1P) attached to the objective (Zeiss Plan‐NEOFLUAR 5x, NA: 0.16) using a custom‐made metal LED holder. The animal was secured under the objective using a ring‐shaped neodymium magnet mounted on an arduino‐based 3D printed imaging chamber that also controls eye shutters and a thermostated heating pad (30). Visual stimuli were generated using MATLAB Psychtoolbox and presented on a gamma corrected 9.7‐inch monitor, placed 10 cm away from the eyes of the mouse. Contrast reversing Gabor patches (temporal frequency: 4 Hz, duration: 1 s) were presented in the binocular portion of the visual field (−10° to +10° relative to the horizontal midline and −5° to +50° relative to the vertical midline) with a spatial frequency of 0.03 cycles per degree, mean luminance 20 cd/m2, and a contrast of 90%. Visual stimulation was time locked with a 16 bit depth acquisition camera (Hamamatsu digital camera C11440) using a parallel port trigger. Interstimulus time was 14 s. Frames were acquired at 30 fps with a resolution of 512 × 512 pixels, low‐pass filtered with a 2D average spatial filter (30 pixels, 117 μm2 square kernel) and downsampled to 128 × 128 pixels. The signal was averaged for at least eight groups of 20 trials and downsampled to 10 fps. The stimulated eye was alternated using eye shutters between groups of trials in order to prevent biases due to fluctuating levels of anesthesia for the contralateral and ipsilateral eye. Fluctuations of reflectance (R) for each pixel were computed as the normalized difference from the average baseline (ΔR/R). For each recording, an image representing the mean evoked response was computed by averaging frames between 0.5 and 2.5 s after stimulation. A region of interest (ROI) was automatically calculated on the mean image of the response, by selecting pixels in the lowest 30% ΔR/R of the range between the maximal and minimal intensity value. Mean evoked responses were quantitatively measured as the average intensity inside the ROI. To weaken background fluctuations, a manually selected polygonal region of reference (ROR) was subtracted. The ROR was placed where no stimulus response, blood vessel artifact, or irregularities of the skull were observed.
Isolation of glycosaminoglycans (GAGs)
Procedures followed the work by Silpananta et al (1967) with slight modifications. The collected tissue samples were homogenized in cold extraction buffer (10 ul/mg of wet weight, buffer contains 4 M guanidinium hydrochloride in 0.05 M sodium acetate, pH 5.8 with protease inhibitors). Adjust the density of the homogenized samples with cesium chloride to 1.72 mg/ml. The mixture was then subjected to ultracentrifugation (120,000 g, 48 h, 4°C). The samples were then collected into five equal fractions. The fractions were dialyzed with 1× dialysis buffer (0.4 M guanidinium hydrochloride, 0.025 M sodium acetate, pH 5.8) overnight at 4°C. The negatively charged GAGs were precipitated by the addition of 0.1 volume of 5% (w/v) cetylpyridinium chloride (CPC) and kept at 4°C for 2 h. The samples were then centrifuged at 4,500 rpm for 30 min. Dissolved the pellet in 100 μl if deionized water and stored at −20°C. The amount of GAGs was quantified by CPC turbidimetry.
Chondroitinase ABC (ChABC) treatment and disaccharide conjugation
The isolated GAG was treated with ChABC to cleave the long GAG chains into disaccharide units. 5 μg of samples was digested with 100 mU of ChABC in 100 mM NH4Ac buffer, pH 7.0 for 16 h at 37°C. Following the enzyme treatment, the digested disaccharides were recovered from the supernatant after ethanol precipitation for 16 h at 4°C and centrifugation. The supernatant was dried in a 50°C oven for 16 h. For disaccharide derivatization, 10 μl of 12.5 mM 2‐aminoacridone (AMAC; dissolved in 3:17 acetic acid/DMSO) was used to dissolve the dried disaccharide preparations, and then, 10 μl of 1.25 M sodium cyanoborohydride was then added. For standard disaccharides, 5 μg of each disaccharide was used for the derivatization. The sample mixtures were incubated in dark for 16 h at 37°C. 10 μl of 30% glycerol was added to the samples, and the derivatized disaccharides were kept at −20°C.
Fluorophore‐assisted carbohydrate electrophoresis (FACE)
A mini‐gel of 40% polyacrylamide was prepared in Tris borate buffer (0.1 M Tris buffer titrated with boric acid to pH 8.3). 10 μl of AMAC‐tagged disaccharides was diluted with 10 μl of FACE solvent (2:1:7 DMSO:glycerol:water) before loading into the gel. For the standard disaccharides, 1:8 dilution with the FACE solvent was necessary. The gel was electrophoresed at a constant voltage of 1,000 V for about 110 min, with 4°C cooling water bath to prevent overheating. The gel was illuminated with UV light and visualized at 405 nm in a UVP Bioimaging System. Integrated densities (ID) of the bands were measured by the software ImageJ. Standard curve was set up by measuring the ID of the disaccharide standards, and the amount of individual sulphated disaccharides was thus calculated. Results are presented as ng of C4S per μg of isolated GAGs.
Author contributions
AC, DN, and TP conceptualized the study; AC, JCFK, TP, LL, RM, GS, and PB contributed to methodology; DN, EP, LL, GS, EKS, JK, PT, ETT, PB, SB, and JCFK investigated the study; DN, AC, and TP wrote—original draft; AC, JCFK, PB, and TP involved in funding acquisition; AC, TP, and PB contributed to resources; MS, SC, PB, and AC curated the data; AC, PB, and TP supervised the study.
Conflict of interest
The authors declare that they have no conflict of interest.
Supporting information
Appendix
Expanded View Figures PDF
Dataset EV1
Dataset EV2
Dataset EV3
Dataset EV4
Dataset EV5
Dataset EV6
Dataset EV7
Dataset EV8
Review Process File
Acknowledgements
We thank Enrica Strettoi for help with microscopy, and Christophe Magnan, Laura Baroncelli, Francesco Calugi, Sara Cornuti, Elena Novelli, and Aurelia Viglione for discussions about data analysis and experimental protocols. Funding was provided by EPIGEN flagship project and PRIN 2017HMH8FA project.
EMBO Reports (2020) 21: e50431
Data availability
The datasets produced in this study are available in the following databases:
RNA‐seq data: Gene Expression Omnibus GSE141734 (https://www.ncbi.nlm.nih.gov/geo/query/acc.cgi?acc=GSE141734)
Proteomic data: ProteomeXchange Consortium via the PRIDE partner repository PXD016430 (http://proteomecentral.proteomexchange.org/cgi/GetDataset?ID=PXD016430) and PXD016358 (http://proteomecentral.proteomexchange.org/cgi/GetDataset?ID=PXD016358)
References
- Amodio N, Rossi M, Raimondi L, Pitari MR, Botta C, Tagliaferri P, Tassone P (2015) miR‐29s: a family of epi‐miRNAs with therapeutic implications in hematologic malignancies. Oncotarget 6: 12837–12861 [DOI] [PMC free article] [PubMed] [Google Scholar]
- Apulei J, Kim N, Testa D, Ribot J, Morizet D, Bernard C, Jourdren L, Blugeon C, Di Nardo AA, Prochiantz A (2019) Non‐cell autonomous OTX2 homeoprotein regulates visual cortex plasticity through Gadd45b/g. Cereb Cortex 29: 2384–2395 [DOI] [PubMed] [Google Scholar]
- Baldi P, Long AD (2001) A Bayesian framework for the analysis of microarray expression data: regularized t‐test and statistical inferences of gene changes. Bioinformatics 17: 509–519 [DOI] [PubMed] [Google Scholar]
- Baroncelli L, Scali M, Sansevero G, Olimpico F, Manno I, Costa M, Sale A (2016) Experience affects critical period plasticity in the visual cortex through an epigenetic regulation of histone post‐translational modifications. J Neurosci 36: 3430–3440 [DOI] [PMC free article] [PubMed] [Google Scholar]
- Bartel DP (2018) Metazoan microRNAs. Cell 173: 20–51 [DOI] [PMC free article] [PubMed] [Google Scholar]
- Baumgart M, Groth M, Priebe S, Appelt J, Guthke R, Platzer M, Cellerino A (2012) Age‐dependent regulation of tumor‐related microRNAs in the brain of the annual fish Nothobranchius furzeri . Mech Ageing Dev 133: 226–233 [DOI] [PubMed] [Google Scholar]
- Beurdeley M, Spatazza J, Lee HHC, Sugiyama S, Bernard C, Di Nardo AA, Hensch TK, Prochiantz A (2012) Otx2 binding to perineuronal nets persistently regulates plasticity in the mature visual cortex. J Neurosci 32: 9429–9437 [DOI] [PMC free article] [PubMed] [Google Scholar]
- Bhattacharyya S, Zhang X, Feferman L, Johnson D, Tortella FC, Guizzetti M, Tobacman JK (2015) Decline in arylsulfatase B and Increase in chondroitin 4‐sulfotransferase combine to increase chondroitin 4‐sulfate in traumatic brain injury. J Neurochem 134: 728–739 [DOI] [PMC free article] [PubMed] [Google Scholar]
- Boggio EM, Ehlert EM, Lupori L, Moloney EB, De Winter F, Vander Kooi CW, Baroncelli L, Mecollari V, Blits B, Fawcett JW et al (2019) Inhibition of semaphorin 3A promotes ocular dominance plasticity in the adult rat visual cortex. Mol Neurobiol 56: 5987–5997 [DOI] [PubMed] [Google Scholar]
- Braasch DA, Corey DR (2001) Locked nucleic acid (LNA): fine‐tuning the recognition of DNA and RNA. Chem Biol 8: 1–7 [DOI] [PubMed] [Google Scholar]
- Carulli D, Pizzorusso T, Kwok JCF, Putignano E, Poli A, Forostyak S, Andrews MR, Deepa SS, Glant TT, Fawcett JW (2010) Animals lacking link protein have attenuated perineuronal nets and persistent plasticity. Brain 133: 2331–2347 [DOI] [PubMed] [Google Scholar]
- Chen R, D'Alessandro M, Lee C (2013) miRNAs are required for generating a time delay critical for the circadian oscillator. Curr Biol 23: 1959–1968 [DOI] [PMC free article] [PubMed] [Google Scholar]
- Chen Y, Wang Y, Ertürk A, Kallop D, Jiang Z, Weimer RM, Kaminker J, Sheng M (2014) Activity‐induced Nr4a1 regulates spine density and distribution pattern of excitatory synapses in pyramidal neurons. Neuron 83: 431–443 [DOI] [PubMed] [Google Scholar]
- Cox J, Mann M (2008) MaxQuant enables high peptide identification rates, individualized p.p.b.‐range mass accuracies and proteome‐wide protein quantification. Nat Biotechnol 26: 1367–1372 [DOI] [PubMed] [Google Scholar]
- Cox J, Neuhauser N, Michalski A, Scheltema RA, Olsen JV, Mann M (2011) Andromeda: a peptide search engine integrated into the MaxQuant environment. J Proteome Res 10: 1794–1805 [DOI] [PubMed] [Google Scholar]
- Eden E, Navon R, Steinfeld I, Lipson D, Yakhini Z (2009) GOrilla: a tool for discovery and visualization of enriched GO terms in ranked gene lists. BMC Bioinformatics 10: 48 [DOI] [PMC free article] [PubMed] [Google Scholar]
- Espinosa JS, Stryker MP (2012) Development and plasticity of the primary visual cortex. Neuron 75: 230–249 [DOI] [PMC free article] [PubMed] [Google Scholar]
- Fabbri M, Garzon R, Cimmino A, Liu Z, Zanesi N, Callegari E, Liu S, Alder H, Costinean S, Fernandez‐Cymering C et al (2007) MicroRNA‐29 family reverts aberrant methylation in lung cancer by targeting DNA methyltransferases 3A and 3B. Proc Natl Acad Sci USA 104: 15805–15810 [DOI] [PMC free article] [PubMed] [Google Scholar]
- Faini G, Aguirre A, Landi S, Lamers D, Pizzorusso T, Ratto GM, Deleuze C, Bacci A (2018) Perineuronal nets control visual input via thalamic recruitment of cortical PV interneurons. eLife 7: e41520 [DOI] [PMC free article] [PubMed] [Google Scholar]
- Fawcett JW, Oohashi T, Pizzorusso T (2019) The roles of perineuronal nets and the perinodal extracellular matrix in neuronal function. Nat Rev Neurosci 20: 451–465 [DOI] [PubMed] [Google Scholar]
- Fenn AM, Smith KM, Lovett‐Racke AE, Guerau‐de-Arellano M, Whitacre CC, Godbout JP (2013) Increased micro‐RNA 29b in the aged brain correlates with the reduction of insulin‐like growth factor‐1 and fractalkine ligand. Neurobiol Aging 34: 2748–2758 [DOI] [PMC free article] [PubMed] [Google Scholar]
- Foscarin S, Raha‐Chowdhury R, Fawcett JW, Kwok JCF (2017) Brain ageing changes proteoglycan sulfation, rendering perineuronal nets more inhibitory. Aging 9: 1607–1622 [DOI] [PMC free article] [PubMed] [Google Scholar]
- Frenkel MY, Bear MF (2004) How monocular deprivation shifts ocular dominance in visual cortex of young mice. Neuron 44: 917–923 [DOI] [PubMed] [Google Scholar]
- Gao M, Sossa K, Song L, Errington L, Cummings L, Hwang H, Kuhl D, Worley P, Lee HK (2010) A specific requirement of Arc/Arg3.1 for visual experience‐induced homeostatic synaptic plasticity in mouse primary visual cortex. J Neurosci 30: 7168–7178 [DOI] [PMC free article] [PubMed] [Google Scholar]
- Geaghan M, Cairns MJ (2015) MicroRNA and posttranscriptional dysregulation in psychiatry. Biol Psychiatry 78: 231–239 [DOI] [PubMed] [Google Scholar]
- Gherardini L, Gennaro M, Pizzorusso T (2015) Perilesional treatment with chondroitinase ABC and motor training promote functional recovery after stroke in rats. Cereb Cortex 25: 202–212 [DOI] [PubMed] [Google Scholar]
- Gu Y, Huang S, Chang MC, Worley P, Kirkwood A, Quinlan EM (2013) Obligatory role for the immediate early gene NARP in critical period plasticity. Neuron 79: 335–346 [DOI] [PMC free article] [PubMed] [Google Scholar]
- He M, Liu Y, Wang X, Zhang MQ, Hannon GJ, Huang ZJ (2012) Cell‐type‐based analysis of microRNA profiles in the mouse brain. Neuron 73: 35–48 [DOI] [PMC free article] [PubMed] [Google Scholar]
- Hebert SS, Horre K, Nicolai L, Papadopoulou AS, Mandemakers W, Silahtaroglu AN, Kauppinen S, Delacourte A, De Strooper B (2008) Loss of microRNA cluster miR‐29a/b‐1 in sporadic Alzheimer's disease correlates with increased BACE1/ ‐secretase expression. Proc Natl Acad Sci USA 105: 6415–6420 [DOI] [PMC free article] [PubMed] [Google Scholar]
- Heid J, Cencioni C, Ripa R, Baumgart M, Atlante S, Milano G, Scopece A, Kuenne C, Guenther S, Azzimato V et al (2017) Age‐dependent increase of oxidative stress regulates microRNA‐29 family preserving cardiac health. Sci Rep 7: 16839 [DOI] [PMC free article] [PubMed] [Google Scholar]
- Hensch TK, Quinlan EM (2018) Critical periods in amblyopia. Vis Neurosci 35: E014 [DOI] [PMC free article] [PubMed] [Google Scholar]
- Hill JJ, Jin K, Mao XO, Xie L, Greenberg DA (2012) Intracerebral chondroitinase ABC and heparan sulfate proteoglycan glypican improve outcome from chronic stroke in rats. Proc Natl Acad Sci USA 109: 9155–9160 [DOI] [PMC free article] [PubMed] [Google Scholar]
- Huang ZJ, Kirkwood A, Pizzorusso T, Porciatti V, Morales B, Bear MF, Maffei L, Tonegawa S (1999) BDNF regulates the maturation of inhibition and the critical period of plasticity in mouse visual cortex. Cell 98: 739–755 [DOI] [PubMed] [Google Scholar]
- Huang DW, Sherman BT, Lempicki RA (2009a) Systematic and integrative analysis of large gene lists using DAVID bioinformatics resources. Nat Protoc 4: 44–57 [DOI] [PubMed] [Google Scholar]
- Huang DW, Sherman BT, Lempicki RA (2009b) Bioinformatics enrichment tools: paths toward the comprehensive functional analysis of large gene lists. Nucleic Acids Res 37: 1–13 [DOI] [PMC free article] [PubMed] [Google Scholar]
- Inukai S, de Lencastre A, Turner M, Slack F (2012) Novel microRNAs differentially expressed during aging in the mouse brain. PLoS ONE 7: e40028 [DOI] [PMC free article] [PubMed] [Google Scholar]
- Jassal B, Matthews L, Viteri G, Gong C, Lorente P, Fabregat A, Sidiropoulos K, Cook J, Gillespie M, Haw R et al (2019) The reactome pathway knowledgebase. Nucleic Acids Res 48: D498–D503 [DOI] [PMC free article] [PubMed] [Google Scholar]
- Jenks KR, Kim T, Pastuzyn ED, Okuno H, Taibi AV, Bito H, Bear MF, Shepherd JD (2017) Arc restores juvenile plasticity in adult mouse visual cortex. Proc Natl Acad Sci USA 114: 9182–9187 [DOI] [PMC free article] [PubMed] [Google Scholar]
- Johnson R, Zuccato C, Belyaev ND, Guest DJ, Cattaneo E, Buckley NJ (2008) A microRNA‐based gene dysregulation pathway in Huntington's disease. Neurobiol Dis 29: 438–445 [DOI] [PubMed] [Google Scholar]
- Kayala MA, Baldi P (2012) Cyber‐T web server: differential analysis of high‐throughput data. Nucleic Acids Res 40: W553–W559 [DOI] [PMC free article] [PubMed] [Google Scholar]
- Kelly EA, Russo AS, Jackson CD, Lamantia CE, Majewska AK (2015) Proteolytic regulation of synaptic plasticity in the mouse primary visual cortex: analysis of matrix metalloproteinase 9 deficient mice. Front Cell Neurosci 9: 369 [DOI] [PMC free article] [PubMed] [Google Scholar]
- Khanna S, Rink C, Ghoorkhanian R, Gnyawali S, Heigel M, Wijesinghe DS, Chalfant CE, Chan YC, Banerjee J, Huang Y et al (2013) Loss of miR‐29b following acute ischemic stroke contributes to neural cell death and infarct size. J Cereb Blood Flow Metab 33: 1197–1206 [DOI] [PMC free article] [PubMed] [Google Scholar]
- Khvorova A, Watts JK (2017) The chemical evolution of oligonucleotide therapies of clinical utility. Nat Biotechnol 35: 238–248 [DOI] [PMC free article] [PubMed] [Google Scholar]
- Kim S, Kim H, Um JW (2018) Synapse development organized by neuronal activity‐regulated immediate‐early genes. Exp Mol Med 50: 11 [DOI] [PMC free article] [PubMed] [Google Scholar]
- Klein ME, Lioy DT, Ma L, Impey S, Mandel G, Goodman RH (2007) Homeostatic regulation of MeCP2 expression by a CREB‐induced microRNA. Nat Neurosci 10: 1513–1514 [DOI] [PubMed] [Google Scholar]
- Knapska E, Kaczmarek L (2004) A gene for neuronal plasticity in the mammalian brain: Zif268/Egr‐1/NGFI‐A/Krox‐24/TIS8/ZENK? Prog Neurobiol 74: 183–211 [DOI] [PubMed] [Google Scholar]
- Kobayashi Y, Ye Z, Hensch TK (2015) Clock genes control cortical critical period timing. Neuron 86: 264–275 [DOI] [PMC free article] [PubMed] [Google Scholar]
- Kobayashi M, Benakis C, Anderson C, Moore MJ, Poon C, Uekawa K, Dyke JP, Fak JJ, Mele A, Park CY et al (2019) AGO CLIP reveals an activated network for acute regulation of brain glutamate homeostasis in ischemic stroke. Cell Rep 28: 979–991 [DOI] [PMC free article] [PubMed] [Google Scholar]
- Kole AJ, Swahari V, Hammond SM, Deshmukh M (2011) miR‐29b is activated during neuronal maturation and targets BH3‐only genes to restrict apoptosis. Genes Dev 25: 125–130 [DOI] [PMC free article] [PubMed] [Google Scholar]
- Koopmans F, van Nierop P, Andres‐Alonso M, Byrnes A, Cijsouw T, Coba MP, Cornelisse LN, Farrell RJ, Goldschmidt HL, Howrigan DP et al (2019) SynGO: an evidence‐based, expert‐curated knowledge base for the synapse. Neuron 103: 217–234 [DOI] [PMC free article] [PubMed] [Google Scholar]
- Krishnan K, Wang B‐S, Lu J, Wang L, Maffei A, Cang J, Huang ZJ (2015) MeCP2 regulates the timing of critical period plasticity that shapes functional connectivity in primary visual cortex. Proc Natl Acad Sci USA 112: E4782–E4791 [DOI] [PMC free article] [PubMed] [Google Scholar]
- Kuc C, Richard DJ, Johnson S, Bragg L, Servos MR, Doxey AC, Craig PM (2017) Rainbow trout exposed to benzo[a]pyrene yields conserved microRNA binding sites in DNA methyltransferases across 500 million years of evolution. Sci Rep 7: 16843 [DOI] [PMC free article] [PubMed] [Google Scholar]
- Lensjø KK, Lepperød ME, Dick G, Hafting T, Fyhn M (2017) Removal of perineuronal nets unlocks juvenile plasticity through network mechanisms of decreased inhibition and increased gamma activity. J Neurosci 37: 1269–1283 [DOI] [PMC free article] [PubMed] [Google Scholar]
- Levelt CN, Hübener M (2012) Critical‐period plasticity in the visual cortex. Annu Rev Neurosci 35: 309–330 [DOI] [PubMed] [Google Scholar]
- Lippi G, Steinert JR, Marczylo EL, D'Oro S, Fiore R, Forsythe ID, Schratt G, Zoli M, Nicotera P, Young KW (2011) Targeting of the Arpc3 actin nucleation factor by miR‐29a/b regulates dendritic spine morphology. J Cell Biol 194: 889–904 [DOI] [PMC free article] [PubMed] [Google Scholar]
- Lippi G, Fernandes CC, Ewell LA, John D, Romoli B, Curia G, Taylor SR, Frady EP, Jensen AB, Liu JC et al (2016) MicroRNA‐101 regulates multiple developmental programs to constrain excitation in adult neural networks. Neuron 92: 1337–1351 [DOI] [PMC free article] [PubMed] [Google Scholar]
- Mataga N, Mizuguchi Y, Hensch TK (2004) Experience‐dependent pruning of dendritic spines in visual cortex by tissue plasminogen activator. Neuron 44: 1031–1041 [DOI] [PubMed] [Google Scholar]
- Mazziotti R, Baroncelli L, Ceglia N, Chelini G, Sala GD, Magnan C, Napoli D, Putignano E, Silingardi D, Tola J et al (2017a) Mir‐132/212 is required for maturation of binocular matching of orientation preference and depth perception. Nat Commun 8: 15488 [DOI] [PMC free article] [PubMed] [Google Scholar]
- Mazziotti R, Baroncelli L, Ceglia N, Chelini G, Sala GD, Magnan C, Napoli D, Putignano E, Silingardi D, Tola J et al (2017b) Gene Expression Omnibus GSE95649 (https://www.ncbi.nlm.nih.gov/geo/query/acc.cgi?acc=GSE95649) [DATASET] [DOI] [PMC free article] [PubMed]
- McCurry CL, Shepherd JD, Tropea D, Wang KH, Bear MF, Sur M (2010) Loss of Arc renders the visual cortex impervious to the effects of sensory experience or deprivation. Nat Neurosci 13: 450–457 [DOI] [PMC free article] [PubMed] [Google Scholar]
- Miyata S, Komatsu Y, Yoshimura Y, Taya C, Kitagawa H (2012) Persistent cortical plasticity by upregulation of chondroitin 6‐sulfation. Nat Neurosci 15: 414–422 [DOI] [PubMed] [Google Scholar]
- Mo J, Kim C‐H, Lee D, Sun W, Lee HW, Kim H (2015) Early growth response 1 (Egr‐1) directly regulates GABAA receptor α2, α4, and θ subunits in the hippocampus. J Neurochem 133: 489–500 [DOI] [PubMed] [Google Scholar]
- Morita S, Horii T, Kimura M, Ochiya T, Tajima S, Hatada I (2013) miR‐29 represses the activities of DNA methyltransferases and DNA demethylases. Int J Mol Sci 14: 14647–14658 [DOI] [PMC free article] [PubMed] [Google Scholar]
- Murase S, Lantz CL, Quinlan EM (2017) Light reintroduction after dark exposure reactivates plasticity in adults via perisynaptic activation of MMP‐9. eLife 6: e27345 [DOI] [PMC free article] [PubMed] [Google Scholar]
- Nolan K, Mitchem MR, Jimenez‐Mateos EM, Henshall DC, Concannon CG, Prehn JHM (2014) Increased expression of microRNA‐29a in ALS mice: functional analysis of its inhibition. J Mol Neurosci 53: 231–241 [DOI] [PubMed] [Google Scholar]
- Oray S, Majewska A, Sur M (2004) Dendritic spine dynamics are regulated by monocular deprivation and extracellular matrix degradation. Neuron 44: 1021–1030 [DOI] [PubMed] [Google Scholar]
- Ouyang Y‐B, Xu L, Lu Y, Sun X, Yue S, Xiong X‐X, Giffard RG (2013) Astrocyte‐enriched miR‐29a targets PUMA and reduces neuronal vulnerability to forebrain ischemia. Glia 61: 1784–1794 [DOI] [PMC free article] [PubMed] [Google Scholar]
- Pantazopoulos H, Woo T‐UW, Lim MP, Lange N, Berretta S (2010) Extracellular matrix‐glial abnormalities in the amygdala and entorhinal cortex of subjects diagnosed with schizophrenia. Arch Gen Psychiatry 67: 155–166 [DOI] [PMC free article] [PubMed] [Google Scholar]
- Pantazopoulos H, Markota M, Jaquet F, Ghosh D, Wallin A, Santos A, Caterson B, Berretta S (2015) Aggrecan and chondroitin‐6‐sulfate abnormalities in schizophrenia and bipolar disorder: a postmortem study on the amygdala. Transl Psychiat 5: e496 [DOI] [PMC free article] [PubMed] [Google Scholar]
- Pantazopoulos H, Berretta S (2016) In sickness and in health: perineuronal nets and synaptic plasticity in psychiatric disorders. Neural Plast 2016: 9847696 [DOI] [PMC free article] [PubMed] [Google Scholar]
- Pizzorusso T, Medini P, Berardi N, Chierzi S, Fawcett JW, Maffei L (2002) Reactivation of ocular dominance plasticity in the adult visual cortex. Science 298: 1248–1251 [DOI] [PubMed] [Google Scholar]
- Pizzorusso T, Medini P, Landi S, Baldini S, Berardi N, Maffei L (2006) Structural and functional recovery from early monocular deprivation in adult rats. Proc Natl Acad Sci USA 103: 8517–8522 [DOI] [PMC free article] [PubMed] [Google Scholar]
- Putignano E, Lonetti G, Cancedda L, Ratto G, Costa M, Maffei L, Pizzorusso T (2007) Developmental downregulation of histone posttranslational modifications regulates visual cortical plasticity. Neuron 54: 177 [DOI] [PubMed] [Google Scholar]
- Rajman M, Schratt G (2017) MicroRNAs in neural development: from master regulators to fine‐tuners. Development 144: 2310–2322 [DOI] [PubMed] [Google Scholar]
- Reichelt AC, Hare DJ, Bussey TJ, Saksida LM (2019) Perineuronal nets: plasticity, protection, and therapeutic potential. Trends Neurosci 42: 458–470 [DOI] [PubMed] [Google Scholar]
- Ripa R, Dolfi L, Terrigno M, Pandolfini L, Savino A, Arcucci V, Groth M, Terzibasi Tozzini E, Baumgart M, Cellerino A (2017) MicroRNA miR‐29 controls a compensatory response to limit neuronal iron accumulation during adult life and aging. BMC Biol 15: 9 [DOI] [PMC free article] [PubMed] [Google Scholar]
- Ritchie ME, Phipson B, Wu D, Hu Y, Law CW, Shi W, Smyth GK (2015) limma powers differential expression analyses for RNA‐sequencing and microarray studies. Nucleic Acids Res 43: e47 [DOI] [PMC free article] [PubMed] [Google Scholar]
- Rowlands D, Lensjø KK, Dinh T, Yang S, Andrews MR, Hafting T, Fyhn M, Fawcett JW, Dick G (2018) Aggrecan directs extracellular matrix‐mediated neuronal plasticity. J Neurosci 38: 10102–10113 [DOI] [PMC free article] [PubMed] [Google Scholar]
- Rupaimoole R, Slack FJ (2017) MicroRNA therapeutics: towards a new era for the management of cancer and other diseases. Nat. Rev. Drug Discov. 16: 203–222 [DOI] [PubMed] [Google Scholar]
- Sato M, Stryker MP (2008) Distinctive features of adult ocular dominance plasticity. J Neurosci 28: 10278–10286 [DOI] [PMC free article] [PubMed] [Google Scholar]
- Silingardi D, Scali M, Belluomini G, Pizzorusso T (2010) Epigenetic treatments of adult rats promote recovery from visual acuity deficits induced by long‐term monocular deprivation. Eur J Neurosci 31: 2185–2192 [DOI] [PubMed] [Google Scholar]
- Silpananta P, Dunstone JR, Ogston AG (1967) Fractionation of a hyaluronic acid preparation in a density gradient. The isolation and identification of a chondroitin sulphate. Biochem J 104: 404–409 [DOI] [PMC free article] [PubMed] [Google Scholar]
- Smith CIE, Edvard Smith CI, Zain R (2019) Therapeutic oligonucleotides: state of the art. Annu Rev Pharmacol Toxicol 59: 605–630 [DOI] [PubMed] [Google Scholar]
- Soleman S, Yip PK, Duricki DA, Moon LDF (2012) Delayed treatment with chondroitinase ABC promotes sensorimotor recovery and plasticity after stroke in aged rats. Brain 135: 1210–1223 [DOI] [PMC free article] [PubMed] [Google Scholar]
- Somel M, Guo S, Fu N, Yan Z, Hu HY, Xu Y, Yuan Y, Ning Z, Hu Y, Menzel C et al (2010) MicroRNA, mRNA, and protein expression link development and aging in human and macaque brain. Genome Res 20: 1207–1218 [DOI] [PMC free article] [PubMed] [Google Scholar]
- Sorg BA, Berretta S, Blacktop JM, Fawcett JW, Kitagawa H, Kwok JCF, Miquel M (2016) Casting a wide net: role of perineuronal nets in neural plasticity. J Neurosci 36: 11459–11468 [DOI] [PMC free article] [PubMed] [Google Scholar]
- Spatazza J, Lee HHC, Di Nardo AA, Tibaldi L, Joliot A, Hensch TK, Prochiantz A (2013) Choroid‐plexus‐derived Otx2 homeoprotein constrains adult cortical plasticity. Cell Rep 3: 1815–1823 [DOI] [PMC free article] [PubMed] [Google Scholar]
- Spolidoro M, Putignano E, Munafò C, Maffei L, Pizzorusso T (2012) Inhibition of matrix metalloproteinases prevents the potentiation of nondeprived‐eye responses after monocular deprivation in juvenile rats. Cereb Cortex 22: 725–734 [DOI] [PubMed] [Google Scholar]
- Steinfeld I, Navon R, Ach R, Yakhini Z (2013) miRNA target enrichment analysis reveals directly active miRNAs in health and disease. Nucleic Acids Res 41: e45 [DOI] [PMC free article] [PubMed] [Google Scholar]
- Stroud H, Su SC, Hrvatin S, Greben AW, Renthal W, Boxer LD, Nagy MA, Hochbaum DR, Kinde B, Gabel HW et al (2017) Early‐life gene expression in neurons modulates lasting epigenetic states. Cell 171: 1151–1164 [DOI] [PMC free article] [PubMed] [Google Scholar]
- Takahashi M, Eda A, Fukushima T, Hohjoh H (2012) Reduction of type IV collagen by upregulated miR‐29 in normal elderly mouse and klotho‐deficient, senescence‐model mouse. PLoS ONE 7: e48974 [DOI] [PMC free article] [PubMed] [Google Scholar]
- Takesian AE, Hensch TK (2013) Balancing plasticity/stability across brain development. Prog Brain Res 207: 3–34 [DOI] [PubMed] [Google Scholar]
- Tasic B, Menon V, Nguyen TN, Kim TK, Jarsky T, Yao Z, Levi B, Gray LT, Sorensen SA, Dolbeare T et al (2016) Adult mouse cortical cell taxonomy revealed by single cell transcriptomics. Nat Neurosci 19: 335–346 [DOI] [PMC free article] [PubMed] [Google Scholar]
- Tognini P, Putignano E, Coatti A, Pizzorusso T (2011) Experience‐dependent expression of miR‐132 regulates ocular dominance plasticity. Nat Neurosci 14: 1237–1239 [DOI] [PMC free article] [PubMed] [Google Scholar]
- Tognini P, Napoli D, Tola J, Silingardi D, Della Ragione F, D'Esposito M, Pizzorusso T (2015) Experience‐dependent DNA methylation regulates plasticity in the developing visual cortex. Nat Neurosci 18: 956–958 [DOI] [PubMed] [Google Scholar]
- Ugalde AP, Ramsay AJ, de la Rosa J, Varela I, Mariño G, Cadiñanos J, Lu J, Freije JM, López‐Otín C (2011) Aging and chronic DNA damage response activate a regulatory pathway involving miR‐29 and p53. EMBO J 30: 2219–2232 [DOI] [PMC free article] [PubMed] [Google Scholar]
- Vierci G, Pannunzio B, Bornia N, Rossi FM (2016) H3 and H4 lysine acetylation correlates with developmental and experimentally induced adult experience‐dependent plasticity in the mouse visual cortex. J Exp Neurosci 10: 49–64 [DOI] [PMC free article] [PubMed] [Google Scholar]
- Wen TH, Afroz S, Reinhard SM, Palacios AR, Tapia K, Binder DK, Razak KA, Ethell IM (2018a) Genetic reduction of matrix metalloproteinase‐9 promotes formation of perineuronal nets around parvalbumin‐expressing interneurons and normalizes auditory cortex responses in developing Fmr1 knock‐out mice. Cereb Cortex 28: 3951–3964 [DOI] [PMC free article] [PubMed] [Google Scholar]
- Wen TH, Binder DK, Ethell IM, Razak KA (2018b) The perineuronal ‘safety’ net? Perineuronal net abnormalities in neurological disorders. Front Mol Neurosci 11: 270 [DOI] [PMC free article] [PubMed] [Google Scholar]
- Wiersma AM, Fouad K, Winship IR (2017) Enhancing spinal plasticity amplifies the benefits of rehabilitative training and improves recovery from stroke. J Neurosci 37: 10983–10997 [DOI] [PMC free article] [PubMed] [Google Scholar]
- Yang S, Hilton S, Alves JN, Saksida LM, Bussey T, Matthews RT, Kitagawa H , Spillantini MG, Kwok JCF, Fawcett JW (2017) Antibody recognizing 4‐sulfated chondroitin sulfate proteoglycans restores memory in tauopathy‐induced neurodegeneration. Neurobiol Aging 59: 197–209 [DOI] [PubMed] [Google Scholar]
- Yoo M, Khaled M, Gibbs KM, Kim J, Kowalewski B, Dierks T, Schachner M (2013) Arylsulfatase B improves locomotor function after mouse spinal cord injury. PLoS ONE 8: e57415 [DOI] [PMC free article] [PubMed] [Google Scholar]
- Zhang X, Bhattacharyya S, Kusumo H, Goodlett CR, Tobacman JK, Guizzetti M (2014) Arylsulfatase B modulates neurite outgrowth via astrocyte chondroitin‐4‐sulfate: dysregulation by ethanol. Glia 62: 259–271 [DOI] [PMC free article] [PubMed] [Google Scholar]
Associated Data
This section collects any data citations, data availability statements, or supplementary materials included in this article.
Supplementary Materials
Appendix
Expanded View Figures PDF
Dataset EV1
Dataset EV2
Dataset EV3
Dataset EV4
Dataset EV5
Dataset EV6
Dataset EV7
Dataset EV8
Review Process File
Data Availability Statement
The datasets produced in this study are available in the following databases:
RNA‐seq data: Gene Expression Omnibus GSE141734 (https://www.ncbi.nlm.nih.gov/geo/query/acc.cgi?acc=GSE141734)
Proteomic data: ProteomeXchange Consortium via the PRIDE partner repository PXD016430 (http://proteomecentral.proteomexchange.org/cgi/GetDataset?ID=PXD016430) and PXD016358 (http://proteomecentral.proteomexchange.org/cgi/GetDataset?ID=PXD016358)