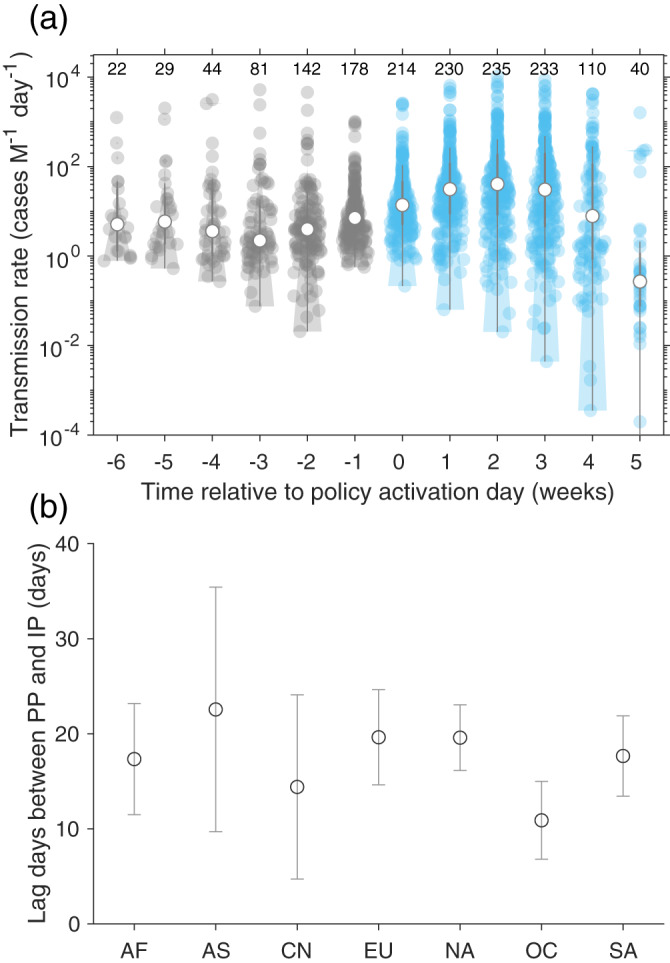
Figure 2.

Transmission rate and lag between point of policy activation day (PP) and point of inflection (IP). (a) Changes in transmission rate with time relative to PP. (b) Lag days between PP and IP of transmission rate across the continents. The detailed definitions of PP and IP can be found in Figure 1. The regions are grouped into Africa (AF), Asia without China (AS), China (CN), Europe (EU), North America (NA), Oceania (OC), and South America (SA).
