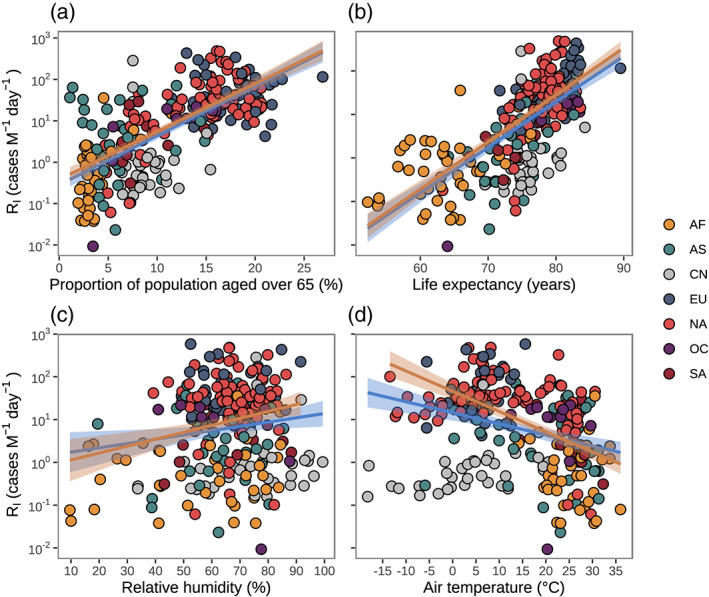
Figure 4.

The association between transmission rate at point of inflection (R I) and selected potential factors. (a) With proportion of population aged over 65 years: Ln (R I) ~(25.83 ± 1.73) × x − (1.06 ± 0.22), R 2 = 0.47, p < 0.0001 for global data; Ln (R I) ~(25.36 ± 1.65) × x − (0.82 ± 0.22), R 2 = 0.51, p < 0.0001 for global data without China. (b) With life expectancy: Ln (R I) ~(0.23 ± 0.016) × x − (15.64 ± 1.17), R 2 = 0.46, p < 0.0001 for global data; Ln (R I) ~(0.24 ± 0.014) × x − (16.00 ± 1.05), R 2 = 0.57, p < 0.0001 for global data without China. (c) With relative humidity: Ln (R I) ~(0.021 ± 0.0090) × x + (0.39 ± 0.61), R 2 = 0.020, p = 0.018 for global data; Ln (R I) ~(0.034 ± 0.0097) × x − (0.098 ± 0.64), R 2 = 0.052, p = 0.0005 for global data without China. (d) With air temperature: Ln (R I) ~(−0.080 ± 0.012) × x + (3.01 ± 0.22), R 2 = 0.14, p < 0.0001 for global data; Ln (R I) ~(−0.12 ± 0.012) × x + (3.91 ± 0.22), R 2 = 0.51, p < 0.0001 for global data without China. Blue and yellow lines with shade area show the fitness based on global data and global data without China, respectively. The colors of points indicate the regions in Africa (AF), Asia without China (AS), China (CN), Europe (EU), North America (NA), Oceania (OC), and South America (SA), respectively.
