

Abstract
Light-gated ion channels and pumps have made it possible to probe intact neural circuits by manipulating the activity of groups of genetically similar neurons. What is needed now is a method for precisely aiming the stimulating light at single neuronal processes, neurons or groups of neurons. We have developed a method that combines Generalized Phase Contrast (GPC) with temporal focusing (TF) to shape two-photon (2P) excitation for this purpose. The illumination patterns are generated automatically from fluorescent images of neurons and shaped to cover parts of the cell body or dendrite, the entire cell body, or distributed groups of cells. The TF-GPC patterned 2P excitation generates large photo-currents in Channelrhodopsin-2 (ChR2) expressing cultured cells and neurons and in acute cortical slices. The amplitudes of the photo-currents can be precisely modulated by controlling the size and shape of the excitation volume and, thereby, be used to trigger single action potentials (APs) or trains of APs.
INTRODUCTION
Since the earliest studies from Wilder Penfield at the beginning of the 20th century on the human cortex, a significant component of what we know about the brain has come from stimulation experiments. Important studies have utilized nerve stimulation or perturbation of excitability of discrete regions of the brain with electrodes or local drug application. However, these approaches are limited to manipulating activity in one or a few locations at a time, usually with poor spatial resolution (acting on many neurons), necessitate physical contact with the tissue under investigation in case of electrodes, have slow exchange in the case of pharmacological agents and do not permit to target specific cell types.
With the advent of new microscopy modalities and optogenetics it has become possible to greatly advance the precision of the manipulations. Compared to electrical or pharmacological stimulation, light stimulation of optogenetic molecules can be less invasive, allow superior spatial and temporal resolution and specificity for cell type and provide considerable flexibility and quick reversibility1. The best developed and most widely used optogenetic tool is Channelrhodopsin-2 (ChR2)2, a cation selective channel that, like other genetically encoded pumps and channels, can be functionally expressed in mammalian neurons under the control of cell-specific promoters. Upon illumination with blue light, the cation-flux generated through ChR2 produces rapid membrane depolarization, which can evoke reliable trains of action potentials (APs) at frequencies up to 200 Hz3.
Several methods have been used to activate ChR2, including wide-field lamp illumination4–6, laser-scanning-illumination7 or illumination with a micro-LED array8. For in vivo applications, ChR2 is usually stimulated by light sources coupled to optical fibers9–12 or by miniaturized light-emitting diodes13. So far, the limitations imposed by the low penetration depth of blue light and the lack of optical sectioning inherent for single-photon (1P) excitation have been mitigated by the low excitation levels necessary for photoactivation (~1 mW/mm2)9 and by genetic targeting of ChR2 expression. This has permitted applications in freely moving mice including the optical control of whisker movement9, the directional control of locomotion10, the probing of Parkinsonian neuronal circuits11 and the restoration of visual function in retinal degeneration14. However, these approaches have significant limitations with respect to spatial and temporal resolution, limiting the ability to perturb select subsets of neurons that cannot be distinguished based on cell specific promoters. Moreover, these approaches do not permit the selective stimulation of distinct subcellular compartments. Overcoming these limitations would necessarily require the use of two-photon (2P) excitation.
Several factors hinder the use of 2P excitation to stimulate ChR2. First, ChR2 has a low conductance (~80 fS)15 and with the low density of ChR2 channels typically expressed per membrane unit, it is difficult to induce the depolarization necessary to drive APs by photoactivation with the standard small 2P excitation volume (~2-5 μm3). Increasing the excitation density would not help, as saturation of excited ChR2 channels is quickly reached due to the high 2P absorption cross-section of ChR2 (~260 GM at 920 nm)16 and the long lifetime of the conducting excited states (~10 ms)16. One solution for increasing the fraction of the cell’s membrane that is excited by 2P is to under-fill the objective back aperture16 and/or perform fast scanning of the laser beam through multiple positions16. However, the first method suffers from a significant loss in axial resolution and the second approach is limited in temporal resolution 16.
The above considerations lead to the notion that the optimal illumination method for ChR2 stimulation with 2P excitation requires low excitation density, large excitation areas, and millisecond- and micro-scale resolution. We recently proposed a solution that could satisfy these requirements: a novel method for generating 2P light patterns by combining digital holography (DH) with a dispersive optical setup for temporal focusing (TF)17. With this approach, we demonstrated that excitation of large 2D areas can be achieved over short time scales, with a pattern-independent depth resolution of less than 6 μm18,19.
However, the DH-TF approach has two limitations intrinsic to digital holography. First, the light distribution of the illumination spots has significant spatial intensity fluctuations, called speckles20–22. In 2P excitation, this represented an intensity variation of up to 50%18, 19. Simple solutions for eliminating the speckles, such as averaging over many randomized speckle patterns by introducing a rapidly rotating diffuser after the dispersive grating18 or by projecting a sequence of shifted holograms21, are not practical since they deteriorate depth resolution, lengthen exposure time and, in the case of the diffuser, cause power loss. Second, the rapid phase variations, typical of holographic wave-fronts, interfere with the geometrical dispersion of the grating, which is the basis of TF, causing a broadening of the axial (z-axis) resolution18, 19. To overcome these limitations, we have developed an alternative method for the generation of optically confined 2P excitation patterns where the axial and lateral control of light illumination are achieved by a unique combination of the TF scheme with the Generalized Phase Contrast (GPC) method23 via the use of a reconfigurable Liquid Crystal on Silicon Spatial Light Modulator (LCOS-SLM).
GPC belongs to the category of interferometric phase visualization techniques where the output light distributions are obtained by the interference between a signal and a so called self-generated or synthetic reference wave, which travel along the same optical axis. The best known example of an interferometric phase visualization technique is the Zernike phase contrast method24, which earned the Dutch physicist Fritz Zernike the Nobel Prize in physics in 1953. In the Zernike approach the visualization of small phase perturbations is obtained by the use of a fixed quarter-wave phase shifting filter at the Fourier plane; its demonstration represented a true breakthrough in medicine and biology by making transparent samples clearly visible under a microscope. The GPC method is based on an extension of the Zernike phase contrast approach into the domain of full-range [0, 2π] phase modulation23. Briefly, a desired target intensity map is converted into a spatially similar phase map that is addressed on a phase-only modulating SLM. A phase contrast filter (PCF) placed at the Fourier plane of the SLM imposes an appropriate phase retardation between the on-axis focused component and the higher-order diffracted Fourier components. The PCF is typically – but not limited to – introducing a half-wave phase shift in GPC contrary to the fixed quarter-wave phase shifting PCF of the Zernike approach. The interference between the phase-shifted focused and the scattered light, from now on referred to as the synthetic reference wave and the signal wave, respectively, allows generating a pure phase-to-intensity conversion at the output plane. To date GPC has been successfully applied in pioneering demonstrations of real-time 3D optical particle trapping and manipulation25, wave-front sensing26, lossless image projection27 and phase security and encryption28.
Here, we use GPC in combination with a dispersive setup for TF to generate 2P speckle-free scanning-less shaped domains with an axial resolution comparable to that obtained in 2P line-scanning microscopy. We apply this approach to activate ChR2 by 2P excitation in ChR2-expressing cultured cells and demonstrate deep 2P photoactivation of ChR2 in brain slices from ChR2-YFP transgenic mice. We show that by controlling the size and shape of the illumination in a manner that can be sculpted to follow a particular shape of the cell body or dendrite, we are able to modulate the amplitude of photo-stimulated currents and the spiking rate with micrometer axial and lateral resolution.
RESULTS
Spatiotemporal control of light patterning by TF-GPC
The optical path combining the GPC light mapping scheme with TF is schematized in Figure 1. The output from a mode-locked Ti:Sapphire laser is expanded to illuminate a LCOS-SLM through a circular aperture (radius Rc = 5 mm). The LCOS-SLM is located at the front focal plane of a standard 4-f imaging setup with a phase contrast filter (PCF) located at the confocal plane between the two lenses. The PCF consists of a patterned phase mask, with circular pits of variable diameters, which provides a half-wave phase shift between the synthetic reference (the non-diffracted) and the signal (consisting of the higher-order spatial Fourier components). The device is controlled by custom-designed software that converts the target intensity distribution into a binary [0, π] phase mask and addresses the pattern to the LCOS-SLM. For the TF, a blazed reflectance grating (830 lines/mm) is placed at the output mapping plane of the GPC system and is aligned perpendicular to the optical axis of the microscope. The grating disperses the various frequency components of the pattern, which are imaged onto the sample via a telescope comprised of an achromatic lens and the microscope objective. This gives rise to a depth-resolved temporally focused excitation pattern at the focal plane of the objective, in which the lateral spatial distribution is a reduced (~1/110) replica of the GPC output pattern generated at the grating position.
Figure 1. Temporal focusing and generalized phase contrast.
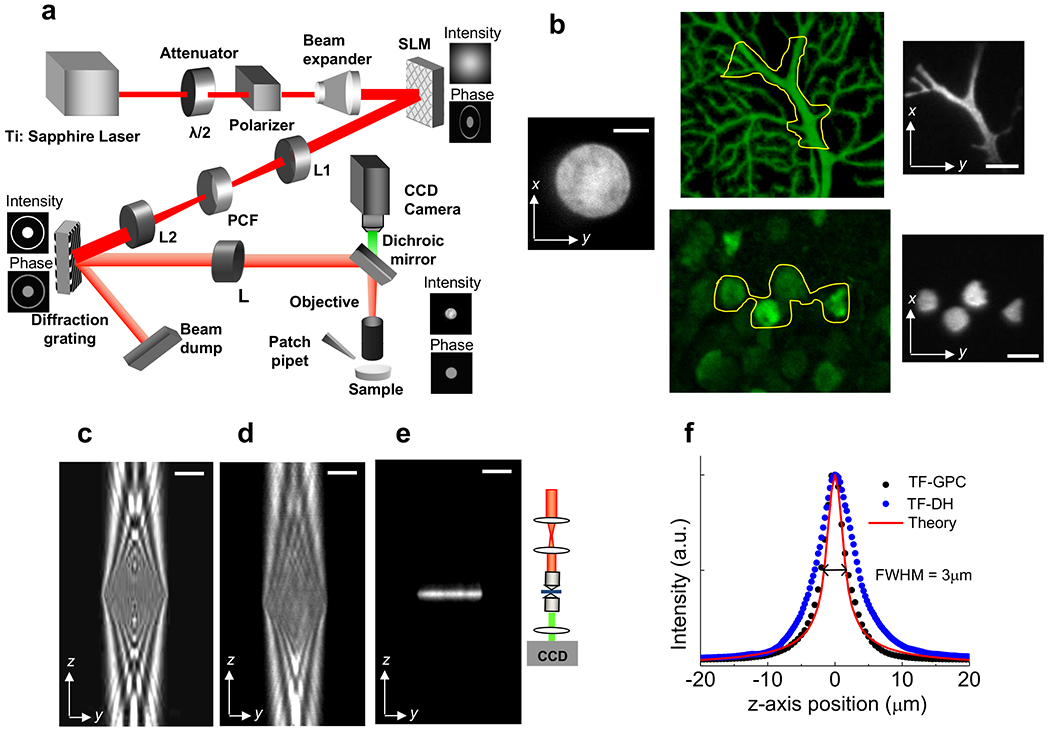
Layout of the optical setup (Beam expander: 5×, SLM: Spatial Light Modulator, L1, L2, L: lenses with focal lengths f1 = 400 mm, f2 = 300 mm and f = 500 mm, PCF: Phase Contrast Filter, Diffraction Grating: 830 lines/mm, CCD: Camera). An example of the intensity and phase distributions at the SLM, grating and sample planes are indicated.
In Figure 2a, we show three examples of illumination generated with the GPC method visualized by exciting a thin fluorescent layer: a circular spot of diameter s = 20 μm, an excitation shape tailored to the geometry of a fluorescence image of a dendrite, showing how the excitation can be precisely shaped to reproduce fine structures of the neural processes, and an excitation shape tailored to the somata of multiple cells that shows the selective excitation of a specific subset of cells. The x-y intensity profile of the circular spot is plotted in Figure 2b. It is clear that the intensity distribution (black trace) is characterized by sharp edges and that the intensity profile is substantially homogeneous. In both of these respects, the profile is superior to what we could previously achieve in DH (red trace)18, showing a less sharp cut-off at the edges and substantial speckled intensity fluctuations.
Figure 2. Lateral and axial control of the excitation volume.
(a) Images of a circular spot of diameter s = 20 μm and shaped patterns created with the setup illustrated in Fig. 1, by 2P excitation of a thin (~1 μm) fluorescent layer (excitation wavelength, λexc = 780 nm; objective 60×, 0.9 NA). The shaped patterns were designed on the basis of a confocal fluorescence image of a Purkinje cell (center up) and a wide-field fluorescence image of CA1 hippocampal neurons loaded with Oregon green bapta (center down), in selected regions of interest (yellow line), (b) Lateral profile of the 20 μm circular spot shown in a (black curve) compared to the lateral profile measured for a 20μm circular spot generated with digital holography (DH) (red line) from Papagiakoumou et al.18. (c) y-z section of a simulated axial propagation of a GPC-generated 20 μm spot when temporal focusing (TF) is not applied to the system, (d) The same with c experimentally measured with a double microscope (inset), (e) y-z section of a measured axial propagation of a GPC-generated 20 μm spot when TF is applied, (f) Axial profile of the fluorescence intensity integrated over the different planes of the optical stack in e (black dots) compared with the theoretical curve for the axial integrated intensity in line-scanning 2P microscopy (red line) given by the expression , with zR = 0.8 μm. The axial profile of the fluorescence intensity corresponding to a circular spot of 20 μm generated by digital holography is also shown (blue dots). Scale bars: 10 μm.
A precise characterization of the excitation volume obtained with the TF-GPC combination requires knowledge of the beam propagation along the optical (z) axis. To precisely characterize the effect of temporal focusing, we first performed the calculation for the beam propagation in a configuration where the diffraction grating was replaced with a mirror by using the formalism described by Lutz et al.20 Figure 2c shows the calculated y-z intensity cross-section for the case of a GPC beam that produces a homogenous circle with sharp edges and a lateral diameter, 5, of 20 μm. Figure 2d shows the experimental y-z intensity for the same beam measured by a double microscope setup18, 20 (inset). We observe an almost cylindrical excitation shape with light modulation resulting from the interference between the diffraction component generated by the sharp edges of the circle and the light from the circular pattern. Figure 2e shows the measured z-axis distribution for the same illumination circle when the grating for the temporal focusing is placed at the output mapping plane of the GPC. The range of focus, b, defined as the full width at half maximum of the axial integrated intensity, has been extracted by measuring the integrated intensity for the different planes of the optical stack of Figure 2e (Fig. 2f, black dots) doing so we found a value of b ≃ 3 μm. This value represents a two-fold improvement over TF-DH (blue dots)18 and corresponds to the axial resolution of a conventional line-scanning 2P microscope, i.e. the limiting axial resolution achievable with temporally focused 2D patterns17–29 (Fig. 2f, red curve). By repeating the experiment for illumination areas of different sizes and shapes, we confirmed that the axial resolution is pattern independent.
2P stimulation of photo-currents in ChR2-H134R transfected HEK cells
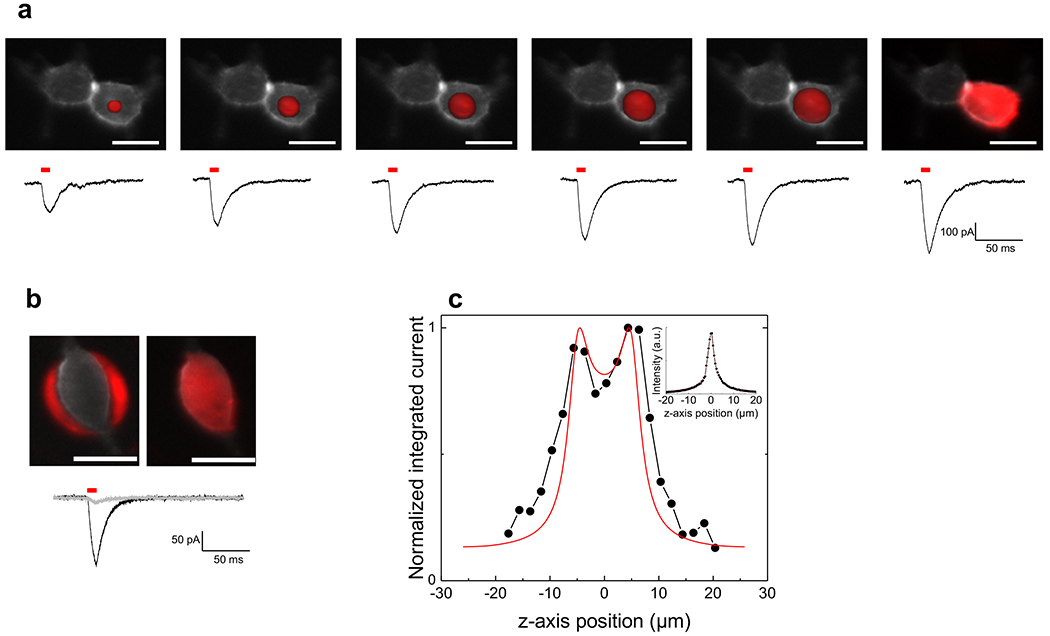
Whole-cell patch clamp recordings from cultured HEK 293 cells held at −60 mV were used to measure ionic currents through ChR2 channels in response to 2P illumination. HEK 293 cells were transfected with a GFP tagged mutant of ChR2 (ChR2-H134R-GFP) that has enhanced currents because of reduced inactivation compared to wild type ChR230. Cells expressing ChR2 were visualized by wide-field epi-fluorescence imaging (λexc = 488 nm, bandwidth 10 nm). The TF-GPC system was used to modulate photo-currents amplitude by generating excitation spots of variable size and shape. An example is reported in Figure 3. Here excitation patterns (λexc = 850 nm; pulse duration =10 ms), ranging in size from a small round spot (5 μm) to a shaped illumination pattern that covered the whole cell (Fig. 3a; top), were used under constant excitation density (0.45 mW/μm2 at sample plane) to generate whole-cell currents of increasing amplitude (Fig. 3a; bottom). The average amplitude of the current for the illumination of the whole cell was −365 ± 166 pA (n=3). This corresponded to ~40% of the peak current generated by illumination of the whole cell (i.e. including the bottom and top cell membranes) with blue light (λexc = 470 nm, bandwidth 17 nm, 2.5 mW/mm2). Interestingly, a 2P illumination of an area just outside the edge of the cell (anti-shape) reduced considerably the evoked current (−27 ±10 pA for anti-shape; −205 ± 137 pA for an excitation shape covering the whole cell; n=5) (Fig. 3b). We note that some of this residual current could be due to a superposition of the anti-shape pattern on small cell protuberances that are difficult to detect in fluorescence.
Figure 3. 2P Photoactivation of ChR2 by 2P TF-GPC in HEK 293 cells.
(a) Top: fluorescence image of a ChR2-H134R-GFP transfected HEK cell with superimposed excitation patterns (red) of increasing surface (left to right: excitation spots of 5, 8, 10, 12, 14 μm in diameter and excitation pattern shaped on the morphology of the cell body). Bottom: corresponding whole-cell photo-currents evoked by 10 ms laser pulses (0.45 mW/μm2). (b) Top: fluorescence image of a ChR2-H134R-GFP transfected HEK cell and superimposed excitation patterns drawn to illuminate the area surrounding the cell (anti-shape, left) or covering the whole cell (shape, right). Bottom: corresponding whole-cell photo-currents (grey and black traces for anti-shaped and shaped patterns respectively; 0.38 mW/μm2). Scale bars: 20 μm. (c) Normalized integrated currents recorded by moving the shaped excitation pattern, shown in b, along different z-axis positions through the cell by steps of 2 μm (black dots) (0.17 mW/μm2). A simulation of the experimental results is, also, shown (red line). The cell was modeled with a parallelepiped of size x = 15, y = 26, z = 10 μm, corresponding to the measured (x, y) and estimated (z, distance between the two experimental peaks) cellular dimensions; the excitation volume was represented by an infinite sheet of light with an axial distribution given by the experimental curve, measured by scanning the 40×, 0.8 NA objective, used for these experiments through a 0.9 μm fluorescent coverslip (inset) and integrating the light collected by the CCD camera. λexc = 850 nm.
Since a key advantage of 2P excitation is the ability to confine the excitation narrowly along the z-axis, we tested the axial resolution of the TF-GPC illumination for 2P excitation of ChR2 by moving the shaped excitation that covered the entire cell in z-axis steps of 2 μm over a range of 40 μm and recording the corresponding photo-currents. The integrated current dropped off sharply at focal points above and below the cell (Fig. 3c, black dots) (FWHM= 13.5 ±4.0 μm, n=7). In some of the cells (4 out of 7), the photo-currents reached a maximum near the top cell membrane, decreased near the cell center and increased again to a second maximum at the bottom cell membrane. This was not evident in all cells, perhaps because of differences in cell flatness. The experimental results could be simulated (Fig. 3c, red curve) by convolving the geometry of the cell membrane, approximated with a parallelepiped, with the excitation volume represented by an infinite sheet of light with an axial distribution given by the experimental curve (Fig. 3c, inset).
These results demonstrate that the unique combination of TF-GPC permits a precise 2P activation of ChR2 channels at non-saturating excitation density and that this stimulation evokes photo-currents that approach those achieved with blue light 1P wide-field illumination, but which afford the axial resolution advantage of 2P excitation. This advantage is preserved by use of the 4 μm axial resolution achievable with TF-GPC, which allows the selective 3D excitation of a single cell and/or the upper or lower membrane of the cell.
Shaped 2P illumination evokes APs in ChR2-H134R transfected cultured cortical neurons
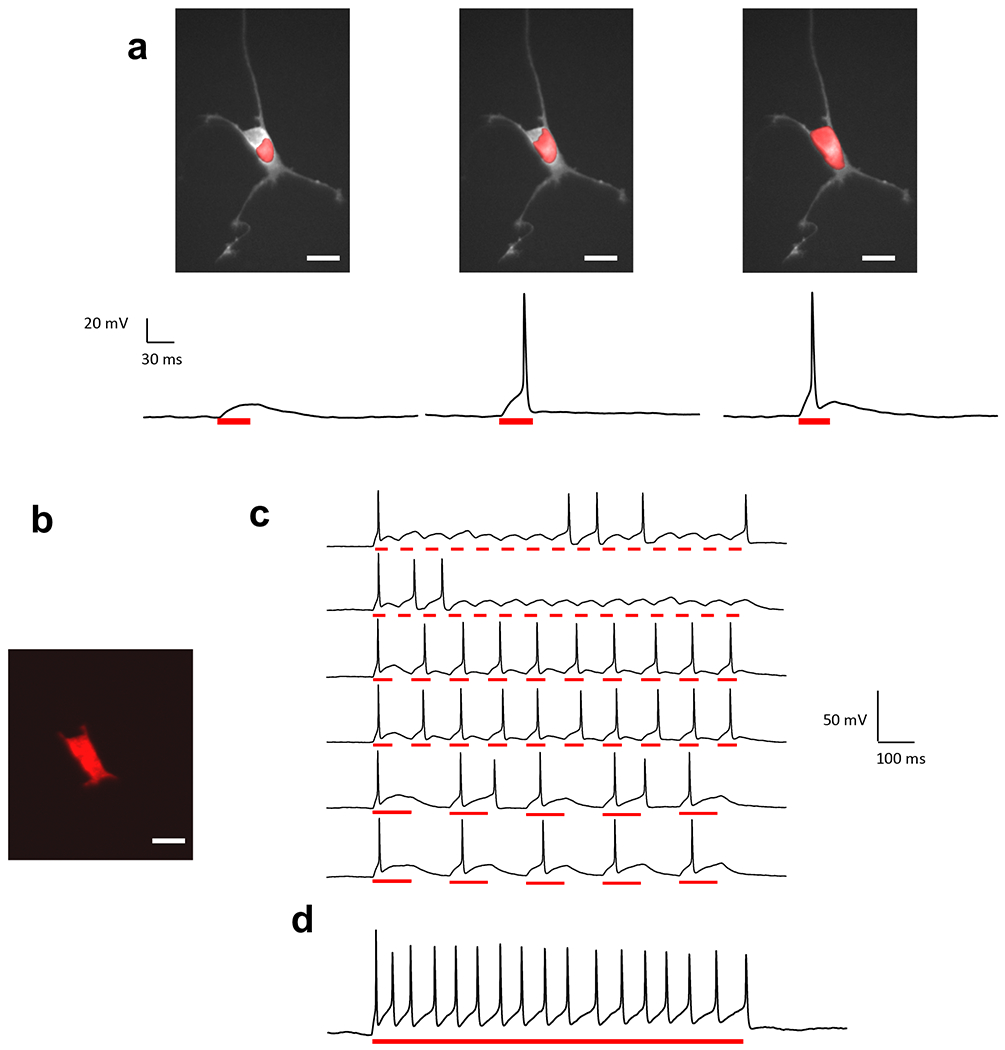
TF-GPC illumination patterns were used to photo-stimulate dissociated cultured cortical neurons transfected with ChR2-H134R-GFP. Wide-field epi-fluorescence illumination was used to find the ChR2-expessing neurons. Fluorescence images of the cells were used to generate local excitation patterns of different sizes and shapes (Fig. 4a). In current clamp, a large illumination shape covering the whole cell (excitation density of 0.60 mW/μm2 and 50 ms pulses) evoked APs (n = 16 out of 19 cells). APs could also be evoked with an excitation area selectively shaped onto the dendrites (Supplementary Fig. 1a, b). Finally, AP trains could be generated by shaped excitation that covered the whole cell body (Fig. 4b) in response to a burst of light pulses at 5, 10 and 15 Hz (0.50 mW/μm2) (Fig. 4c). Excitation with a sustained 1-s long light pulse (0.60 mW/μm2) generated AP trains with a firing frequency of up to 17 Hz (Fig. 4d).
Figure 4. AP generation by 2P TF-GPC in primary neuronal culture.
(a) Excitation spots of increasing coverage of cell body superimposed to the fluorescence image of a neuron (top) trigger photo-depolarizations of increasing size (current clamp recordings, bottom). APs were generated for an excitation area covering ~1/3 of the surface of the cell body. Power density = 0. 60 mW/μm2, pulse duration = 30 ms), (b-c) Shaped excitation pattern covering whole cell generates light activated trains of APs at 5 (3/3 trials), 10 (2/2 trials) and 15 Hz (0/2 trials) (c) and sustained depolarization and repetitive firing during a 1s pulse (d). Scale bars: 20 μm. Photoactivation was performed at λexc = 920 nm, through a 40×, 0.8 NA objective.
From these results we conclude that 2P TF-GPC generates sufficiently large ChR2 photocurrents to reliably evoke APs in primary neuronal cultures at excitation densities well below the damage threshold31.
Shaped 2P excitation in cortical brain slices
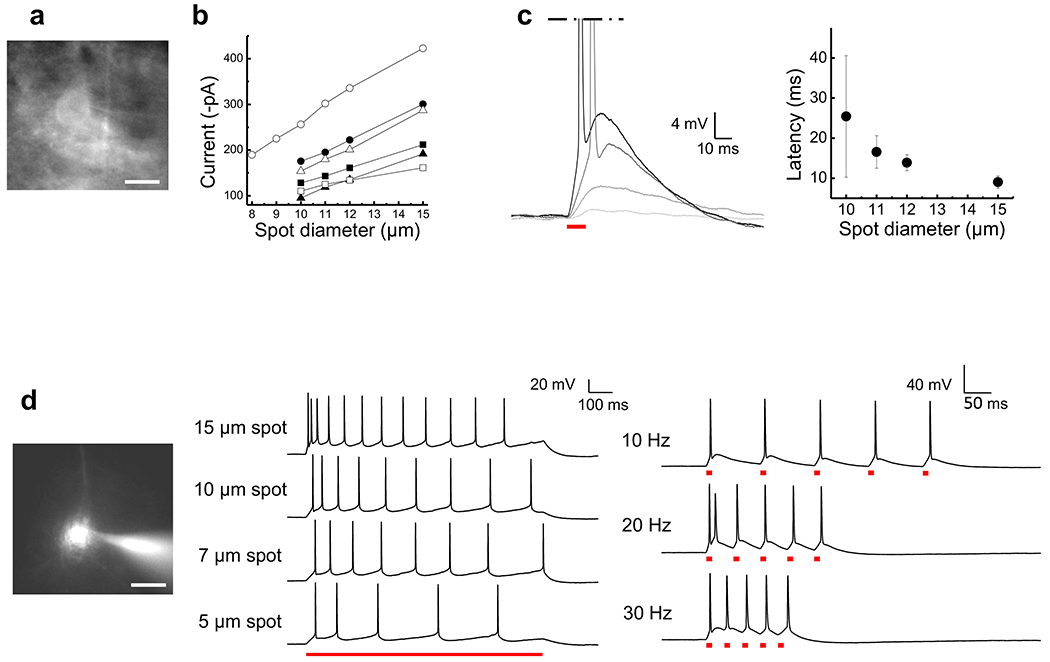
To explore the efficiency of TF-GPC in brain slices, we used coronal slices of somatosensory cortex from Thy1-ChR2-YFP transgenic mice, in which wild type ChR2 is expressed in pyramidal neurons of cortical layer V7. Wide-field imaging was used to search for YFP-ChR2 positive cells (λexc = 488 nm, bandwidth 5 nm) and the fluorescence or transmission images were used to design and locate the excitation spot (Fig. 5a). Alternatively, for a patterning precisely shaped on cell or dendritic morphology we increased contrast and definition in primary fluorescence images by filling individual neurons with Alexa 594 through the patch pipet and imaging in wide-field (λexc = 590 nm, bandwidth 10 nm) (Fig. 5d, left). Most tested neurons (13/14) responded with an AP to a 10μm excitation spot (0.30 - 0.52 mW/μm2, pulse duration 10 ms, λexc = 920 nm, depth of 40-60 μm). To define the exact threshold for AP generation, we stimulated neurons with excitation spots of increasing diameter: the average threshold was 9.8 ± 0.8 μm (n = 9). The amplitude of the photo-currents increased (Fig. 5b) and the latency to the AP decreased (Fig. 5c) as the diameter of the excitation spot increased. Similar trends occurred with increasing excitation density (Supplementary Fig. 2).
Figure 5. 2P Photoactivation by 2P TF-GPC in cortical brain slice.
(a) Wide-field fluorescence image of a layer V pyramidal neuron positive for ChR2-YFP. (b) Plot of the peak current (n = 6 cells) as a function of excitation spot diameter, (c) Left: Voltage responses to photoexcitation with spots of increasing size (3, 7, 10 and 15 μm in diameter, light grey to black traces; 0.52 mW/μm2). Right: AP-latency as a function of excitation spot diameter (n = 7 cells), (d) Left: Wide-field fluorescence image of cell body loaded through the patch pipet with the fluorescent indicator Alexa 594. Middle: AP trains evoked by 1s light pulse with increasing excitation spot size. Average frequencies were: 11.8 ± 0.8 Hz (6 trials) for a 15 μm spot, 8.7 ± 0.3 Hz (3 trials) for a 10 μm spot, 7.7 ± 0.3 Hz (3 trials) for a 7 μm spot and 4.8 Hz ± 0.3 (4 trials) for a 5μm spot. Right: APs evoked by trains of 10 ms light pulses at increasing frequency (15 μm excitation spot). Example of AP firing following light stimulation at 10 Hz (5/5 trials), 20 Hz (5/5 trials) and 30 Hz (4/11 trials) (0.40 mW/μm2). Scale bars: 20 μm. Photoactivation at λexc = 920 nm, through a 40×, 0.8 NA objective.
Increasing the illumination area during a sustained (1-s long) light pulse (~0.40 mW/μm2) increased AP firing (Fig. 5d, middle), reaching up to a spiking rate of 15 Hz (11.8 ± 0.8; 6 trials) for an excitation spot of 15 μm, which covered most of the cell body. Stimulation with a train of brief light pulses (10 ms; 0.40 mW/μm2; spot of 15 μm) evoked AP trains at 10 Hz or greater (of 6 cells, three reached 10 Hz, two reached 20 Hz and one reached 30 Hz; Fig. 5d, right).
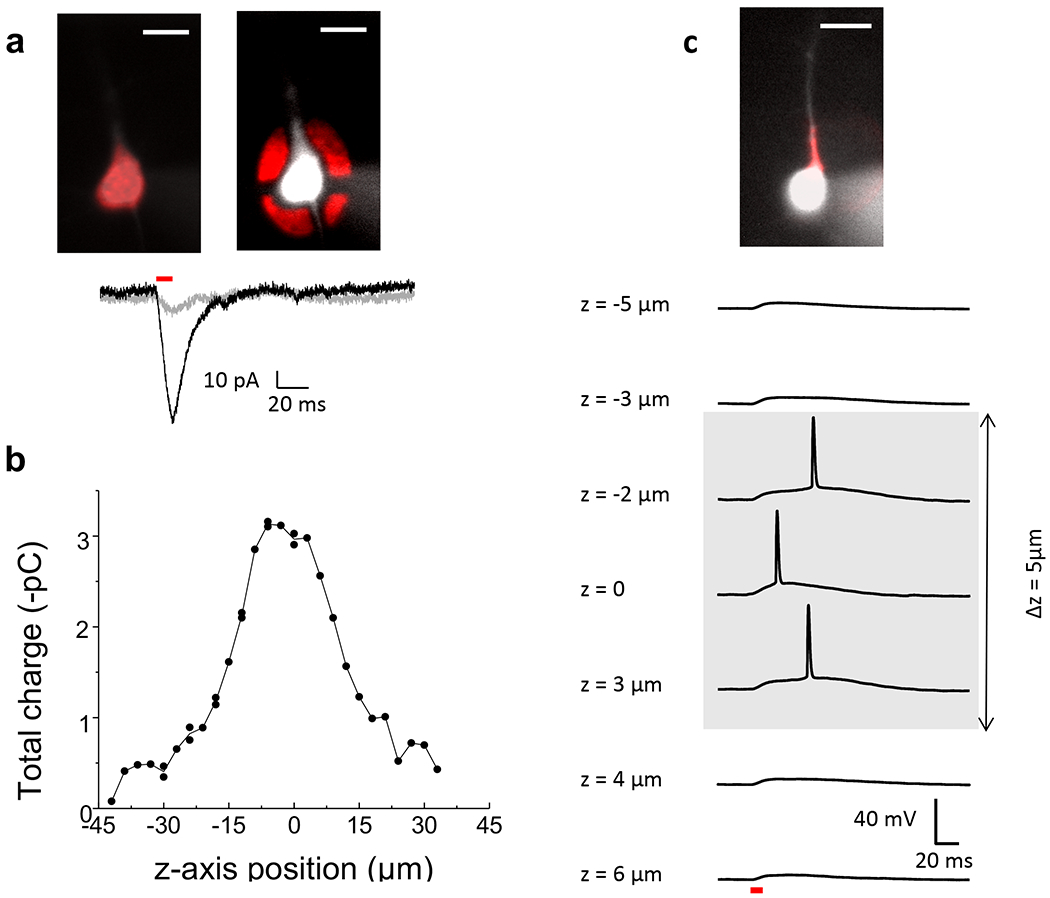
Finally, we tested the ability of TF-GPC to confine the 2P excitation laterally and axially in the greater depth and more scattering medium of the cortical slice. To test the lateral precision, we compared the photo-current evoked by an excitation shape covering the whole cell (Fig. 6a, top left) to one evoked by an illumination area that covered the space surrounding the cell (antishape) (excitation density of 0.24 mW/μm2; λexc = 920 nm, pulse duration = 10 ms) (Fig. 6a, top right). The shape-evoked current was 5 - 8 fold larger than that evoked by the anti-shaped excitation in two different cells (ratio between anti-shape and shape evoked currents respectively 13 and 14%). One example is given in Figure 6a (bottom). This demonstrated an x-y axis contrast almost as sharp as what we observed in monolayer cultures (Fig. 3b).
Figure 6. TF-GPC provides lateral and axial precision in ChR2 activation in brain slice.
(a) Top: Fluorescence images of a ChR2-YFP positive neuron filled with Alexa 594 and superimposed excitation patterns (red) with shaped (left) and anti-shaped (right) profiles. Bottom: corresponding photocurrents evoked by shaped (black) and anti-shaped (grey) excitation (10 ms laser pulses, 0.24 mW/μm2). (b) Integrated photocurrent evoked by a 10 μm excitation spot centered on the cell body when displaced along z-axis in a ChR2-YFP positive neuron (0.30 mW/μm2). (c) Top: Fluorescence image of a ChR2-YFP positive neuron filled with Alexa 594 with superimposed shaped excitation profile covering the apical dendrite (red). Bottom: Photodepolarizations evoked by the excitation shape at different z-axis positions (10 ms pulse, 0.30 mW/μm2). Scale bars: 20 μm. Photoactivation at λexc = 920 nm, through a 40×, 0.8 NA objective.
To evaluate the capability for optical sectioning of TF-GPC in brain slices, we created an excitation spot on the cell body and advanced it axially in steps of 2 μm over a range of 70 μm in depth and recorded the photo-currents (Fig. 6b). The integrated current dropped off at focal positions above and below the cell body (FWHM = 25.8 ± 2.6 μm, n=5). The drop off was less steep than in monolayer cultures (Fig. 3c), perhaps due to a smearing of the axial resolution induced by the scattering media and to dendritic or axonal processes of the cell that were located above or below the cell body, which were not resolved over the background in wide-field epi-fluorescence imaging at a depth of 50 μm. Even so, the results show that the peak energy could be focused over a depth that approximately corresponds to the diameter of a cell body.
The micrometer axial resolution of TF-GPC allows targeting a single cell process so that AP could also be evoked with an illumination shape generated to selectively excite one or few dendritic segments, without stimulating the cell body (Fig. 6c, top and Supplementary Fig. 1c, d). Dendritic selectivity was demonstrated by moving the focal plane of the illumination shape below and above the dendritic segment and recording the corresponding signal in voltage and/or current clamp. One example in current clamp recording is shown in Figure 6c (bottom): the ability to evoke an AP was restricted to an axial distance of 5 μm. Here I will add the shape antishape once I see the figure
Thus, TF-GPC is able to target 2P excitation of ChR2 with sufficient three dimensional precision and intensity to excite neurons with short pulses of light in intact brain slice, even when stimulating only sub-regions of the cell body or dendrite. This encourages us to conclude that the system should also work in vivo.
Light spots over multiple cells retain sufficient power to trigger APs in cortical slice
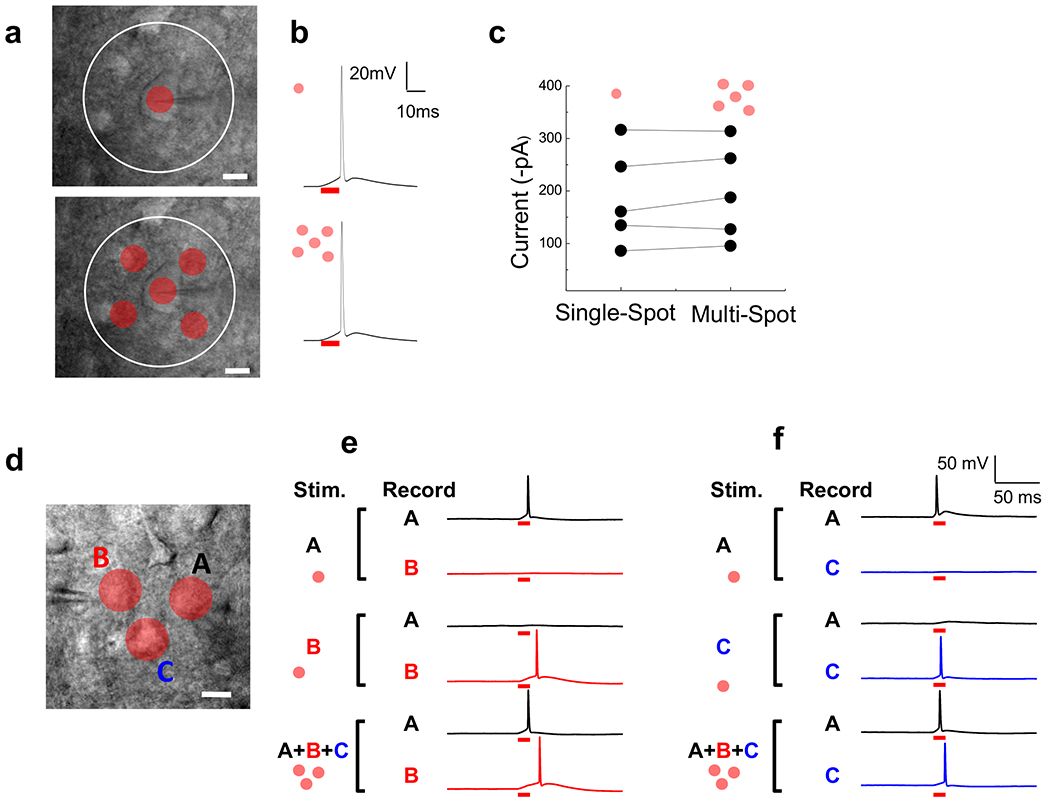
One of the attractions of our method for GPC light patterning is the ability to rapidly and automatically create excitation shapes not only for complex geometries of subcellular compartments, as shown so far (e.g. Fig. 2a), but also for the simultaneous excitation of multiple cell processes and multiple cells. We designed the TF-GPC setup in such a way that the excitation density is maintained at a constant value, independent of the size of excitation area or the number of spots (see Methods and Supplementary Fig. 5). This avoids an attenuation of the intensity with the addition of spots and maintains the potency of each of the multi-spot illumination areas to stimulate a photocurrent of sufficient magnitude to fire APs. To test the efficacy of multi-spot illumination for the simultaneous excitation of different cells, we compared photocurrents (in voltage clamp) and photo-depolarizations (in current clamp) recorded in single pyramidal neurons in the cortical slice in response to stimulation with a single excitation spot over the patched cell with the same spot accompanied by additional identical spots placed elsewhere in the slice at locations that, themselves, evoked no response in the cell (Fig. 7; ~0.30 mW/μm2; n=5 cells). We compared excitation with a single spot excitation to excitation with 3 simultaneous spots of 12 μm diameter (n = 4) or 5 simultaneous spots of 11 μm diameter (n = 1), depending on the geometry of the recorded neuron and on its location within our excitation field (60 μm diameter, white line in Fig. 7a). In keeping with the uniform excitation density design, photo-depolarization and AP triggering were the same whether the spot over the cell was excited alone, or along with 2 or 4 additional spots at the same time (n = 5 out of 5 cells; 3/3 trials for each cell) (Fig. 7b). Similarly, the amount of photo-current recorded in the single cell did not differ between single spot and multi-spot illumination (n=5; paired t-test, p >> 0.05, Fig. 7c).
Having demonstrated that there is no attenuation of the power to excite a single cell by the addition of more illumination spots elsewhere on the cortical slice we sought to directly demonstrate that the activity of more than one cell could be controlled at one time. We did this by performing double recordings in which two ChR2 positive neurons in the cortical slice were patch clamped at one time. A spot over neuron A triggered an AP in that neuron and sometimes a small subthreshold response in neuron B. On the other hand, a spot over neuron B only triggered an AP in neuron B (Fig. 7d, e). When the two spots were illuminated simultaneously both neurons fired (Fig. 7e).
Finally, we asked whether multi-spot illumination could be used to evoked graded increases in dendritic excitation of a neuron, to mimic summed excitation by multiple presynaptic inputs. Pyramidal cells were patch clamped in voltage clamp mode and optically stimulated with shaped spots placed on their thin basal dendrites and/or on their large diameter apical dendrite. The photo-evoked currents for the individual dendrite excitation were compared to those evoked by simultaneous photostimulation. In all cases (5/5) the photostimulation of an additional dendrite increased the size of the response (Supplemental Fig. 8).
These results demonstrate that shaped TF-GPC excitation enables efficient in-depth photoactivation of ChR2 in 2P, which can drive on or more neurons to be fired separately or together..
DISCUSSION
A central goal of neuroscience is to elucidate how the activity of specific neurons and the neuronal circuits in which they are embedded affects behavior. The advent of optogenetics has made it possible to address this problem by purely optical means, using genetically encoded fluorescent reporters to measure neuronal activity and light-controlled signaling proteins, such as channels, receptors and enzymes, to manipulate neuronal activity. To capitalize on the tools of optogenetic manipulation of activity, there is a need for flexible optical methods to generate precise, quickly reconfigurable and depth-resolved light patterns with micrometer spatial resolution and millisecond temporal resolution. The bulk of the work with light-gated proteins has so far been based on 1P excitation delivered in large illumination areas with a large spread along the z-axis, meaning that it is hard to activate a neuron exclusively without simultaneously exciting neurons and processes lying above or below it. Because of its sharp confinement along the z-axis, and the greater penetration depth, there would be a significant benefit in using 2P excitation to activate light-gated proteins to stimulate specific subsets of neurons or distinct subcellular compartments. However, most of the light-gated proteins to date are membrane proteins and this means that conventional 2P excitation in one spot may not activate enough proteins to evoke the desired physiological effect. This challenge is particularly obvious for the most broadly used of the optogenetic manipulation tools: the light-gated excitatory channel ChR2, which has a small single channel conductance and may require excitation of a membrane area much larger than the one excited by a typical 2P excitation volume. Lengthening the pulse duration or increasing laser intensity does not solve this problem because the maximum pulse duration is limited by the deactivation time of ChR2 and the utility of increasing laser intensity is limited by the saturation of ChR2 and cell photodamage31.
Here, we have proposed a new method for the 2P excitation of light-gated proteins and applied it to ChR2. Our approach uses a unique combination of the interferometric phase visualization technique of GPC, for lateral light control, and the TF scheme for the control of axial (z-axis) resolution. We show that this combined TF-GPC approach can generate speckle-free, dynamically reconfigurable light patterns, with a pattern-independent axial resolution equal to that achievable with a conventional line-scanning 2P microscope. The TF-GPC approach enables us to generate ChR2 photo-currents in cultured cells, whose amplitudes can be precisely modulated by controlling the size and shape of the excitation volume. These currents can be modulated to trigger either brief depolarizations that evoke single APs, which can achieve reasonably high spiking rates, or prolonged depolarizations that evoke AP trains. The shaped 2P photoactivation of ChR2 works both in cultured cortical neurons and in brain slices from transgenic mice. It permits the selective excitation of subcellular compartments, such as part of the cell body or a segment of dendrite. Moreover, it makes it possible to shine the light at multiple spots at the same time, a feature that would permit the simultaneous excitation of genetically related cells to test their circuit interaction. Repeated 2P photoactivation at intensities sufficient to drive neurons to fire APs does not induce visible cell damage.
The experiments in brain slices were done at a maximum depth of about 60 μm. The main factor limiting the working depth was the quality of fluorescence imaging in wide field epi-fluorescence. An experimental setup with two independent laser sources combining 2P TF-GPC photoactivation with 2P imaging would overcome and permit much deeper in vivo photoactivation.
Compared to DH, TF-GPC has four main advantages. First, it allows generation of speckle-free intensity patterns, enabling functional mapping by photoactivation of fine sub-cellular structures. Second, the generated wave-front in GPC has a spatially smooth output phase (Supplementary Fig. 3), providing the optimal conditions for attaining the limiting axial resolution of TF, i.e., the one of a conventional line-scanning 2P microscope17, 29. In contrast to this, the rapid spatial phase fluctuations inherent to intensity patterns generated by phase-holograms directly interfere with the geometrical dispersion induced by the TF-grating19 and degrades the depth of focus. Third, as a phase to intensity mapping approach, GPC requires virtually no computational time32 (a phase profile is generated in less than 30 ms).
Finally, since GPC can be implemented with binary half-wave modulating input phase patterns without compromising light efficiency (Supplementary Note 1 and Supplementary Fig. 4) one can benefit from low phase stroke devices, such as ferroelectric high refresh rate (kHz) spatial modulating devices. In contrast to this, the DH approach requires a plurality of grey phase levels to maintain light efficiency since a binary input phase representation of a DH inherently diffracts 60% of the illuminating light into the zero- and spurious orders. The use of high frame rate devices is of particular relevance for dynamically patterned excitation. In this case sequential excitation can be performed by pre-calculating the phase profiles corresponding to a defined series of excitation patterns and by sequentially addressing them on the SLM with a frequency limited only by the refresh rate of the spatial light modulator in use. This may make it possible to analyze how circuits of neurons change their interactions depending on the timing of their activity due to learning rules defined by spike timing dependent plasticity.
However, it is important to note that in 1P-GPC, in which it is not possible to explore TF, the axial propagation of a beam would look similar to the one shown in Figures 2c-d. Therefore, for 1P applications requiring optical sectioning, DH is likely the most suitable choice having the further advantage of allowing 3D spot generation otherwise not directly achievable in conventional GPC using a single SLM.
It is worth comparing TF-GPC with two other approaches that have been employed recently for patterned photoactivation. The first of these is the Digital Micromirror-based Device33–35 (DMD). A DMD spreads the exciting light over a mirror array and pattern the light by redirecting out of the field of view light pointing toward the regions one wants to be dark. This approach has the advantage of simplicity and fast switching rates and preserves a flat incident beam wave-front, permitting optimal axial resolution to be obtained if combined with TF. However, the DMD approach suffers from a low diffraction efficiency inherently attributed to amplitude modulation (Supplementary Note 1 and Supplementary Fig. 4), and requires a fine adjustment of the optical alignment for each modification of excitation wavelengths. In contrast, with DH and GPC, based on phase modulation solely, most of the power of the light source is focused onto the desired region of interest. The second alternative is the use of fast scanning devices, such as galvanometric mirrors16, 36–38 or acousto-optic deflectors 39, which can be used to scan a single spot that utilize most of the laser intensity over a large excitation area. However, the scanning and residence time necessary in scanning approaches limit the maximum area that can be excited within the ChR2 decay time (~10ms) and makes excitation of multiple cells extremely difficult. The residence time can be reduced (and, thus, the temporal resolution improved) by increasing the excitation power, however this results in a stark (up to 10-fold) deterioration of lateral and axial resolution due to the strong contribution of the out-of-focus light to the evoked responses.38
In the case of acousto-optic deflectors, additional drawback is that scanning 2P beams requires compensation for pulse broadening and chromatic aberrations; these effects are negligible for the case of a beam reflected by a LCOS-SLM as employed in our TF-GPC method (the laser pulse duration after reflection on the LCOS-SLM was 140 fs, measured with an autocorrelator18).
Finally it should be mentioned that alternatively to the use of TF-GPC, a Gaussian beam focused as a large spot straight onto the diffraction grating could also produce efficient two-photon activation with the optimal axial resolution of TF38. However, this approach requires regulation of the optical path for any adjustment in the excitation spot size and is limited to a fixed size circularly shaped excitation area, so that it does not allow dynamical selection of a specific subset of cells or a specific sub-region of a cell process, as is possible with TF-GPC.
In summary, TF-GPC can efficiently generate 2D sectioned illumination areas that are rapidly and automatically sculpted to cover a subset of cells and cell processes, sub-regions of a fluorescently imaged neuronal cell body or dendrite. The optical stimulation can be achieved with millisecond temporal resolution and low excitation power. Although we have not yet explored these configurations, GPC also offers the possibility of alternative illumination configurations such as dark spots40, gray level projections41, and multi-colored patterns42 or it can be merged with the functionalities found in optical correlators into the so-called mGPC (matched filtering GPC)43 technique to achieve the full range of desirable light shape sizes from diffraction limited spots up to extended sized patterns.
In comparison to TF-DH, the previously established method with the most similar properties, TF-GPC generates speckle-free patterns with a two-fold improvement of the axial confinement and faster update rates of the desired light patterns. However, TF and conventional GPC offers less flexibility in tuning the spot size over a large range, e.g. from a diffraction-limited spot to a several micrometer-sized spot. An interesting approach to be tested, that can combine the advantages of DH with those of GPC, could be to generate excitation patterns by simultaneous control of amplitude and phase modulation44.
Although, here we have demonstrated the strength of TF-GPC illumination for 2P excitation of ChR2, these results could also pave the way for efficient 2P excitation of other light-gated channels, such as the recently developed mutant of ChR2, ChetA3, halorhodopsin45, Arch46 and LiGluR6, for which 2P photostimulation has not yet been reported. Moreover TF-GPC can be used for other probes, such as caged compounds and genetically encoded photoactivatable proteins47 and photoactivatable fluorescent proteins48.
METHODS
Generalized Phase Contrast (GPC) and temporal focusing of ultra-short pulses for photoactivation.
The optical setup for photoactivation experiments (Fig. 1) was built around a commercial epi-fluorescence upright microscope (Olympus BX50WI). A mode-locked Ti:Sapphire laser was used as the light source, which in the case of photoactivation of ChR2 in HEK cell and double patch experiments was a Tsunami oscillator pumped by a 5 W Millennia Pro s-Series CW laser (λ = 532 nm) (Spectra-Physics, Inc.), operating at 850 nm (Δλ = 11 nm, output power = 700 mW), while in the other cases a Mai Tai laser operating at λ = 920 nm (Δλ = 11 nm, output power = 1.85 W) was used, kindly provided by Spectra-Physics, Inc. France for a short period during the needs of the experiment. In all cases the output beam power was controlled by a liquid crystal variable phase-retarder (Meadowlark Optics, LRC-200-IR1) combined with a polarizer cube (Meadowlark Optics, BB-050-IR1).
The generation of two-photon arbitrary excitation patterns was realized by using the GPC method23 via the use of a reconfigurable Liquid Crystal on Silicon Spatial Light Modulator (LCOS-SLM) (Hamamatsu Photonics X10468-02), illuminated at oblique incidence by the expanded laser beam (5×). The device is controlled by custom-designed software20 that, given a target intensity distribution at the focal plane of the microscope objective converts (in ~ 30ms) the intensity map, A(x,y), into a binary phase map, Aϕ(x,y)slm and addresses (in ~15 ms) the output profile to the SLM. The target intensity distribution is typically obtained by selecting on the fluorescence picture a region of interest (ROI) and automatically generated by the software using threshold detection in the selected ROI. The total time for acquiring the fluorescence image and generating the ROI is approximately 1 s. This time need not slow the experiment, since a series of ROIs can be made during setup, in advance of recording.
The beam reflected from the SLM is separated in its Fourier components by a 400 mm focal length achromatic lens (L1) and focused on the phase contrast filter (PCF), positioned at the Fourier plane of the lens. An iris is placed in front of the SLM, whose radius (Rc = 5 mm) was adapted to optimize the contrast of the output intensity distribution. The on-axis, low spatial frequency components are shifted in phase by the PCF and then, the second 300 mm achromatic lens (L2) recombines the high and low spatial frequency components. The introduced phase shift causes the different components to interfere and produce an intensity distribution according to the spatial phase information carried by the higher spatial frequencies. The lens L (f = 500 mm) (Fig. 1) and the microscope objective (Olympus, LUMPLFL60XW/IR 60×, NA=0.9 or LUMPLFL40XW/IR; 40×, NA=0.8) form the second 4-f lens system that scales the intensity distribution (~1/110) on the sample plane, via a dichroic mirror (Chroma Technology 640DCSPXR).
The PCF is selected from a patterned phase mask, fabricated by depositing a photo-resist on a glass optical flat (DanChip, Technical University of Denmark) containing circular pits of variable diameter (from 4 to 100 μm) arranged in a squared array of 10×10 filters, which provide a half-wave phase shift in the wavelength range 850-950 nm. The radius, R1, of the filter was chosen in order to obtain optimal phase contrast together with a reasonable excitation field. In our experimental conditions the radius R2 of the main lobe of the Airy profile of the synthetic reference wave focused at the PCF plane (measured with a wave-front analyzer CCD camera; SID4-028, PHASICS S.A.) was 45 μm and 50 μm at 850 nm and 920 nm, respectively. Therefore, with a PCF of 27.5 μm we had a value for the η term, which relates the radius R1 of the PCF to R249, of η = 0.61 or 0.55. These η values gave in each case a good contrast with a circular excitation field of 60 μm in diameter (Supplementary Note 1 and Supplementary Fig. 4).
In order to have optimal contrast conditions in GPC, for binary 0/π-phase input modulation, the phase-shifting area, Aπ, on the SLM should cover around ¼ of the illuminated surface of the SLM, Aslm, that is F = Aπ/Aslm) = Aπ/(Aπ+A0) = 0.2542, where Aπ and A0 are the numbers of pixels at the SLM addressed with phase π and 0, respectively. To always fulfill this condition, no matter of the selected excitation shaped area at the sample plane, a ring of area A(ring), surrounding the desired shape, was added by the software to the LCOS-SLM phase pattern (Supplementary Figure 5). The thickness of the ring was adjusted so that the total phase-shifting area Aπ(tot) = Aπ(spot) + Aπ(ring) was always around ¼ of the illuminated surface of the SLM, Aslm. The external diameter of the ring was adjusted to the size of the circular aperture placed in front of the SLM. As a result, the laser power at the output plane was distributed between the ring and the excitation shaped area in such a way, that excitation density in the excitation spot had approximately the same value, independently of its size.
For TF, a blazed reflectance grating (830 lines/mm) was placed at the focal plane of the L2 lens, in order to geometrically disperse the frequencies of the ultra-short laser pulses and temporally focus the beam on the sample plane. An illumination angle of 40.5° was chosen, such that the central frequency of the +1 order beam diffracted by the blazed grating (~80% of the incident beam) was directed along the optical axis of the microscope while the zero order beam was blocked (for further details concerning the alignment of the grating see Papagiakoumou et al.18). The tilted illumination of the grating caused a horizontal stretching of the original intensity pattern by a factor of cos (40.5°). To compensate for the tilt, the phase pattern was equally preshrunk along the x-direction, at the SLM’s plane (Supplementary Fig. 5). In order to block the ring added to balance the filling factor of the SLM from the excitation field, an iris was placed right after the grating (not shown on the layout for simplicity).
The duration of the laser pulses for photoactivation was controlled by a mechanical shutter (Uniblitz, VCM-D1 Shutter Driver) controlled either by the electrophysiology amplifier (Axon 200B) or by a home made electronic circuit, based on a micro-controller (PIC 18F4550, Microchip), driven by a PC interface through a USB connection. In the last case the circuit synchronized the shutter, based on a trigger pulse sent by the Axon 200B amplifier. The shutter’s rise time was 1.9 ms (Supplementary Fig. 6).
The analysis of the axial propagation of the excitation beam around the objective focal plane was carried out with a “double microscope”, already described in previous works18, 20 using an upper objective 60× (Olympus, LUMPLFL60XW/IR; NA 0.9). The axial resolution of TF-GPC was determined each day of experiment with a fluorescent layer and we always found the same value.
For fluorescence imaging we used a 75-W Xenon lamp passing through a monochromator (Optoscan, Cairn Research). Fluorescence images were collected with a cooled (−30°C) 12-bit CCD camera (CoolSNAP HQ2, Roper Scientific) using a HQ535/50M filter or a HQ640/40M filter (Chroma Technology) as emitting filters.
Electrophysiology and data analysis
All experiments followed European Union and institutional guidelines of the care and use of laboratory animals (Council directive 86/609 EEC).
Cell culture.
HEK 293 cells were plated at approximately 105 cells per 12 mm glass coverslip coated with poly-L-lysine and maintained in DMEM with 5% Fetal Bovine Serum and 0.5% Penicillin/Streptomycin. Cells were transfected with 2μg ChR2-H134R-GFP using ExGen 500 (Euromedex, France). All recordings were performed 24 to 48 hours after transfection, at room temperature.
Primary neuronal cultures.
Dissociated embryonic cortical neurons (E16-17) were plated on poly-L-lysine-coated glass coverslips at a density of 1.5 x 10⁵ cells. Neurons were maintained in MEM supplemented with 5% fetal bovine serum, serum extender (BD biosciences, France) and 0.5% Penicillin/Streptomycin. Ara-C (4 μM) was added after DIV6. Cells were transfected by the calcium phosphate method using 1 μg of ChR2-H134R-GFP per 12 mm coverslip. Recordings were performed 24 hours after transfection, at room temperature.
Slice preparation.
Coronal cortical slices (250-280 μm) were obtained from wild type and Thy1-ChR2-YFP mice12 older than postnatal day 30 (purchased from the Jackson Laboratory (B6.Cg-Tg(Thy1-COP4/EYFP)18Gfng/J strain; Bar Harbor, Maine, USA).
Somatosensory slices were prepared in an ice-cold slicing solution50 containing (in mM): 130 K gluconate, 15 KCl, 0.2 EGTA, 20 HEPES, 25 glucose, 50 μM D-APV and 50 nM minocycline (pH 7.4) and then transferred for 30 s to a recovery solution containing (in mM): 225 D-mannitol, 2.5 KCl, 1.25 NaH2PO4, 26 NaHCO3, 25 glucose, 0.8 CaCl2, 8 MgCl2, 50 μM D-APV and 50 nM minocycline (95% O2, 5% CO2). Before recording slices were incubated for at least 30 min at 33°C in external solution containing (in mM): 125 NaCl, 3.5 KCl, 1.25 NaH2PO4, 26 NaHCO3, 25 Glucose, 2 CaCl2, 1 MgCl2 (95% O2, 5% CO2).
Recordings were performed at room temperature.
Electrophysiology.
Patch-clamp pipets (4-6 MΩ for neurons and 2-4 MΩ for HEK 293 cells) were back-filled with intracellular solutions containing (in mM): 145 CsCl, 10 HEPES, 0.5 CaCl2, 1 MgCl2, 5 EGTA (pH 7.2) for HEK 293 cells; 131 K-gluconate, 10 NaCl, 10 HEPES, 2 MgCl2, 2 MgATP, 1 EGTA (pH 7.4) for neurons in culture and 137 K-MeSO4, 6 NaCl, 5 MgCl2, 0.05 EGTA, 10 HEPES, 4 K2ATP, 0.4 GTP-Na2 (pH 7.3) for brain slices. In some recordings, 10 μM Alexa 594 (Invitrogen Molecular probes, CA, USA) were added to the patch-clamp internal solution for morphological reconstruction.
External solutions contained (in mM): 135 NaCl, 5.4 KCl, 10 HEPES, 1.8 CaCl2, 0.9 MgCl2, 10 glucose (pH 7.6) for HEK 293 cells; 138 NaCl, 3 KCl, 5 HEPES, 2.5 CaCl2, 1.2 MgCl2, 10 glucose (pH 7.4) for neuronal primary cultures. For slices, the same external solution as the one described above for incubation was used for recording.
HEK cells were maintained at −40 mV and hyperpolarized to −60 mV just before recording light-induced currents. Cultured neurons and pyramidal neurons in brain slices were clamped at −60 mV and −77 mV respectively. Current clamp recordings were adjusted so that the resting potential was around −60 mV (cultured neurons) or −67 mV (neurons in slices) with current injections inferior of 100 pA. All presented data were already corrected for liquid junction potentials of −10 mV (K gluconate solution) and −7 mV (KMeSO4 solution) for cultured neurons and brain slices respectively. Currents were recorded with an Axon 200B amplifier, filtered at 10 kHz, and digitized at 10 kHz using a Digidata board (Axon instruments, CA, USA) and Clampex software (Axon Instruments, CA, USA). D-APV was purchased from Tocris Bioscience (MO, USA); all other chemicals were purchased form Sigma (France).
Description of double patch experiment
Data analysis.
Data analysis was performed using either the Clampfit analysis software (Axon Instruments, CA, USA) and custom routines within the Igor Pro environment (Wavemetrics, OR, USA) or in Origin 8.0 (OriginLab, MA, USA). Statistical data are reported as mean ± sem.
The significance was calculated using paired Student’s /t/ test.
Photodamage assessment protocols.
In slices, photostimulation of pyramidal neurons with twenty 10 Hz trains of 50 ms pulses every 10 s (0.44 mW/μm2) or with thirty 400 ms pulses at the maximum excitation power (0.53 mW/μm2) did not induce visible cell damage. Neurons were still alive and able to fire APs at the end of each protocol (data not shown).
In the same preparation, illumination protocols similar to those used in Fig. 5 and 6 elicited no response in ChR2 positive neurons if a block was inserted in the excitation path preventing the laser light from reaching the preparation, or in ChR2 negative neurons.
Supplementary Material
ACKNOWLEDGMENTS
We thank Ivan Perch-Nielsen for the PCF layout design produced by DanChip at the Technical University of Denmark, Karine Herault for neuronal culture preparation, Kathleen Zylbersztejn for providing HEK 293 cells and Eric Schwart for genotyping ChR2-YFP mice. We also thank Dan Oron, Darwin Palima, Cathie Ventalon, Stéphane Dieudonné, Marco Diana for helpful discussions, Jack Feldmann for critical reading of the paper, Spectra-Physics, Inc. for loan of the high-power laser and Phasics S.A. for providing the phase-analyzer software. This work was supported by the ESF and the CNRS through the EURYI program, by the European Commission FP6 Specific Targeted Project “PHOTOLYSIS” LSHM-CT-2007-037765, by the European Commission Coordination Action ENINET (contract number LSHM-CT-2005-19063)”, FA was supported by a fellowship from the European doctoral school “Frontières du Vivant”. AB was supported by a doctoral fellowship from Ecole des Neurosciences de Paris (Paris School of Neuroscience). JG acknowledges the support by the Danish Technical Scientific Research Councils (FTP) via the framework grant number 09-060742/FTP. EI was supported from the Nanomedicine Development Center for the Optical Control of Biological Function (NIH PN2 EY018241), NSF-FIBR and the Ecole de Neuroscience de Paris (Paris School of Neuroscience). EI and CE were supported by Human Frontier Science Program (RGP0013/2010).
REFERENCES
- 1.Scanziani M & Hausser M Electrophysiology in the age of light. Nature 461, 930–9 (2009). [DOI] [PubMed] [Google Scholar]
- 2.Nagel G et al. Channelrhodopsin-2, a directly light-gated cation-selective membrane channel. Proc Natl Acad Sci U S A 100, 13940–5 (2003). [DOI] [PMC free article] [PubMed] [Google Scholar]
- 3.Gunaydin LA et al. Ultrafast optogenetic control. Nat Neurosci. [DOI] [PubMed] [Google Scholar]
- 4.Boyden ES, Zhang F, Bamberg E, Nagel G & Deisseroth K Millisecond-timescale, genetically targeted optical control of neural activity. Nat Neurosci 8, 1263–8 (2005). [DOI] [PubMed] [Google Scholar]
- 5.Zhang F, Wang LP, Boyden ES & Deisseroth K Channelrhodopsin-2 and optical control of excitable cells. Nat Methods 3, 785–92 (2006). [DOI] [PubMed] [Google Scholar]
- 6.Szobota S et al. Remote control of neuronal activity with a light-gated glutamate receptor. Neuron 54, 535–45 (2007). [DOI] [PubMed] [Google Scholar]
- 7.Wang H et al. High-speed mapping of synaptic connectivity using photostimulation in Channelrhodopsin-2 transgenic mice. Proc Natl Acad Sci U S A 104, 8143–8 (2007). [DOI] [PMC free article] [PubMed] [Google Scholar]
- 8.Grossman N et al. Multi-site optical excitation using ChR2 and micro-LED array. J Neural Eng 7, 16004. [DOI] [PubMed] [Google Scholar]
- 9.Aravanis AM et al. An optical neural interface: in vivo control of rodent motor cortex with integrated fiberoptic and optogenetic technology. J Neural Eng 4, S143–56 (2007). [DOI] [PubMed] [Google Scholar]
- 10.Gradinaru V et al. Targeting and readout strategies for fast optical neural control in vitro and in vivo. J Neurosci 27, 14231–8 (2007). [DOI] [PMC free article] [PubMed] [Google Scholar]
- 11.Gradinaru V, Mogri M, Thompson KR, Henderson JM & Deisseroth K Optical deconstruction of parkinsonian neural circuitry. Science 324, 354–9 (2009). [DOI] [PMC free article] [PubMed] [Google Scholar]
- 12.Arenkiel BR et al. In vivo light-induced activation of neural circuitry in transgenic mice expressing channelrhodopsin-2. Neuron 54, 205–18 (2007). [DOI] [PMC free article] [PubMed] [Google Scholar]
- 13.Huber D et al. Sparse optical microstimulation in barrel cortex drives learned behavior in freely moving mice. Nature 451, 61–4 (2008). [DOI] [PMC free article] [PubMed] [Google Scholar]
- 14.Lagali PS et al. Light-activated channels targeted to ON bipolar cells restore visual function in retinal degeneration. Nat Neurosci 11, 667–75 (2008). [DOI] [PubMed] [Google Scholar]
- 15.Feldbauer K et al. Channelrhodopsin-2 is a leaky proton pump. Proc Natl Acad Sci U S A 106, 12317–22 (2009). [DOI] [PMC free article] [PubMed] [Google Scholar]
- 16.Rickgauer JP & Tank DW Two-photon excitation of channelrhodopsin-2 at saturation. Proceedings of the National Academy of Sciences of the United States of America 106, 15025–15030 (2009). [DOI] [PMC free article] [PubMed] [Google Scholar]
- 17.Oron D, Tal E, Silberberg Y Scanningless depth-resolved microscopy. Opt. Express 13, 1468–1476 (2005). [DOI] [PubMed] [Google Scholar]
- 18.Papagiakoumou E, de Sars V, Oron D & Emiliani V Patterned two-photon illumination by spatiotemporal shaping of ultrashort pulses. Optics Express 16, 22039–22047 (2008). [DOI] [PubMed] [Google Scholar]
- 19.Papagiakoumou E, de Sars V, Emiliani V & Oron D Temporal focusing with spatially modulated excitation. Optics Express 17, 5391–5401 (2009). [DOI] [PubMed] [Google Scholar]
- 20.Lutz C et al. Holographic photolysis of caged neurotransmitters. Nat Methods 5, 821–7 (2008). [DOI] [PMC free article] [PubMed] [Google Scholar]
- 21.Golan L, Reutsky I, Farah N & Shoham S Design and characteristics of holographic neural photo-stimulation systems. J Neural Eng 6, 66004 (2009). [DOI] [PubMed] [Google Scholar]
- 22.Zahid M et al. Holographic photolysis for multiple cell stimulation in mouse hippocampal slices. PLoS One 5, e9431 (2010). [DOI] [PMC free article] [PubMed] [Google Scholar]
- 23.Glückstad J Phase contrast image synthesis. Opt. Commun 130, 225 (1996). [Google Scholar]
- 24.Zernike F How I Discovered Phase Contrast. Science 121, 345–349 (1955). [DOI] [PubMed] [Google Scholar]
- 25.Rodrigo PJ, Daria VR & Glückstad J Real-time three-dimensional optical micromanipulation of multiple particles and living cells. Opt Lett 29, 2270–2 (2004). [DOI] [PubMed] [Google Scholar]
- 26.Rodrigo PJ, Palima D & Glückstad J Accurate quantitative phase imaging using generalized phase contrast. Opt Express 16, 2740–51 (2008). [DOI] [PubMed] [Google Scholar]
- 27.Glückstad J, Palima D, Rodrigo PJ & Alonzo CA Laser projection using generalized phase contrast. Optics Letters 32, 3281 (2007). [DOI] [PubMed] [Google Scholar]
- 28.Glückstad J & Palima D Generalised Phase Contrast: Application in Optics and Photonics, 146, 310pp, Springer Series in Optical Sciences, (2009). [Google Scholar]
- 29.Tal E, Oron D & Silberberg Y Improved depth resolution in video-rate line-scanning multiphoton microscopy using temporal focusing. Opt Lett 30, 1686–8 (2005). [DOI] [PubMed] [Google Scholar]
- 30.Nagel G et al. Light activation of channelrhodopsin-2 in excitable cells of Caenorhabditis elegans triggers rapid behavioral responses. Curr Biol 15, 2279–84 (2005). [DOI] [PubMed] [Google Scholar]
- 31.Hopt A & Neher E Highly nonlinear photodamage in two-photon fluorescence microscopy. Biophys J 80, 2029–36 (2001). [DOI] [PMC free article] [PubMed] [Google Scholar]
- 32.Palima D & Glückstad J Comparison of generalized phase contrast and computer generated holography for laser image projection. Opt Express 16, 5338–49 (2008). [DOI] [PubMed] [Google Scholar]
- 33.Horneck LJ 128 X 128 Deformable Mirror Device. IEEE Trans. Electron Devices ED-30, 539 (1983). [Google Scholar]
- 34.Wang S et al. All optical interface for parallel, remote, and spatiotemporal control of neuronal activity. Nano Lett 7, 3859–63 (2007). [DOI] [PubMed] [Google Scholar]
- 35.Guo ZV, Hart AC & Ramanathan S Optical interrogation of neural circuits in Caenorhabditis elegans. Nat Methods 6, 891–6 (2009). [DOI] [PMC free article] [PubMed] [Google Scholar]
- 36.Losonczy A & Magee JC Integrative properties of radial oblique dendrites in hippocampal CA1 pyramidal neurons. Neuron 50, 291–307 (2006). [DOI] [PubMed] [Google Scholar]
- 37.Nikolenko V, Poskanzer KE & Yuste R Two-photon photostimulation and imaging of neural circuits. Nat Methods 4, 943–50 (2007). [DOI] [PubMed] [Google Scholar]
- 38.Andrasfalvy BK, Zemelman BV, Tang J & Vaziri A Two-photon single-cell optogenetic control of neuronal activity by sculpted light. Proc Natl Acad Sci U S A 107, 11981–6. [DOI] [PMC free article] [PubMed] [Google Scholar]
- 39.Shoham S, O’Connor DH, Sarkisov DV & Wang SS Rapid neurotransmitter uncaging in spatially defined patterns. Nat Methods 2, 837–43 (2005). [DOI] [PubMed] [Google Scholar]
- 40.Daria VR, Rodrigo PJ & Glückstad J Dynamic formation of optically trapped microstructure arrays for biosensor applications. Biosens Bioelectron 19, 1439–44 (2004). [DOI] [PubMed] [Google Scholar]
- 41.Alonzo CA, Rodrigo PJ & Glückstad J Photon efficient grey-level image projection by the generalized phase contrast method. New J. Phys 9, 132 (2007). [Google Scholar]
- 42.Palima D & Glückstad J Multi-wavelength spatial light shaping using generalized phase contrast. Optics Express 16, 1331–1342 (2008). [DOI] [PubMed] [Google Scholar]
- 43.Glückstad J, Palima D, Dam JS & Perch-Nielsen I Dynamically reconfigurable multiple beam illumination based on optical correlation. Journal of Optics A-Pure and Applied Optics 11, 034012 (2009). [Google Scholar]
- 44.Jesacher A, Maurer C, Schwaighofer A, Bernet S & Ritsch-Marte M Near-perfect hologram reconstruction with a spatial light modulator. Opt. Express 16, 2597–2603 (2008). [DOI] [PubMed] [Google Scholar]
- 45.Zhang F et al. Multimodal fast optical interrogation of neural circuitry. Nature 446, 633–9 (2007). [DOI] [PubMed] [Google Scholar]
- 46.Chow BY et al. High-performance genetically targetable optical neural silencing by light-driven proton pumps. Nature 463, 98–102 (2010). [DOI] [PMC free article] [PubMed] [Google Scholar]
- 47.Wu YI et al. A genetically encoded photoactivatable Rac controls the motility of living cells. Nature 461, 104–8 (2009). [DOI] [PMC free article] [PubMed] [Google Scholar]
- 48.Gray NW, Weimer RM, Bureau I & Svoboda K Rapid redistribution of synaptic PSD-95 in the neocortex in vivo. PLoS Biol 4, e370 (2006). [DOI] [PMC free article] [PubMed] [Google Scholar]
- 49.Glückstad J & Mogensen PC Optimal phase contrast in common-path interferometry. Appl Opt 40, 268–82 (2001). [DOI] [PubMed] [Google Scholar]
- 50.Otsu Y et al. Optical monitoring of neuronal activity at high frame rate with a digital random-access multiphoton (RAMP) microscope. J Neurosci Methods 173, 259–70 (2008). [DOI] [PubMed] [Google Scholar]
Associated Data
This section collects any data citations, data availability statements, or supplementary materials included in this article.