

Abstract
OBJECTIVE
This study aims to describe differences in health care utilization between homeless and nonhomeless minors with diabetes.
RESEARCH DESIGN AND METHODS
Data from the Healthcare Cost and Utilization Project’s Statewide Inpatient Database from New York for years 2009–2014 were examined to identify pediatric patients <18 years old with diabetes. Outcomes of interest included hospitalization rate, in-hospital mortality, admission through the emergency department (ED), diabetic ketoacidosis (DKA), hospitalization cost, and length of stay (LOS). Other variables of interest included age-group, race/ethnicity, insurance type, and year. Multivariate logistic regression models were used for in-hospital mortality, admission through ED, and DKA. Log-transformed linear regression models were used for hospitalization cost, and negative binomial regression models were used for LOS.
RESULTS
A total of 643 homeless and 10,559 nonhomeless patients were identified. The hospitalization rate was higher among homeless minors, with 3.64 per 1,000 homeless population compared with 0.38 per 1,000 in the nonhomeless population. A statistically significant higher readmission rate was detected among homeless minors (20.4% among homeless and 14.1% among nonhomeless, P < 0.01). Lower rates of DKA (odds ratio 0.75, P = 0.02), lower hospitalization costs (means ratio 0.88, P < 0.01), and longer LOS (incidence rate ratio 1.20, P < 0.01) were detected among homeless minors compared with nonhomeless minors.
CONCLUSIONS
This study found that among minors with diabetes, those who are homeless experience a higher hospitalization rate than the nonhomeless. Housing instability, among other environmental factors, may be targeted for intervention to improve health outcomes.
Introduction
In the U.S., about 193,000 people under 20 years old are estimated to have diagnosed diabetes, encompassing ∼0.24% of that population (1). Several studies have shown increasing trends in the incidence of childhood diabetes, both for type 1 and type 2 diabetes (2). The incidence of diabetes may vary by race/ethnicity and socioeconomic status (SES) (3). On the basis of rising incidence, the prevalences of both type 1 and type 2 diabetes have been predicted to increase by 54% from 2015 to 2030 (4).
Diabetes leads to both short-term complications, such as hypoglycemia and diabetic ketoacidosis (DKA), and long-term complications, such as retinopathy, neuropathy, nephropathy, and macrovascular disease. These complications can be successfully reduced by tight blood glucose control (5). However, social determinants of health play a significant role in the success of diabetes management. Disparities across race and SES for diabetes management outcomes have been reported (6–9). Ibáñez et al. (8) reported that patients with the lowest education levels and lowest income levels are less likely to achieve the target hemoglobin A1c. Valenzuela et al. (10) reported that black youth with type 1 diabetes and a low SES were less likely to have a regular health care provider.
Housing status is an important component of the environment in supporting physical, mental, and behavioral health. Homeless minors face challenges in access to age-appropriate and developmentally appropriate services, such as medical, behavioral health, and social services (11). Among homeless minors with asthma, a higher hospitalization rate was observed in comparison with nonhomeless minors (12). Diabetes is another chronic condition that requires a maintenance care plan. Individuals with diabetes must engage in multiple activities for management, including blood glucose monitoring, taking insulin multiple times each day, and correction of low or high blood sugars (13). Nonhomeless minors are more likely to have a stable living environment, which can facilitate parental or guardian support in daily self-care (13,14). Homeless minors endure environment instability and may live alone or with a parent in a shelter, be shuffled between several relatives, or temporarily live in the street when social services are not negotiated in a timely manner. Even with parental guidance in this situation, a young person with diabetes will not maintain good health if unable to carry out the responsibilities for disease management. Homelessness leads to additional challenges in maintaining access to medication and supplies, storing medications, and access to regular health care (15), thereby increasing risk of uncontrolled blood glucose.
Greater susceptibility to uncontrolled blood glucose in homeless minors with diabetes would be expected to increase health care utilization, including emergency department (ED) visits and diabetes-related hospitalizations, at higher levels than the general population. However, as no recent efforts have been reported in quantifying levels of diabetes-related health care utilization among homeless minors, we first aimed to describe basic characteristics of these hospitalizations. Second, we examined differences between homeless and nonhomeless minors in 1) diabetes hospitalization, 2) in-hospital mortality, 3) admission through the ED, 4) DKA, 5) hospitalization cost, and 6) length of stay (LOS). We hypothesized that diabetes hospitalization rates, symptom severity, and admission through the ED would be higher among homeless minors in comparison with nonhomeless minors.
Research Design and Methods
The institutional review board at The Lundquist Institute for Biomedical Innovation at Harbor-UCLA Medical Center approved this study as exempt through determination that it does not meet the federal Department of Health and Human Services definition of human subject research.
The Healthcare Cost and Utilization Project (HCUP) Statewide Inpatient Database (SID) from New York, compiled by the Agency for Healthcare Research and Quality (16) was analyzed for this study, using years 2009 through 2014. SID includes all inpatient discharges from community hospitals in the state.
Patients younger than 18 years of age with a primary diagnosis of diabetes were identified using International Classification of Diseases, 9th revision, Clinical Modification (ICD-9-CM) 250 codes. We also included patients for whom diabetes was the secondary or tertiary diagnosis only if previous diagnostic codes were among those listed in Supplementary Table 1. Homeless patients were identified by their zip code, coded as “H” in the SID, while patients with complete zip codes were defined as nonhomeless (17). The SID has been used in previous studies analyzing health outcomes among individuals experiencing homelessness (18,19).
Population estimates for homeless minors were derived from the U.S. Department of Housing and Urban Development (HUD) 2009–2014 Continuum of Care (CoC) Homeless Populations and Subpopulations Reports, which provide summary information on point-in-time, unduplicated counts of homeless individuals in New York (20). Annual population estimates of homeless minors were calculated based on the total number of reported homeless families with children and the number of unaccompanied children under 18 years of age. The number of children in homeless families was available only after 2013; therefore, we calculated the average number of children per family by dividing the total number of children in homeless families by the number of homeless households with children, using data from the 2013–2014 CoC Homeless Populations and Subpopulations Reports. To estimate the total number of minors in homeless families for years 2009–2012, we multiplied the number of homeless households with children for these years by the average number of children in homeless families for the years 2013–2014. Corresponding population estimates for nonhomeless minors were calculated using census data from the U.S. Census Bureau (21). HUD CoC Homeless Populations and Subpopulations Reports provide the most widely referenced estimates of the homeless population (22,23).
The primary predictor of interest was homelessness. Study outcomes of interest included 1) in-hospital mortality, 2) admission through the ED, 3) DKA, 4) hospitalization cost, and 5) LOS. DKA was identified by ICD-9-CM diagnostic code 250.1.
Other variables of interest included age-group, race, insurance type, and year. Age-group was broken into four categories: 0–4, 5–9, 10–14, and 15–17 years. Race was defined as non-Hispanic white, black, Hispanic, and other, and insurance type was categorized as public, private, self-pay, and other form of insurance.
Statistical Analysis
Demographic data on the patient population were tabulated to compare homeless and nonhomeless patients with variables of interest. Variables included whether patients died during hospitalization, admission through ED, DKA, hospitalization cost, LOS, age-groups, race, sex, and insurance status. Cells with values ≤10 have been masked in accordance with HCUP's Data Use Agreement to protect the privacy of individuals who fall into said categories. Hospitalization costs were estimated by multiplying the total charges provided in SID with hospital-level cost-to-charge ratios available through HCUP (24). To account for inflation, costs were converted to 2015 U.S. dollars using the medical care component of the Consumer Price Index (25).
Hospitalization rates were calculated using homeless population estimates as described above. The number of cases was divided by population estimates for each group and multiplied by 1,000 to represent cases per 1,000 minors. Rates were then compared between homeless and nonhomeless minors using χ2 tests for categorical variables. Rates were further stratified by income quartile for nonhomeless minors. Nonhomeless population estimates by zip code level, which were necessary to calculate the population stratified by income quartile, were available for the years 2011–2014. Therefore, hospitalization rates among homeless and nonhomeless minors are presented for the years 2011–2014 only.
Year trends in hospitalization rates were evaluated for homeless and nonhomeless minors. To test yearly trends, the univariable negative binomial regression model was used in favor of the Poisson model due to overdispersion in data. Year trends in hospitalization rates stratified by diabetes type, i.e., type 1 and type 2 diabetes, were also assessed. For the nonhomeless population, stratified analyses by zip code–level median income quartile were completed. The outcome of total cases was offset by the log-transformed population size for each unit of analysis. Diagnosis codes 250.x0 and 250.x2 account for type 2 diabetes, while diagnosis codes 250.x1 and 250.x3 account for type 1 diabetes, where the x represents numbers from zero to nine. Detailed ICD-9-CM codes for type 1 and type 2 diabetes are presented in Supplementary Table 2.
Multivariable regression models with hospital random effects were used to evaluate the association between homelessness and outcomes, including in-hospital mortality, admission through ED, DKA, hospitalization cost, and LOS. Logistic regression models were used for in-hospital mortality, admission through ED, and DKA. Since the decision to admit patients is not made at the hospital level, hospital random effects were not included when evaluating the association between homelessness and ED admissions (ED level). We could not account for ED random effects, due to a lack of data available in the data set used for the analysis. Hospitalization cost was log-transformed, and linear regression was used to evaluate the association with homelessness. Negative binomial regression was used for LOS. All models were adjusted for age, race/ethnicity, sex, and insurance type.
Akaike information criterion (AIC) for the models with and without a homelessness indicator are presented to demonstrate if homeless status had a meaningful effect on each outcome, after controlling for the effects of the control variables. By showing AIC, we are able to assess whether homelessness has a significant contribution to the explanation of changes in each outcome, or if the changes in each outcome are already accounted for by the control variables.
Sensitivity Analyses
Since low SES is known to be associated with poorer diabetes management outcomes (6–9), the nonhomeless case subjects from the lowest-income neighborhoods was used as a comparison group for evaluation of the association with homelessness.
All analyses used SAS (version 9.4, SAS Institute, Inc., Cary, NC).
Results
In the database, 11,202 patients, with 643 homeless and 10,559 nonhomeless minors, were identified. Homeless patients were significantly older, less likely to be white, and more likely to be female and on public insurance or self-pay (Table 1).
Table 1.
Descriptive statistics of diabetes hospitalizations among homeless and nonhomeless minors in New York
| Variables | Total (n = 11,202) | Homeless (n = 643) | Nonhomeless (n = 10,559) | P value |
|---|---|---|---|---|
| Hospitalization rate (per 1,000 population) | 0.43 | 4.26 | 0.41 | <0.01 |
| For type 1 diabetes | 0.38 | 3.45 | 0.36 | <0.01 |
| For type 2 diabetes | 0.06 | 0.8 | 0.05 | <0.01 |
| Outcome | ||||
| Died | * | * | * | 0.28 |
| Hospitalization cost | $3,951 ($2,531, $6,441) | $3,792 ($2,295, $5,979) | $3,963 ($2,548, $6,504) | 0.34 |
| LOS | 1 (1, 3) | 3 (2, 5) | 2 (1, 3) | <0.01 |
| Admission through ED | 8,623 (76.98) | 533 (82.89) | 8,090 (76.62) | <0.01 |
| Ketoacidosis (ICD-9-CM 250.1) | 6,025 (53.79) | 339 (52.72) | 5,686 (53.85) | 0.58 |
| Age, years | 13 (9, 15) | 13 (10, 16) | 12 (9, 15) | <0.01 |
| Age-group | ||||
| 0–4 years | 965 (8.61) | 34 (5.29) | 931 (8.82) | <0.01 |
| 5–9 years | 2,143 (19.13) | 92 (14.31) | 2,051 (19.42) | <0.01 |
| 10–14 years | 4,525 (40.39) | 278 (43.23) | 4,247 (40.22) | 0.13 |
| 15+ years | 3,569 (31.86) | 239 (37.17) | 3,330 (31.54) | <0.01 |
| Race group | ||||
| White | 4,959 (44.42) | 13 (2.02) | 4,946 (47.00) | <0.01 |
| Black | 2,758 (24.70) | 271 (42.21) | 2,487 (23.63) | <0.01 |
| Hispanic | 2,002 (17.93) | 187 (29.13) | 1,815 (17.25) | <0.01 |
| Other | 1,446 (12.95) | 171 (26.64) | 1,275 (12.12) | <0.01 |
| Sex | ||||
| Female | 6,100 (54.45) | 412 (64.07) | 5,688 (53.87) | <0.01 |
| Male | 5,102 (45.55) | 231 (35.93) | 4,871 (46.13) | <0.01 |
| Insurance | ||||
| Public | 5,221 (46.61) | 529 (82.27) | 4,692 (44.44) | <0.01 |
| Private | 5,396 (48.17) | 12 (1.87) | 5,384 (50.99) | <0.01 |
| Self-pay | 382 (3.41) | 102 (15.86) | 280 (2.65) | <0.01 |
| Other | 203 (1.81) | 0 (0.00) | 203 (1.92) | <0.01 |
| Year | ||||
| 2009 | 1,978 (17.66) | 134 (20.84) | 1,844 (17.46) | 0.03 |
| 2010 | 1,967 (17.56) | 127 (19.75) | 1,840 (17.43) | 0.13 |
| 2011 | 1,921 (17.15) | 105 (16.33) | 1,816 (17.20) | 0.57 |
| 2012 | 1,879 (16.77) | 106 (16.49) | 1,773 (16.79) | 0.84 |
| 2013 | 1,770 (15.80) | 84 (13.06) | 1,686 (15.97) | 0.05 |
| 2014 | 1,687 (15.06) | 87 (13.53) | 1,600 (15.15) | 0.26 |
Data are median (interquartile range) or n (%) unless otherwise specified.
Data are not presented due to small cell size.
The hospitalization rate was overall much higher among homeless minors, with 3.64 per 1,000 homeless population compared to 0.38 per 1,000 nonhomeless population. Among minors with type 1 diabetes, the hospitalization rate among homeless minors was 2.96 per 1,000 compared with 0.34 among nonhomeless patients (P < 0.01). Among minors with type 2 diabetes, the hospitalization rate among homeless patients was 0.68 per 1,000 compared with 0.05 among nonhomeless patients (P < 0.01). A statistically significant higher readmission rate was detected among homeless minors (20.4% among homeless and 14.1% among nonhomeless patients, P < 0.01). When compared with the nonhomeless patients in the lowest income quartile (Table 2), the homeless patients with type 1 and type 2 diabetes had higher hospitalization rates.
Table 2.
Rates of hospitalization per 1,000 population and readmission by homeless and nonhomeless status
| Total | P value* | |
|---|---|---|
| Hospitalization rate (per 1,000 population) | ||
| Total | 0.41 | |
| Homeless | 3.64 | Reference |
| Nonhomeless | 0.38 | <0.01 |
| Nonhomeless by income quartile | ||
| First quartile (lowest) | 0.51 | <0.01 |
| Second quartile | 0.38 | <0.01 |
| Third quartile | 0.38 | <0.01 |
| Fourth quartile | 0.33 | <0.01 |
| Hospitalization rate for type 1 diabetes | ||
| Total | 0.36 | |
| Homeless | 2.96 | Reference |
| Nonhomeless | 0.34 | <0.01 |
| Nonhomeless by income quartile | ||
| First quartile (lowest) | 0.43 | <0.01 |
| Second quartile | 0.33 | <0.01 |
| Third quartile | 0.34 | <0.01 |
| Fourth quartile | 0.30 | <0.01 |
| Hospitalization rate for type 2 diabetes | ||
| Total | 0.05 | |
| Homeless | 0.68 | Reference |
| Nonhomeless | 0.05 | <0.01 |
| Nonhomeless by income quartile | ||
| First quartile (lowest) | 0.08 | <0.01 |
| Second quartile | 0.05 | <0.01 |
| Third quartile | 0.04 | <0.01 |
| Fourth quartile | 0.03 | <0.01 |
| Readmission rate (%) | ||
| Total | 14.48 | |
| Homeless | 20.42 | Reference |
| Nonhomeless | 14.13 | <0.01 |
| Nonhomeless by income quartile | ||
| First quartile (lowest) | 21.74 | 0.61 |
| Second quartile | 15.33 | 0.02 |
| Third quartile | 11.86 | <0.01 |
| Fourth quartile | 9.23 | <0.01 |
P values from χ2 tests comparing homeless versus nonhomeless.
We observed a decreasing yearly trend in hospitalizations among homeless minors (P < 0.01). The stratified analyses by type 1 and type 2 diabetes showed that such a decrease was driven by type 1 diabetes. A significant decreasing trend in hospitalization rate among nonhomeless minors with type 2 diabetes was also observed (P = 0.03) (Fig. 1).
Figure 1.
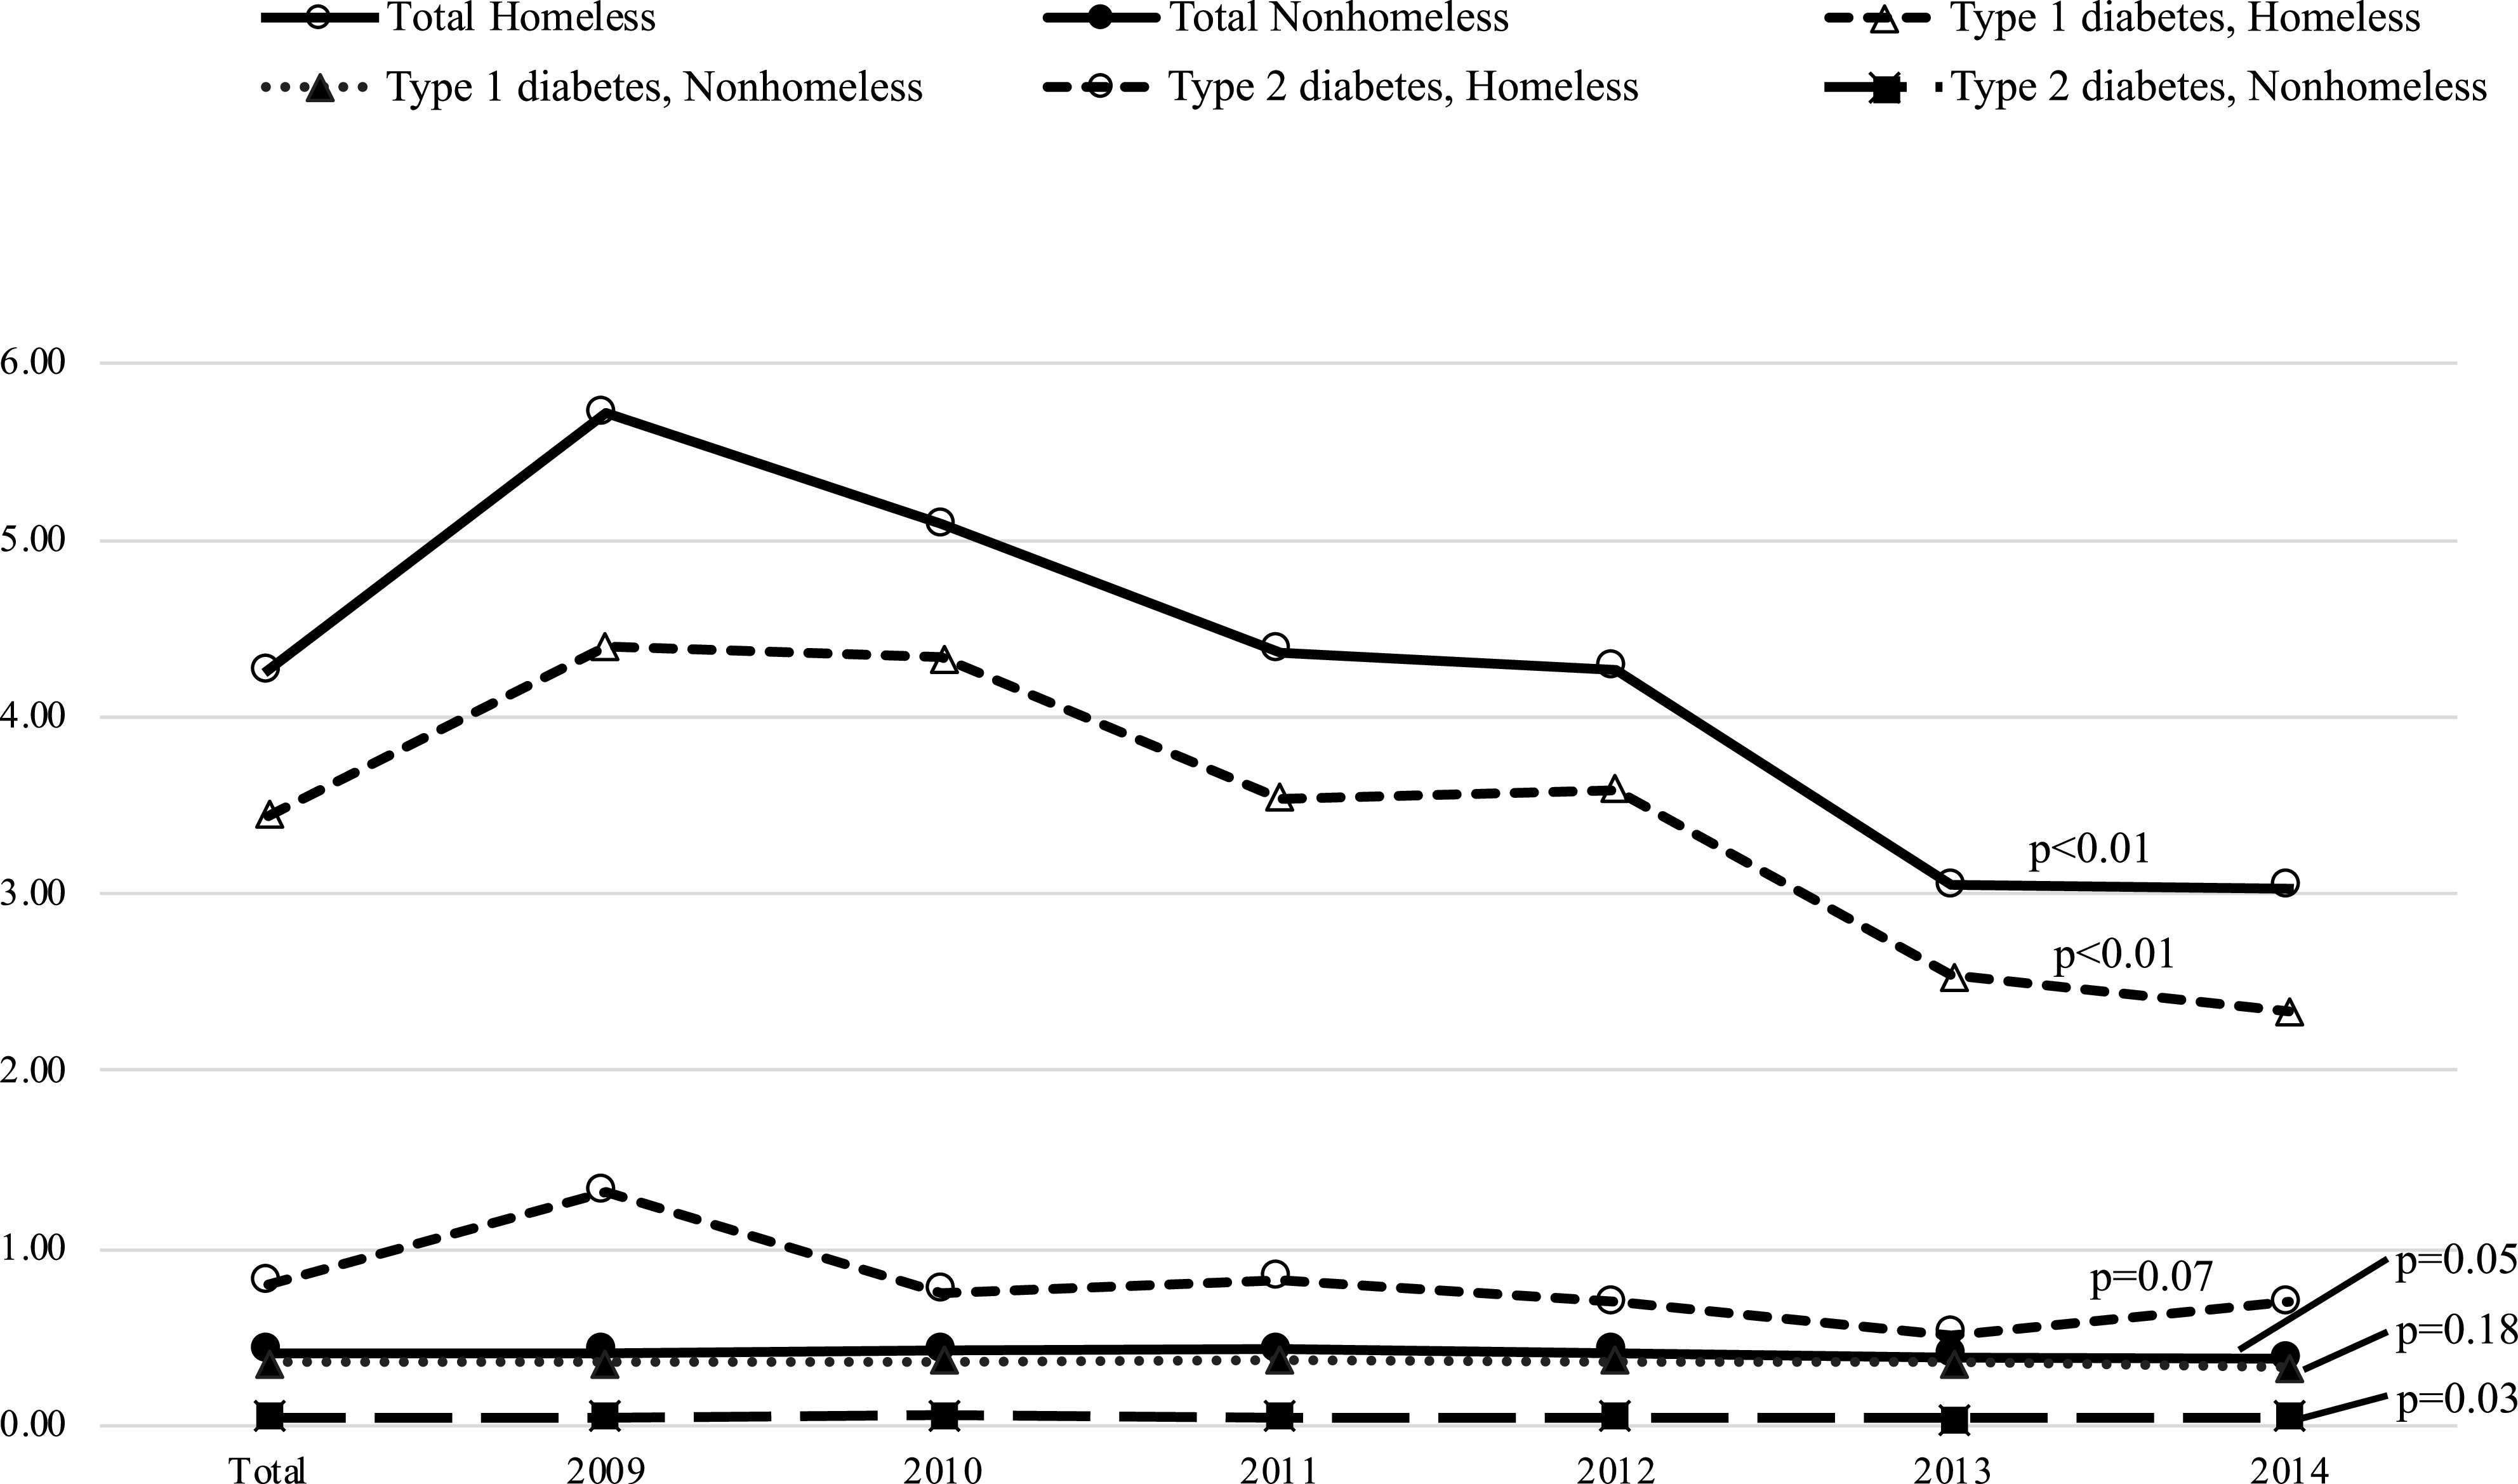
Time trend in prevalence per 1,000 population.
Our adjusted regression models (Table 3) detected a higher odds of admission through ED (odds ratio [OR] 1.54; 95% CI 1.23, 1.91; P < 0.01), lower odds of ketoacidosis (OR 0.75; 95% CI 0.59, 0.96; P = 0.02), lower hospitalization cost (means ratio 0.88; 95% CI 0.79, 0.97; P < 0.01), and longer LOS (incidence rate ratio [IRR] 1.20; 95% CI 1.08, 1.35; P < 0.01 for LOS) among homeless minors compared with nonhomeless minors. For hospitalization cost, the point estimate and CI were back-transformed to represent means ratios and can be interpreted as percent changes, e.g., average hospitalization cost among homeless was 12% lower than that among nonhomeless. The stratified analyses by type 1 and type 2 diabetes showed that such differences in admission through ED (OR 1.88; 95% CI 1.45, 2.43; P < 0.01) and LOS (IRR 1.22; 95% CI 1.08, 1.37 P < 0.01) were mainly driven by type 1 diabetes, while type 2 diabetes drove the difference in hospitalization costs (0.77; 95% CI 0.65, 0.93; P < 0.01). AIC values for the models that included a homeless indicator were all smaller than those without a homeless indicator when the models detected significant associations between outcomes and homelessness, which suggests that the models that included a homeless indicator had better performance (Table 3). Regressions with unadjusted results are presented in Supplementary Tables 3–5.
Table 3.
Adjusted regression results for the effect of homeless versus nonhomeless status on hospital-related outcomes
| Total | Type 1 diabetes | Type 2 diabetes | |||||||||||||
|---|---|---|---|---|---|---|---|---|---|---|---|---|---|---|---|
| E† | 95% CI | P | AIC 1§ | AIC 2‖ | E | 95% CI | P | AIC 1 | AIC 2 | E | 95% CI | P | AIC 1 | AIC 2 | |
| In-hospital mortality¶ | |||||||||||||||
| Homeless | 2.27 | 0.20, 25.28 | 0.51 | 109 | 110 | — | — | — | — | — | — | — | — | — | — |
| Nonhomeless | Reference | Reference | Reference | ||||||||||||
| Emergency admission# | |||||||||||||||
| Homeless | 1.54 | 1.23, 1.92 | <0.01 | 11,947 | 11,934 | 1.88 | 1.45, 2.43 | <0.01 | 10,329 | 10,305 | 0.7 | 0.47, 1.14 | 0.17 | 1,639 | 1,639 |
| Nonhomeless | Reference | Reference | Reference | ||||||||||||
| Ketoacidosis** | |||||||||||||||
| Homeless | 0.75 | 0.59, 0.96 | 0.02 | 14,016 | 14,013 | 0.77 | 0.54, 1.09 | 0.14 | 12,565 | 12,564 | 0.70 | 0.36, 1.34 | 0.28 | 1,387 | 1,388 |
| Nonhomeless | Reference | Reference | Reference | ||||||||||||
| Hospitalization cost†† | |||||||||||||||
| Homeless | 0.88 | 0.79, 0.97 | <0.01 | 21,864 | 21,845 | 1.06 | 0.82, 1.03 | 0.17 | 18,630 | 18,630 | 0.8 | 0.65, 0.93 | <0.01 | 3,200 | 3,190 |
| Nonhomeless | Reference | Reference | Reference | ||||||||||||
| LOS‡‡ | |||||||||||||||
| Homeless | 1.20 | 1.08, 1.35 | <0.01 | 46,279 | 46,270 | 1.22 | 1.08, 1.37 | <0.01 | 39,075 | 39,068 | 1.10 | 0.87, 1.38 | 0.44 | 7,081 | 7,082 |
| Nonhomeless | Reference | Reference | Reference | ||||||||||||
| Type 2 diabetes** | |||||||||||||||
| Homeless | 2.02 | 1.20, 3.38 | <0.01 | 7,525 | 7,520 | — | — | — | — | — | — | — | — | — | — |
| Nonhomeless | Reference | ||||||||||||||
Models are adjusted by age, race/ethnicity, sex, and insurance type.
Estimates (E) are presented as ORs, except LOS, which is presented as an IRR, and hospitalization cost, which is presented as a means ratio.
AIC 1 indicates AIC without homeless indicator.
AIC 2 indicates AIC with homeless indicator.
In-hospital mortality was omitted as an outcome due to ≤10 cases.
Multivariable logistic regression.
Hierarchical multivariable logistic regression.
Hierarchical multivariable log-transformed linear regression.
Hierarchical multivariable negative binomial regression.
The results from the sensitivity analysis assessing differences between homeless minors and low SES minors were consistent with the results of the main analyses (Supplementary Tables 6–8).
Conclusions
This study makes a unique contribution to the existing literature, in which there is scant information on the impact of homelessness on diabetes outcomes among minors. Our study highlights significant differences in diabetes hospitalization rates and associated outcomes between homeless and nonhomeless minors <18 years of age in New York state.
Our analyses indicate that homeless minors experience a much higher diabetes hospitalization rate than nonhomeless minors. The difference was especially prominent among patients with type 2 diabetes, with the homeless hospitalization rate for type 2 diabetes being almost 14 times higher than for nonhomeless minors. Existing literature has found associations between lower SES and a higher likelihood of hospitalizations for diabetes-related reasons (26). Our findings are consistent in demonstrating that the diabetes hospitalization rate among homeless minors was much higher than among minors with homes in the lowest-income neighborhood.
The challenges of home diabetes management involve self-monitoring of blood glucose, taking insulin or other medications, counting carbohydrates, and engaging in regular physical activity. Homeless individuals face additional obstacles in carrying out these self-care activities. Elder and Tubb (27) found that scheduling and logistics made it difficult for homeless patients to arrange regular health care visits. For homeless patient families, the persistent competing priority to identify stable shelter or housing can negatively impact medication adherence and dietary management. Another study reported that nearly 50% of their homeless study sample had uncontrolled diabetes (28). Homeless minors likely focus on meeting basic needs, making it difficult for them to anticipate next steps in health care. Uncontrolled blood glucose would be consistent with increased hospitalizations observed among homeless minors with diabetes.
It is important to note that children and adolescents often rely on a parent or guardian to facilitate medication adherence, carbohydrate counting, and visits to a regular health care provider (13,14). Decreases in health status, such as lapses in glycemic control as well as gaps in regular care, have been observed among patients with diabetes in the transition from pediatric to adult care (29), suggesting that parental supervision promotes adherence and outcomes. Nonhomeless minors likely live with a parent or adult who is involved in the decision-making process to seek hospital care, while homeless minors may or may not receive adult guidance. Our study data lack information about parental support, and therefore, we do not know how this factor may have influenced our findings.
In comparison with the nonhomeless population, homeless minors used health care resources for diabetes-related reasons at a higher rate, with a notably higher readmission rate. Among studies reporting significant associations between homelessness and high rates of health care utilization (30,31), Doran et al. (30) found that half of the homeless patients discharged from a hospital returned within 30 days and were readmitted, which is likely attributable to the stability of their housing situation at discharge. Salit et al. (31) proposed that physicians are more likely to admit homeless patients if they believe their presenting condition will continue to deteriorate if discharged. It is possible that the minors experiencing homelessness in our study were discharged back onto the street or to shelter locations, which may have resulted in a higher frequency of readmissions in comparison with nonhomeless minors.
Another major finding in this study was that the homeless minors averaged a longer LOS than nonhomeless minors. One might assume that a longer LOS may result from higher acuity at presentation requiring additional treatments and may incur higher medical costs for the patient and hospital. Our study showed statistically significant lower hospitalization costs among homeless than nonhomeless minors, which suggests that homeless patients may have stayed in the hospital longer than their nonhomeless counterparts, receiving lower-cost interventions. The sensitivity analyses comparing homeless with nonhomeless minors residing in the lowest-income neighborhood displayed the same results, i.e., LOS was longer, but the hospitalization cost was lower among homeless compared with nonhomeless minors residing in the lowest-income neighborhood. Multiple studies have found a longer average LOS among homeless patients in comparison with nonhomeless patients to be common as well, and it is possible that the additional days spent in the hospital may have been due to wait time associated with a discharge to a shelter or housing program (31,32). Therefore, addressing housing instability could be one strategy to reduce the LOS among homeless minors.
Finally, our analyses showed a decrease in the overall hospitalization rate among homeless minors from 2011 to 2014. The U.S. economic recession in 2008 brought on a significant decrease in overall quality of health in the population (33), with data from the Multi-Ethnic Study of Atherosclerosis (MESA) showing increased blood glucose levels and decreased medication use after the recession (34). Economic recovery, along with passage of the Affordable Care Act (35) and state-based expansions, led to an increase in access to health care for low-income and homeless populations (32,35). While the Affordable Care Act expansion and its effects occurred at the tail end of our study period (2009–2014), we speculate that it may have contributed toward our observed decrease in hospitalizations.
This study has a number of limitations. First, our estimate of homeless individuals is likely an underestimate, since individual counts on a single night may not fully represent the homeless population in a given area. However, New York’s unsheltered homeless minors comprise just 1% of the reported unsheltered population (36), and the estimates are the best available, since they are provided by local CoC to HUD for federal funding to support homeless services (23). Second, our hospital-level analyses are not able to distinguish whether individuals were counted twice during the study period if they were discharged and readmitted across calendar years. Third, the ICD-9-CM codes are dependent upon coding accuracy and may lack specificity. Fourth, differences in health care access between urban and rural residences have been reported (37,38). While the current data set cannot differentiate between homeless minors living in urban or rural areas, previous studies show that the majority of homeless individuals live in urban areas (39). Therefore, results most likely represent health care utilization for homeless minors in urban areas. Finally, because minors who are homeless are more likely to be uninsured, we may be underestimating health care utilization by homeless minors with diabetes if they chose not to present for acute care. The U.S. Census estimated ∼3–5% of minors living in New York were uninsured during our study period (40).
In the context of homelessness, management of a chronic disease such as diabetes is a public health challenge. Future research is needed to assess the specific factors that contribute to hospitalization, with attention toward potentially different needs of minors with type 1 versus type 2 diabetes. Health education should be delivered in the context of the minor’s living situation and, perhaps, should focus on the prevention of symptoms of hyper- and hypoglycemia to reduce need for acute interventions. Careful discharge planning including access to medications and supplies should involve consultation with a social worker. Health promotion efforts may begin with addressing basic needs such as increased referrals to shelters and avenues for food access. The present and future research could be used to promote public policy that aims to improve access to housing services and subsidization for individuals who require chronic disease management. Respite from daily worries over food and shelter may allow homeless individuals to focus on personal health management and improvement of blood glucose–related outcomes.
Conclusion
Our analyses indicate that among minors with diabetes, those who are homeless experience a nearly 9.6 times higher hospitalization rate than their nonhomeless counterparts. We detected a longer LOS among homeless minors, despite a statistically significant lower hospitalization cost, indicating that they received lower-cost interventions. We speculate that the additional days spent in the hospital may have been due to wait time associated with a discharge to a shelter or housing program. Addressing housing instability could be one strategy to reduce the LOS among homeless minors with diabetes.
Article Information
Acknowledgments. This study used 2009–2014 inpatient data from the New York SID, HCUP, Agency for Healthcare Research and Quality (https://www.hcup-us.ahrq.gov/db/hcupdatapartners.jsp). R.S.-B. is funded by the National Institutes of Health Research Scientist Development Award (National Heart, Lung, and Blood Institute grant K01HL141697).
The contents of this work are solely the responsibility of the authors and do not represent the official views of the National Heart, Lung, and Blood Institute.
Duality of Interest. No potential conflicts of interest relevant to this article were reported.
Author Contributions. R.S.-B. conducted the literature search, conceptualized and designed the study, developed the models, contributed to the data interpretation, drafted the initial manuscript, and revised the manuscript. L.A.M., E.H.M., and L.E.M.B. conducted the literature search, contributed to the introduction and discussion sections, and reviewed and revised the manuscript. D.E. and E.J.W. performed data analyses, created the tables, contributed to the data interpretation, and reviewed and revised the manuscript. J.K.Y. supervised the study overall, confirmed the interpretation of the results, and critically reviewed and revised the manuscript. All authors participated in the concept and design of the study, the analysis and interpretation of the data, and the drafting or revising of the manuscript, and they approved the manuscript as submitted. R.S.-B. is the guarantor of this work and, as such, had full access to all the data in the study and takes responsibility for the integrity of the data and the accuracy of the data analysis.
Prior Presentation. Parts of this study were presented in abstract form at the 79th Scientific Sessions of the American Diabetes Association, San Francisco, CA, 7–11 June 2019.
Footnotes
This article contains supplementary material online at https://doi.org/10.2337/figshare.12315743.
This article is featured in a podcast available at https://www.diabetesjournals.org/content/diabetes-core-update-podcasts.
References
- 1.Statistics About Diabetes Diabetes in youth [Internet], 2018. Available from http://www.diabetes.org/diabetes-basics/statistics/. Accessed 23 August 2018.
- 2.Mayer-Davis EJ, Lawrence JM, Dabelea D, et al.; SEARCH for Diabetes in Youth Study . Incidence trends of type 1 and type 2 diabetes among youths, 2002-2012. N Engl J Med 2017;376:1419–1429 [DOI] [PMC free article] [PubMed] [Google Scholar]
- 3.Lindner LME, Gontscharuk V, Bächle C, et al. Severe hypoglycemia and diabetic ketoacidosis in young persons with preschool onset of type 1 diabetes mellitus: an analysis of three nationwide population-based surveys. Pediatr Diabetes 2018;19:713–720 [DOI] [PubMed] [Google Scholar]
- 4.Rowley WR, Bezold C, Arikan Y, Byrne E, Krohe S. Diabetes 2030: insights from yesterday, today, and future trends. Popul Health Manag 2017;20:6–12 [DOI] [PMC free article] [PubMed] [Google Scholar]
- 5.Nathan DM; DCCT/EDIC Research Group . The Diabetes Control and Complications Trial/Epidemiology of Diabetes Interventions and Complications study at 30 years: overview. Diabetes Care 2014;37:9–16 [DOI] [PMC free article] [PubMed] [Google Scholar]
- 6.Butler AM. Social determinants of health and racial/ethnic disparities in type 2 diabetes in youth. Curr Diab Rep 2017;17:60. [DOI] [PMC free article] [PubMed] [Google Scholar]
- 7.Canedo JR, Miller ST, Schlundt D, Fadden MK, Sanderson M. Racial/ethnic disparities in diabetes quality of care: the role of healthcare access and socioeconomic status. J Racial Ethn Health Disparities 2018;5:7–14 [DOI] [PMC free article] [PubMed] [Google Scholar]
- 8.Ibáñez B, Galbete A, Goñi MJ, et al. Socioeconomic inequalities in cardiometabolic control in patients with type 2 diabetes. BMC Public Health 2018;18:408. [DOI] [PMC free article] [PubMed] [Google Scholar]
- 9.Walker RJ, Strom Williams J, Egede LE. Influence of race, ethnicity and social determinants of health on diabetes outcomes. Am J Med Sci 2016;351:366–373 [DOI] [PMC free article] [PubMed] [Google Scholar]
- 10.Valenzuela JM, Seid M, Waitzfelder B, et al.; SEARCH for Diabetes in Youth Study Group . Prevalence of and disparities in barriers to care experienced by youth with type 1 diabetes. J Pediatr 2014;164:1369–1375.e1 [DOI] [PMC free article] [PubMed] [Google Scholar]
- 11.Terry MJ, Bedi G, Patel ND. Healthcare needs of homeless youth in the United States. J Pediatr Sci 2010;2:1–12 [Google Scholar]
- 12.Sakai-Bizmark R, Chang RR, Mena LA, Webber EJ, Marr EH, Kwong KY. Asthma hospitalizations among homeless children in New York state. Pediatrics 2019;144:e20182769. [DOI] [PMC free article] [PubMed] [Google Scholar]
- 13.Young MT, Lord JH, Patel NJ, Gruhn MA, Jaser SS. Good cop, bad cop: quality of parental involvement in type 1 diabetes management in youth. Curr Diab Rep 2014;14:546. [DOI] [PMC free article] [PubMed] [Google Scholar]
- 14.Helgeson VS, Reynolds KA, Siminerio L, Escobar O, Becker D. Parent and adolescent distribution of responsibility for diabetes self-care: links to health outcomes. J Pediatr Psychol 2008;33:497–508 [DOI] [PMC free article] [PubMed] [Google Scholar]
- 15.Edidin JP, Ganim Z, Hunter SJ, Karnik NS. The mental and physical health of homeless youth: a literature review. Child Psychiatry Hum Dev 2012;43:354–375 [DOI] [PubMed] [Google Scholar]
- 16. HCUP State Inpatient Databases (SID) [article online], 2009–2014. Available from https://www.hcup-us.ahrq.gov/sidoverview.jsp. Accessed 5 July 2020.
- 17. HCUP Central Distributor SID description of data elements - all states [Internet], 2008. Available from www.hcup-us.ahrq.gov/db/vars/siddistnote.jsp?var=totchg. Accessed 28 August 2017.
- 18.Yamamoto A, Needleman J, Gelberg L, Kominski G, Shoptaw S, Tsugawa Y. Association between homelessness and opioid overdose and opioid-related hospital admissions/emergency department visits. Soc Sci Med 2019;242:112585. [DOI] [PMC free article] [PubMed] [Google Scholar]
- 19.Rosendale N, Guterman EL, Betjemann JP, Josephson SA, Douglas VC. Hospital admission and readmission among homeless patients with neurologic disease. Neurology 2019;92:e2822–e2831 [DOI] [PMC free article] [PubMed] [Google Scholar]
- 20. CoC Homeless Populations and Subpopulations reports [Internet], 2019. Available from https://www.hudexchange.info/programs/coc/coc-homeless-populations-and-subpopulations-reports/. Accessed 22 November, 2019.
- 21. American FactFinder [Internet], 2018. Available from https://factfinder.census.gov/faces/nav/jsf/pages/index.xhtml. Accessed 18 May 2018.
- 22.Troisi CL, D’Andrea R, Grier G, Williams S. Enhanced methodologies to enumerate persons experiencing homelessness in a large urban area. Eval Rev 2015;39:480–500 [DOI] [PubMed] [Google Scholar]
- 23.Jarpe M, Mosley JE, Tran Smith B. Understanding the collaborative planning process in homeless services: networking, advocacy, and local government support may reduce service gaps. J Public Health Manag Pract 2019;25:262–269 [DOI] [PMC free article] [PubMed] [Google Scholar]
- 24. Cost-to-Charge Ratio files [Internet], 2017. Available from https://www.hcup-us.ahrq.gov/db/state/costtocharge.jsp. Accessed 23 June 2017.
- 25. Consumer Price Index [Internet], Available from http://www.bls.gov/cpi/home.htm. Accessed 8 May 2015.
- 26.Booth GL, Hux JE. Relationship between avoidable hospitalizations for diabetes mellitus and income level. Arch Intern Med 2003;163:101–106 [DOI] [PubMed] [Google Scholar]
- 27.Elder NC, Tubb MR. Diabetes in homeless persons: barriers and enablers to health as perceived by patients, medical, and social service providers. Soc Work Public Health 2014;29:220–231 [DOI] [PubMed] [Google Scholar]
- 28.Hwang SW, Bugeja AL. Barriers to appropriate diabetes management among homeless people in Toronto. CMAJ 2000;163:161–165 [PMC free article] [PubMed] [Google Scholar]
- 29.Helgeson VS, Reynolds KA, Snyder PR, et al. Characterizing the transition from paediatric to adult care among emerging adults with Type 1 diabetes. Diabet Med 2013;30:610–615 [DOI] [PMC free article] [PubMed] [Google Scholar]
- 30.Doran KM, Ragins KT, Iacomacci AL, Cunningham A, Jubanyik KJ, Jenq GY. The revolving hospital door: hospital readmissions among patients who are homeless. Med Care 2013;51:767–773 [DOI] [PubMed] [Google Scholar]
- 31.Salit SA, Kuhn EM, Hartz AJ, Vu JM, Mosso AL. Hospitalization costs associated with homelessness in New York City. N Engl J Med 1998;338:1734–1740 [DOI] [PubMed] [Google Scholar]
- 32.Wadhera RK, Choi E, Shen C, Yeh RW, Joynt Maddox KE. Trends, causes, and outcomes of hospitalizations for homeless individuals: a retrospective cohort study. Med Care 2019;57:21–27 [DOI] [PMC free article] [PubMed] [Google Scholar]
- 33.Margerison-Zilko C, Goldman-Mellor S, Falconi A, Downing J. Health impacts of the great recession: a critical review. Curr Epidemiol Rep 2016;3:81–91 [DOI] [PMC free article] [PubMed] [Google Scholar]
- 34.Seeman T, Thomas D, Merkin SS, Moore K, Watson K, Karlamangla A. The Great Recession worsened blood pressure and blood glucose levels in American adults. Proc Natl Acad Sci U S A 2018;115:3296–3301 [DOI] [PMC free article] [PubMed] [Google Scholar]
- 35.Kaufman HW, Chen Z, Fonseca VA, McPhaul MJ. Surge in newly identified diabetes among medicaid patients in 2014 within medicaid expansion States under the affordable care act. Diabetes Care 2015;38:833–837 [DOI] [PubMed] [Google Scholar]
- 36.U.S. Department of Housing and Urban Development HUD’s 2014 Continuum of Care Homeless Assistance Programs Homeless Populations and Subpopulations: New York [Internet], 2014. Available from https://files.hudexchange.info/reports/published/CoC_PopSub_State_NY_2014.pdf. Accessed 8 November 2019.
- 37.Goss PW, Paterson MA, Renalson J. A ‘radical’ new rural model for pediatric diabetes care. Pediatr Diabetes 2010;11:296–304 [DOI] [PubMed] [Google Scholar]
- 38.Malasanos TH, Burlingame JB, Youngblade L, Patel BD, Muir AB. Improved access to subspecialist diabetes care by telemedicine: cost savings and care measures in the first two years of the FITE diabetes project. J Telemed Telecare 2005;11(Suppl. 1):74–76 [DOI] [PubMed] [Google Scholar]
- 39.Lee BA, Tyler KA, Wright JD. The new homelessness revisited. Annu Rev Sociol 2010;36:501–521 [DOI] [PMC free article] [PubMed] [Google Scholar]
- 40.Open Data Network The percent without health insurance of New York for under 19 [Internet], 2018. Available from https://www.opendatanetwork.com/entity/0400000US36/New_York/health.health_insurance.pctui?year=2014&age=18%20to%2064&race=All%20races&sex=Both%20sexes&income=All%20income%20levels. Accessed 13 December 2018.