

Abstract
Objective
To describe the semiology of pain and its associated features in patients with coronavirus disease 2019 (COVID‐19) and headache presenting to the emergency department who do not require urgent services.
Background
Headache is one of the most frequent neurological symptoms reported in case series, epidemiological studies, and meta‐analyses of COVID‐19, with a prevalence ranging from 8 to 71.1%. Studies addressing the semiology of these headaches are lacking.
Methods
We conducted a cross‐sectional study in the emergency department of a tertiary hospital. Patients classified according to the Manchester Triage System as standard and non‐urgent and those fulfilling the criteria for probable or confirmed COVID‐19 according to World Health Organization guidelines who presented with headache were included. A standardized questionnaire was used for data collection.
Results
Of the 145 confirmed and probable COVID‐19 patients, 99 (68.3%) reported headache. A total of 54/99 (54.5%) were classified with probable COVID‐19 and 45/99 (45.5%) with confirmed COVID‐19. The mean age (44.7 ± 11.8 vs 40.4 ± 10.7, P = .061), sex distribution (35/54 [64.8%] vs 28/45 [62.2%] female, P = .768), and headache comorbidity (19/54 [35.2%] vs 17/45 [37.8%], P = .789) were similar between the probable and confirmed COVID‐19 groups, along with other medical comorbidities and laboratory data. Patients with confirmed COVID‐19 showed a higher incidence of anosmia (21/54 [38.9%] vs 28/45 [62.2%], P = .021) and pneumonia (10/54 [18.5%] vs 18/45 [40%], P = .018), headache at onset (32/54 [59.3%] vs 39/45 [86.7%], P = .002), and hospital admission (0/54 [0%] vs 2/45 [11.1%], P = .017). In most cases, the headache appeared simultaneously with other COVID‐19 symptoms (57/99, 57.6%). It was bilateral (86/99, 86.9%), frontal or holocranial (34/99, 34.3% each) in location and intense (60/99, 60.6%, reported a visual analog scale [VAS] score ≥7). A total of 39/99 (39.4%) identified triggers, most commonly fever. The most frequent aggravating factors were physical activity (45/99, 45.5%) and coughing (43/99, 43.4%). Patients showed a propensity toward prostration (41/99, 41.4%), photophobia (29/99, 29.3%), and phonophobia (27/99, 27.3%). Partial (53/99, 53.5%) or total (26/99, 26.3%) responses to first‐step analgesics were reported. A total of 25/99 (25.3%) patients had a prior history of migraine, presenting with headache different from the usual in 23/25 (92.0%) patients. Individuals with migraine were more likely to have earlier (headache at onset of the respiratory symptoms in 24/25 [96.0%] vs 57/74 [77.0%], P = .023 [95% CI: 0.067, 0.313]), longer (>24 hours of pain in 20/25 [80%] vs 25/74 [33.8%], P < .001 [95% CI: 0.272, 0.652]), and more intense (VAS score ≥5 in 25/25 [100%] vs 63/74 [85.1%], P = .043 [95% CI: 0.057, 0.213]) headaches than patients without migraine.
Conclusions
Headache is a very prevalent COVID‐19 symptom among patients presenting to the emergency room, most frequently presenting as holocranial or bifrontal moderate to severe, and pressing quality headache. Individuals with migraine tend to present with earlier, longer, and more intense headaches.
Keywords: coronavirus disease 2019, headache, semiology, severe acute respiratory syndrome coronavirus 2, coronavirus, neurological
Abbreviations
- CNS
central nervous system
- CoV
coronavirus
- CSF
cerebrospinal fluid
- ICHD‐III
International Classification of Headache Disorders, 3rd edition
- IL
interleukin
- LDH
lactate dehydrogenase
- NSAIDs
nonsteroidal anti‐inflammatory drugs
- PCR
polymerase chain reaction
- PSI
pneumonia severity index
- SD
standard deviation
- TTH
tension‐type headache
- VAS
visual analog scale
Introduction
Coronaviruses (CoVs) are pathogens that mainly affect the respiratory tract, causing outbreaks of epidemic potential. The novel CoV (severe acute respiratory syndrome coronavirus 2 [SARS‐CoV‐2]) was first described in December 2019 and was declared a pandemic by the World Health Organization (WHO) on March 11, 2020. 1 This pandemic has particularly hit Spain, which together with the United States and Italy, led the ranking of countries with the highest number of cases and deaths at the time this study was conducted. 2
SARS‐CoV‐2 can cause a highly diverse spectrum of diseases (coronavirus disease 2019 [COVID‐19]) ranging from asymptomatic infection to acute respiratory distress syndrome. The most common symptoms at onset are fever, cough, arthromyalgia, dyspnea, and fatigue. Other symptoms such as sputum production, headache, hemoptysis, and diarrhea have also been reported. 3
The neurotropism of human CoVs has been addressed in several studies. The main potential mechanisms of neurological damage are parainfectious demyelination, encephalopathy in the context of sepsis, 4 and direct central nervous system (CNS) infection. It has been hypothesized that CNS invasion occurs either by neuron‐neuron transmission or blood‐barrier disruption (due to cytokine storm syndrome leading to a hematogenic pathway). Other CoVs have been isolated in the CNS, both in animal models and clinical scenarios. 5 , 6 , 7 , 8
Neurological manifestations are common among COVID‐19 patients. Anosmia and ageusia (present in up to 85.6 and 88.0% of the patients), headache (6.4‐32.0%), and myalgia (11‐52%) are frequently reported neurological symptoms, followed by confusion (9.0%), dizziness (9.0%), seizures (7.0%), and stroke. 9 , 10 , 11 , 12 , 13 , 14 Unusual cases of acute parainfectious myelitis, 15 acute necrotizing encephalitis, 16 acute disseminated encephalomyelitis, 17 and axonal or demyelinating polyradiculoneuropathies, 18 , 19 , 20 have been reported without microbiological confirmation in cerebrospinal fluid (CSF). Currently, case of meningoencephalitis with positive SARS‐CoV‐2 reactive polymerase chain reaction (PCR) is the only evidence of the presence of this virus in the CNS. 21 In a meta‐analysis of 3062 cases, 15.4% of COVID‐19 patients presented with headache. 22 Since most of the patients did not undergo specific neurologic assessments, some neurological syndromes might have been underdiagnosed.
The International Classification of Headache Disorders, 3rd edition (ICHD‐III) includes acute headache attributed to systemic viral infection (code 9.2.2.1), 23 whose criteria can be applied to define headache caused by influenza and common cold viruses (mainly rhinoviruses and other CoVs). These viral infections can cause headaches in over 60% of cases. 24 Regarding COVID‐19, in a large cohort of symptomatic healthcare workers tested for SARS‐CoV‐2, headache was present in 71.1% of SARS‐CoV‐2 positive individuals and was associated with test positivity (OR 3.5, P < .001). 25 However, the description of COVID‐19‐related headache features in clinical practice is lacking and the effects of COVID‐19 on patients with a previously diagnosed headache are still unknown. Recently, a headache specialist neurologist reported his own experience as a COVID‐19 patient, describing a multiphasic course starting with a diffuse pain related to fever, followed by headache associated with a cough, bilateral pain with pressing quality, and a moderate expansive headache associated with neck stiffness, photophobia, and worsening with postural changes and physical activity. 26 In addition, a study using a survey to investigate the characteristics of COVID‐19‐related headache in healthcare workers has been published, in which throbbing pain appeared most frequently in individuals with migraine. 27
We hypothesized that COVID‐19‐related headache might be one of the most frequent symptoms of the infection and can have a more severe presentation in patients with migraine. We aimed to describe the semiology of pain and associated symptoms in patients with COVID‐19‐related headache in a clinical setting who visit the emergency department but do not require urgent services. Our second aim was to determine the effect of headache attributed to COVID‐19 on patients with a previous history of migraine in the same clinical setting.
Methods
Design
According to International Recommendations for Observational Studies, items on the Strengthening the Reporting of Observational Studies in Epidemiology checklist were followed for this study. 28 This was a cross‐sectional study carried out in the city of Madrid, Spain, in a tertiary hospital highly affected by COVID‐19. The inclusion period ranged from March 31 to April 27, 2020, when the disease was at its peak in our country. All the procedures were reviewed and approved by the local Ethics Committee for Clinical Research (PI‐4148), and written informed consent was obtained from all patients.
Study Population and Eligibility
Patients attending the emergency department of our hospital were included if they met all of the following inclusion criteria: (1) patients classified by the Manchester Triage System 29 as priority levels 5 (non‐urgent) and 4 (standard); (2) fulfilled the criteria for a “probable COVID‐19 case” or “confirmed COVID‐19 case” according to the WHO guidance on global surveillance for COVID‐19; 30 (3) and presented with headache alongside other COVID‐19‐related symptoms. Patients presenting any condition requiring an emergency diagnostic or therapeutic intervention were excluded.
All the patients underwent thoracic imaging (chest radiography or computerized tomography, depending on the clinical suspicion and availability). Microbiological testing for SARS‐CoV‐2 was performed by PCR using samples obtained from nasopharyngeal swabs if the patient was ≥60 years old or presented with significant comorbidities (high blood pressure, diabetes mellitus, chronic renal insufficiency, liver disease, cancer, ischemic heart disease, chronic obstructive pulmonary disease, or immunosuppression). Younger patients without these comorbidities underwent microbiological testing if chest imaging showed radiological signs compatible with COVID‐19 or if they were healthcare workers, according to the national government recommendations at the time this study was developed. 31
Data Collection
A headache specialist designed a structured questionnaire containing the main semiological aspects of headache. Convenience sampling was used to maximize resources. Demographic data, anthropometric measures, and prior history of depression, anxiety, or headache were also recorded. The questionnaire included headache features such as location, intensity measured by the visual analog scale (VAS), quality and duration of pain, associated symptoms, possible triggers and chronological relationship with other COVID‐19 symptoms (whether headache was present at the time of onset of fever and respiratory symptoms). The VAS variable was categorized into 2 groups: mild (VAS score <5) and moderate‐to‐severe (VAS score ≥5). The presence of anosmia and pneumonia, and the oxygen saturation were recorded. Following our Emergency Department protocol, laboratory analysis was not performed in all patients. Apart from laboratory data, there were no missing data. All patients were classified as confirmed COVID‐19 cases (laboratory confirmation: positive SARS‐CoV‐2 PCR) or probable COVID‐19 cases (suspected case for whom testing could not be performed) as per WHO guidelines. A suspected case was a patient with acute respiratory illness, fever and at least 1 sign/symptom of respiratory illness, residing in a location where community transmission of COVID‐19 was reported, as is the case in Spain. Patients with pneumonia, epidemiological contact history, and typical laboratory findings (such as lymphopenia and high lactate dehydrogenase [LDH]) 32 were classified with probable COVID‐19 even if PCR was negative (contemplating the possibility of a false‐negative result) and no other etiology of pneumonia was found.
Statistical Analysis
No statistical power calculation was performed before the study. The sample size was based on our previous experience with this design. Nominal variables were reported as percentages and compared using a chi‐square or Fisher’s exact test, when applicable. A 2‐tailed Kolmogorov‐Smirnov test was applied to examine whether the ratio variables followed a Gaussian distribution. Ratio variables were reported as mean ± standard deviation (SD) if they followed a Gaussian distribution; otherwise, they were represented as median ± interquartile range [p25‐p75] (IR). A 2‐tailed Mann‐Whitney U‐test was used to compare the differences between ordinal variables in 2 independent groups (personal history of migraine and no previous headache). Bivariate correlation between VAS score and laboratory parameters were studied using the Spearman’s test. The statistical significance was set at P < .05. Data analysis was performed using the Statistics Package for Social Science (SPSS 23.00 – IBM Inc., USA).
Results
A flowchart describing the patient selection and exclusion process is shown in Figure 1. A total of 145 participants were identified with probable or confirmed COVID‐19 during the recruiting period. A total of 99 (68.3%) of the 145 participants reported headache as a COVID‐19‐related symptom. Among the 99 patients, 45 (45.5%) were confirmed cases and 54 (54.5%) were probable cases. In the probable COVID‐19 group, 10 patients had a negative PCR, but with highly suggestive SARS‐CoV‐2 findings (false‐negative PCR) and 45 participants did not undergo microbiological testing. Anosmia was present in 49/99 (49.5%) participants. 63/99 (63.6%) were women. The mean age was 42.7 ± 11.5 years, ranging from 21 to 70 years. A personal history of headache comorbidity was found in 33/99 patients (33.3%), the most common being migraine in 25/99 (25.3%) patients. Epidemiological and clinical data of patients presenting with and without headache are displayed in Table 1. The same information together with headache‐related data was compared between probable and confirmed COVID‐19 patients presenting with headache, as shown in Table 2.
Fig. 1.
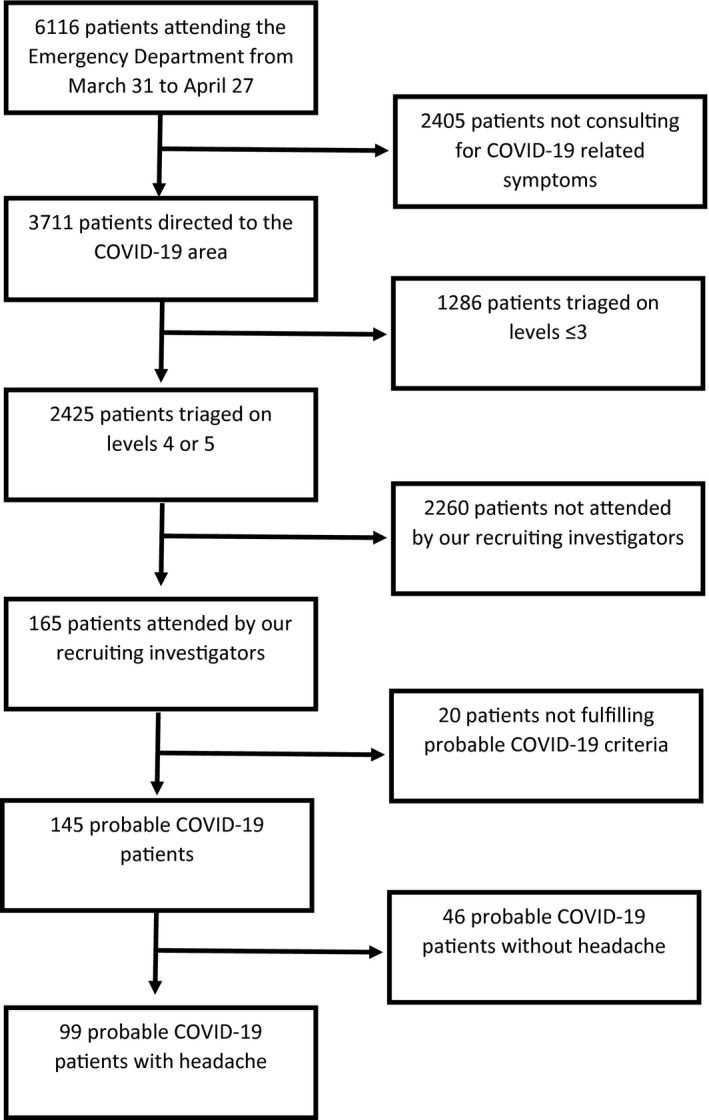
Flowchart of patient selection and exclusion.
Table 1.
Epidemiological Information, COVID‐19‐Related Data and Clinical Outcome of Included Patients With and Without Headache
| Probable or Confirmed COVID‐19 Without Headache (n = 46) | Probable or Confirmed COVID‐19 With Headache (n = 99) | P | |
|---|---|---|---|
| Age (mean ± SD) | 52.9 ± 16.3 | 42.7 ± 11.5 | <.001 |
| Female | 27/46 (58.7%) | 36/99 (36.4%) | .568 |
| Headache comorbidity | 3/46 (6.5%) | 33/99 (33.3%) | <.001 |
| Migraine | 3/46 (6.5%) | 25/99 (25.3%) | .007 |
| With aura | 3/3 (100.0%) | 12/25 (48.0%) | .226 |
| Without aura | 0/3 (0%) | 13/25 (52.0%) | .226 |
| TTH | 0/46 (0%) | 4/99 (4.0%) | .307 |
| Undiagnosed headache | 0/46 (0%) | 2/99 (2.0%) | >.999 |
| Secondary headache | 0/46 (0%) | 2/99 (2.0%) | >.999 |
| Other comorbidities | |||
| Hypertension | 15/46 (32.6%) | 15/99 (15.2%) | .016 |
| Diabetes mellitus | 1/46 (2.2%) | 3/99 (3.0%) | .769 |
| Dyslipidemia | 13/46 (28.3%) | 11/99 (11.1%) | .010 |
| Stroke | 1/46 (2.2%) | 0/99 (0%) | .141 |
| Epilepsy | 0/46 (0%) | 0/99 (0%) | — |
| Multiple sclerosis | 0/46 (0%) | 0/99 (0%) | — |
| Alzheimer’s disease | 0/46 (0%) | 0/99 (0%) | — |
| Parkinson’s disease | 0/46 (0%) | 0/99 (0%) | — |
| Other neurological condition | 1/46 (2.2%) | 1/99 (1.0%) | .576 |
| Cardiopathy | 1/46 (2.2%) | 1/99 (1.0%) | .576 |
| Respiratory disease | 8/46 (17.4%) | 0/99 (0%) | .215 |
| Hepatopathy | 4/46 (8.7%) | 1/99 (1.0%) | .035 |
| Cancer | 1/46 (2.2%) | 2/99 (2.0%) | >.999 |
| Immunosuppression | 3/46 (6.5%) | 1/99 (1.0%) | .094 |
| COVID‐19‐related clinical data | |||
| Confirmed COVID‐19 | 16/46 (34.8%) | 45/99 (45.5%) | .226 |
| Symptoms (aside from headache) | |||
| Fever | 29/46 (63.0%) | 76/99 (76.8%) | .085 |
| Cough | 33/46 (71.7%) | 74/99 (74.8%) | .701 |
| Dyspnea | 26/46 (56.5%) | 54/99 (54.5%) | .824 |
| Odynophagia | 6/46 (13.0%) | 39/99 (39.4%) | .001 |
| Asthenia | 22/46 (47.8%) | 60/99 (60.6) | .148 |
| Thoracic pain | 10/46 (21.7%) | 55/99 (55.6%) | <.001 |
| Myalgia | 16/46 (34.8%) | 65/99 (65.7%) | <.001 |
| Anosmia | 12/46 (26.1%) | 49/99 (49.5%) | .008 |
| Another neurological symptom | 0/46 (0%) | 0/99 (0%) | — |
| SatO2 (mean ± SD) | 95.9 ± 1.8 | 96.7 ± 1.3 | .002 |
| Pneumonia | 21/46 (45.7%) | 28/99 (28.3%) | .040 |
| Unilateral | 8/21 (38.1%) | 13/28 (46.4%) | .771 |
| Bilateral | 13/21 (61.9%) | 15/28 (53.6%) | .771 |
| CURB‐65 = 0‐1 | 20/21 (95.2%) | 27/28 (96.4%) | >.999 |
| CURB‐65 = 2 | 1/21 (4.8%) | 1/28 (3.6%) | >.999 |
| CURB‐65 = 3‐5 | 0/21 (0%) | 0/28 (0%) | — |
| PSI = 1‐2 | 17/21 (81.0%) | 26/28 (92.9%) | .381 |
| PSI = 3 | 4/21 (19.1%) | 2/28 (7.1%) | .381 |
| PSI = 4‐5 | 0/21 (0%) | 0/28 (0%) | — |
| Laboratory data (mean ± SD) | |||
| Lymphocytes (n = 67) | 1472.9 ± 821.5 (n = 24) | 1956.4 ± 821.2 (n = 43) | .024 |
| C‐reactive protein (n = 66) | 261.96 ± 395.47 (n = 24) | 85.52 ± 190.5 (n = 42) | .017 |
| Fibrinogen (n = 65) | 560.9 ± 221.9 (n = 24) | 448.6 ± 281.8 (n = 41) | .100 |
| d‐dimer (n = 61) | 507.4 ± 103.6 (n = 24) | 1324.8 ± 4453.1 (n = 37) | .428 |
| LDH (n = 64) | 276.8 ± 83.3 (n = 24) | 235.9 ± 75.7 (n = 40) | .048 |
| Outcome | |||
| Ambulatory | 32/46 (69.6%) | 91/99 (91.9%) | <.001 |
| Hotel admission | 0/46 (0%) | 3/99 (3.0%) | .552 |
| Hospital admission, ICU not required | 14/46 (30.4%) | 5/99 (5.0%) | <.001 |
| Hospital admission, ICU required | 0/46 (0%) | 0/99 (0%) | — |
| Death | 0/46 (0%) | 0/99 (0%) | — |
ICU = intensive care unit; LDH = lactate dehydrogenase; PSI = pneumonia severity index; SatO2 = oxygen saturation; SD = standard deviation; TTH = tension‐type headache; — = inconclusive results.
Table 2.
Epidemiological Information, COVID‐19‐Related Data, Clinical Outcome and Headache Related Variables of Patients With Headache and Probable or Confirmed COVID‐19
| Probable COVID‐19 (n = 54) | Confirmed COVID‐19 (n = 45) | P | |
|---|---|---|---|
| Age (mean ± SD) | 44.7 ± 11.8 | 40.4 ± 10.7 | .061 |
| Female | 35/54 (64.8%) | 28/45 (62.2%) | .768 |
| Headache comorbidity | 16/54 (29.63%) | 17/45 (37.8%) | .789 |
| Migraine | 13/54 (24.1%) | 12/45 (26.7%) | .767 |
| With aura | 10/13 (76.9%) | 2/12 (16.7%) | .032 |
| Without aura | 3/13 (23.1%) | 10/12 (83.3%) | .014 |
| TTH | 2/54 (3.7%) | 2/45 (4.4%) | .852 |
| Undiagnosed headache | 1/54 (1.9%) | 1/45 (2.2%) | .896 |
| Secondary headache | 0/54 (0%) | 2/45 (4.4%) | .204 |
| Other comorbidities | |||
| Hypertension | 7/54 (12.9%) | 8/45 (17.8%) | .506 |
| Diabetes mellitus | 2/54 (3.7%) | 1/45 (2.2%) | .669 |
| Dyslipidemia | 9/54 (16.7%) | 2/45 (4.4%) | .054 |
| Stroke | 0/54 (0%) | 0/45 (0%) | — |
| Epilepsy | 0/54 (0%) | 0/45 (0%) | — |
| Multiple sclerosis | 0/54 (0%) | 0/45 (0%) | — |
| Alzheimer’s disease | 0/54 (0%) | 0/45 (0%) | — |
| Parkinson’s disease | 0/54 (0%) | 0/45 (0%) | — |
| Other neurological condition | 0/54 (0%) | 1/45 (2.2%) | .271 |
| Cardiopathy | 1/54 (1.9%) | 0/45 (0%) | >.999 |
| Respiratory disease | 7/54 (12.7%) | 0/45 (0%) | .015 |
| Hepatopathy | 1/54 (1.9%) | 0/45 (0%) | >.999 |
| Cancer | 2/54 (3.7) | 0/45 (0%) | .499 |
| Immunosuppression | 1/54 (1.9%) | 0/45 (0%) | >.999 |
| COVID‐19‐related clinical data | |||
| Symptoms (aside from headache) | |||
| Fever | 38/54 (70.4%) | 35/45 (77.8%) | .828 |
| Cough | 41/54 (75.9%) | 36/45 (80.0%) | .272 |
| Dyspnea | 31/54 (57.4%) | 23/45 (51.1%) | .531 |
| Odynophagia | 23/54 (42.6%) | 16/45 (35.6%) | .476 |
| Asthenia | 30/54 (55.6%) | 30/45 (66.7%) | .260 |
| Thoracic pain | 26/54 (48.2%) | 29/45 (64.4%) | .104 |
| Myalgia | 32/54 (59.3%) | 23/45 (51.1%) | .142 |
| Anosmia | 21/54 (38.9%) | 28/45 (62.2%) | .021 |
| Another neurological symptom | 0/54 (0%) | 0/45 (0%) | — |
| SatO2 (mean ± SD) | 96.5 ± 1.2 | 96.9 ± 1.4 | .158 |
| Pneumonia | 10/54 (18.5%) | 18/45 (40%) | .018 |
| Unilateral | 6/10 (60%) | 9/18 (50.0%) | .611 |
| Bilateral | 4/10 (40%) | 9/18 (50.0%) | .611 |
| CURB‐65 = 0‐1 | 9/10 (90%) | 17/18 (94.4%) | .661 |
| CURB‐65 = 2 | 1/10 (10%) | 1/18 (5.6%) | .661 |
| CURB‐65 = 3‐5 | 0/10 (0%) | 0/18 (0.0%) | — |
| PSI = 1‐2 | 9/10 (90%) | 17/18 (94.4%) | .661 |
| PSI = 3 | 1/10 (10%) | 1/18 (5.6%) | .661 |
| PSI = 4‐5 | 0/10 (0%) | 0/18 (0%) | — |
| Laboratory data (mean ± SD) | |||
| Lymphocytes (n = 43) | 2011.0 ± 676.6 (n = 20) | 1908.9 ± 941.8 (n = 23) | .689 |
| C‐reactive protein (n = 42) | 60.7 ± 145.1 (n = 20) | 108.1 ± 225.2 (n = 22) | .427 |
| Fibrinogen (n = 41) | 387.8 ± 220.5 (n = 20) | 506.5 ± 324.8 (n = 21) | .181 |
| d‐dimer (n = 37) | 583.7 ± 675.7 (n = 17) | 722.3 ± 814.1 (n = 20) | .581 |
| LDH (n = 40) | 215.0 ± 62.8 (n = 18) | 253.0 ± 82.8 (n = 22) | .115 |
| Outcome | |||
| Ambulatory | 53/54 (98.2%) | 38/45 (84.4%) | <.001 |
| Hotel admission | 1/54 (1.9%) | 2/45 (4.4%) | .443 |
| Hospital admission, ICU not required | 0/54 (0%) | 5/45 (11.1%) | .017 |
| Hospital admission, ICU required | 0/54 (0%) | 0/45 (0%) | — |
| Death | 0/54 (0%) | 0/45 (0%) | — |
| Headache‐related data | |||
| Headache at onset† | 32/54 (59.3%) | 39/45 (86.7%) | .002 |
| Unilateral | 7/54 (13.0%) | 6/45 (13.3%) | .956 |
| Holocranial | 16/54 (29.6%) | 18/45 (40%) | .569 |
| Throbbing | 9/54 (16.7%) | 5/45 (11.1%) | .250 |
| Long‐lasting headache‡ | 28/54 (51.9%) | 17/45 (37.8%) | .161 |
| Moderate‐severe headache (VAS ≥5) | 49/54 (90.7%) | 40/45 (88.9%) | .760 |
| Headache triggers | 16/54 (29.6%) | 17/45 (37.8%) | .391 |
| Wakening headache | 8/54 (14.8%) | 10/45 (22.2%) | .341 |
| Photophobia | 19/54 (35.2%) | 10/45 (22.2%) | .158 |
| Phonophobia | 18/54 (33.3%) | 9/45 (20.0%) | .138 |
| Osmophobia | 5/54 (9.3%) | 4/45 (8.9%) | .949 |
| Aggravation by physical activity | 27/54 (50.0%) | 18/45 (40.0%) | .320 |
| Nausea | 13/54 (24.1%) | 8/45 (17.8%) | .472 |
| Any migraine‐like feature§ | 40/54 (74.1%) | 28/45 (62.2%) | .205 |
| Orthostatic features | 9/54 (16.7%) | 7/45 (15.5%) | .881 |
Headache presented before or simultaneously to other COVID‐19 symptoms.
Continuous headache present for more than 1 day.
Throbbing pain, photophobia, phonophobia, osmophobia, and/or aggravation by physical activity.
ICU = intensive care unit; LDH = lactate dehydrogenase; PSI = pneumonia severity index; SatO2 = oxygen saturation; SD = standard deviation; TTH = tension‐type headache; VAS = visual analog scale; — = inconclusive results.
When Does COVID‐19‐Related Headache Start, Where Does the Pain Localize, How Much Does It Hurt, How Does It Feel, and How Long Does It Last?
Headache was present before other COVID‐19 symptoms in 24/99 (24.2%), at the same time in 57/99 (57.6%), and after respiratory syndrome onset in 18/99 (18.2%) patients. Comparative data between patients with a headache before other COVID‐19 symptoms and headache at the same time or after other symptoms did not show statistically significant differences in comorbidity, incidence of pneumonia, laboratory data, outcome, or other headache‐related variables (see Table 3 for further information). Regarding the laterality of pain, a clear predominance of bilateral headache was observed, presenting in 86/99 patients (86.9%). The pain was most frequently located as frontal or holocranial, each of them presenting in 34/99 (34.3%) patients. Other frequent pain sites were the parietal region in 12/99 patients (12.1%) and occipital region in 9/99 (9.1%) (Fig. 2). Regarding pain intensity, 89/99 (89.9%) patients scored ≥5 points in the VAS and 60/99 (60.6%) ≥7. The lymphocyte count, LDH, and analyzed acute‐phase reactants (C‐reactive protein, fibrinogen, and d‐dimer) did not show a statistically significant correlation with the VAS score (correlation of the VAS score with lymphocyte count ρ = −0.054 [P = .731], LDH ρ = −0.077 [P = .636], C‐reactive protein ρ = 0.203 [P = .198], fibrinogen ρ = 0.74 [P = .644], and d‐dimer ρ = 0.176 [P = .296]). Pain quality was described as pressing in 73/99 (73.7%), throbbing in 14/99 (14.1%), stabbing in 11/99 (11.1%), and burning in 1/99 (1.0%) patients. The headache persisted for a long duration, lasting more than 24 hours without remission in 45/99 (45.5%) patients. Laboratory parameters did not present a statistically significant difference between patients with longer headache episodes (>24 hours) and those with shorter episodes (median ± IR lymphocyte count 1606.3 ± 1106.9 vs 2160.0 ± 834.4 [95% CI: −1960.0‐3067.4; P = .574], median ± IR LDH 240.3 ± 201.5 vs 223.0 ± 38.2 [95% CI −500.0‐465.0; P = .916], median ± IR C‐reactive protein 189.8 ± 202.9 vs 28.5 ± 33.2 [95% CI: −585.6‐263.2; P = .351], median ± IR fibrinogen 900.7 ± 389.0 vs 277.5 ± 26.2 [95% CI: −1546.9‐300.5; P = .121], and median ± IR d‐dimer 475.8 ± 471.3 vs 755.0 ± 898.0 [95% CI: −1179.8‐1738.3; P = .623]).
Table 3.
Epidemiological Information, COVID‐19‐Related Data, Clinical Outcome and Headache Related Variables in Relation to the Onset of Headache
| Headache Prior to Other COVID‐19 Symptoms (n = 24) | Headache at the Same Time or After Other COVID‐19 Symptoms (n = 75) | P | |
|---|---|---|---|
| Age (mean ± SD) | 46.7 ± 12.2 | 41.5 ± 11.0 | .051 |
| Female | 20/24 (83.3%) | 43/75 (57.3%) | .021 |
| Headache comorbidity | 9/24 (37.5%) | 24/75 (32.0%) | .062 |
| Migraine | 9/24 (37.5%) | 16/75 (21.3%) | .188 |
| With aura | 5/9 (55.6%) | 8/16 (50.0%) | >.999 |
| Without aura | 4/9 (44.4%) | 8/16 (50.0%) | >.999 |
| TTH | 0/24 (0.0%) | 4/75 (5.3%) | .570 |
| Undiagnosed headache | 0/24 (0.0%) | 2/75 (2.7%) | >.999 |
| Secondary headache | 0/24 (0.0%) | 2/75 (2.7%) | >.999 |
| Other comorbidities | |||
| Hypertension | 6/24 (25.0%) | 9/75 (12.0%) | .122 |
| Diabetes mellitus | 1/24 (4.2%) | 2/75 (2.7%) | .709 |
| Dyslipidemia | 5/24 (20.8%) | 6/75 (8.0%) | .082 |
| Stroke | 0/24 (0.0%) | 0/75 (0.0%) | — |
| Epilepsy | 0/24 (0.0%) | 0/75 (0.0%) | — |
| Multiple sclerosis | 0/24 (0.0%) | 0/75 (0.0%) | — |
| Alzheimer’s disease | 0/24 (0.0%) | 0/75 (0.0%) | — |
| Parkinson’s disease | 0/24 (0.0%) | 0/75 (0.0%) | — |
| Other neurological condition | 0/24 (0.0%) | 1/75 (1.3%) | >.999 |
| Cardiopathy | 1/24 (4.2%) | 0/75 (0.0%) | .242 |
| Respiratory disease | 2/24 (8.3%) | 8/75 (10.7%) | >.999 |
| Hepatopathy | 1/24 (4.2%) | 0/75 (0.0%) | .242 |
| Cancer | 1/24 (4.2%) | 1/75 (1.3%) | .428 |
| Immunosuppression | 1/24 (4.2%) | 0/75 (0.0%) | .242 |
| COVID‐19‐related clinical data | |||
| Symptoms (aside from headache) | |||
| Fever | 17/24 (70.8%) | 59/75 (78.7%) | .429 |
| Cough | 18/24 (75.0%) | 56/75 (74.7%) | .974 |
| Dyspnea | 15/24 (62.5%) | 39/75 (52.0%) | .369 |
| Odynophagia | 9/25 (37.5%) | 30/75 (40.0%) | .827 |
| Asthenia | 10/24 (41.7%) | 50/75 (66.7%) | .029 |
| Thoracic pain | 10/24 (41.7%) | 45/75 (60.0%) | .116 |
| Myalgia | 11/24 (45.8%) | 54/75 (72.0%) | .019 |
| Anosmia | 12/24 (50.0%) | 37/75 (49.3%) | .955 |
| Another neurological symptom | 0/24 (0.0%) | 0/75 (0.0%) | — |
| SatO2 (Mean ± SD) | 96.9 ± 1.3 | 96.6 ± 1.3 | .423 |
| Pneumonia | 8/24 (33.3%) | 20/75 (26.7%) | .528 |
| Unilateral | 2/8 (25.0%) | 9/20 (45.0%) | .419 |
| Bilateral | 6/8 (75.0%) | 11/20 (55.0%) | .419 |
| CURB‐65 = 0‐1 | 8/8 (100.0%) | 18/20 (90.0%) | >.999 |
| CURB‐65 = 2 | 0/8 (0.0%) | 2/20 (10.0%) | >.999 |
| CURB‐65 = 3‐5 | 0/8 (0.0%) | 0/20 (0.0%) | — |
| PSI = 1‐2 | 8/8 (100.0%) | 18/20 (90.0%) | >.999 |
| PSI = 3 | 0/8 (0.0%) | 2/20 (10.0%) | >.999 |
| PSI = 4‐5 | 0/8 (0.0%) | 0/20 (0.0%) | — |
| Laboratory data (mean ± SD) | |||
| Lymphocytes (n = 43) | 2002.8 ± 704.3 (n = 29) | 1860.3 ± 1046.6 (n = 14) | .600 |
| C‐reactive protein (n = 42) | 50.1 ± 96.6 (n = 29) | 164.5 ± 303.8 (n = 13) | .072 |
| Fibrinogen (n = 41) | 412.6 ± 242.6 (n = 29) | 535.5 ± 359.9 (n = 12) | .208 |
| d‐dimer (n = 37) | 578.5 ± 580.5 (n = 26) | 847.9 ± 1052.9 (n = 11) | .323 |
| LDH (n = 40) | 230.3 ± 69.1 (n = 28) | 249.1 ± 91.2 (n = 12) | .478 |
| Outcome | |||
| Ambulatory | 22/24 (91.7%) | 69/75 (92.0%) | >.999 |
| Hotel admission | 1/24 (4.2%) | 2/75 (2.67%) | .569 |
| Hospital admission, ICU not required | 1/24 (4.2%) | 4/75 (5.3%) | >.999 |
| Hospital admission, ICU required | 0/24 (0.0%) | 0/75 (0.0%) | — |
| Death | 0/24 (0.0%) | 0/75 (0.0%) | — |
| Headache‐related data | |||
| Unilateral | 1/24 (4.2%) | 12/75 (16.0%) | >.999 |
| Holocranial | 11/24 (45.8%) | 23/75 (30.7%) | .265 |
| Throbbing | 2/24 (8.3%) | 12/75 (16.0%) | .507 |
| Long‐lasting headache† | 15/24 (62.5%) | 30/75 (40.0%) | .054 |
| Moderate‐severe headache (VAS ≥5) | 24/24 (100.0%) | 65/75 (86.7%) | .112 |
| Headache triggers | 7/24 (29.2%) | 26/75 (34.7%) | .619 |
| Wakening headache | 6/24 (25.0%) | 12/75 (16.0%) | .320 |
| Photophobia | 8/24 (33.3%) | 21/75 (28.0%) | .617 |
| Phonophobia | 5/24 (20.8%) | 22/75 (29.3%) | .416 |
| Osmophobia | 2/24 (8.3%) | 7/75 (9.3%) | .882 |
| Aggravation by physical activity | 14/24 (58.3%) | 31/75 (41.3%) | .145 |
| Nausea | 6/24 (25.0%) | 15/75 (20%) | .602 |
| Any migraine‐like feature‡ | 8/24 (33.3%) | 20/75 (26.7%) | .528 |
| Orthostatic features | 6/24 (25.0%) | 10/75 (13.3%) | .302 |
Continuous headache present for more than 1 day.
Throbbing pain, photophobia, phonophobia, osmophobia, and/or aggravation by physical activity.
ICU = intensive care unit; LDH = lactate dehydrogenase; PSI = pneumonia severity index; SatO2 = oxygen saturation; SD = standard deviation; TTH = tension‐type headache; VAS = visual analog scale; — = inconclusive results.
Fig. 2.
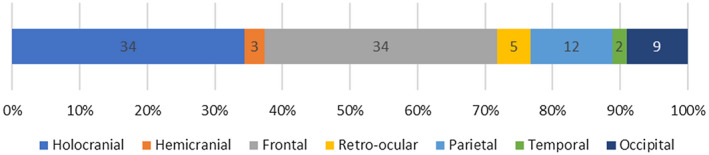
Location of headache, classified as cranial regions.
Does COVID‐19‐Related Headache Have Triggers or Time Preference?
In this study, 39/99 patients (39.4%) identified headache triggers, with fever being the most frequent (18/99 patients, 18.2%) (Fig. 3). Time preference was reported in 50/99 patients (50.5%). Headache started in the afternoon in 24/99 (24.2%), at night in 16/99 (16.2%), and in the morning in 10/99 (10.1%) patients.
Fig. 3.
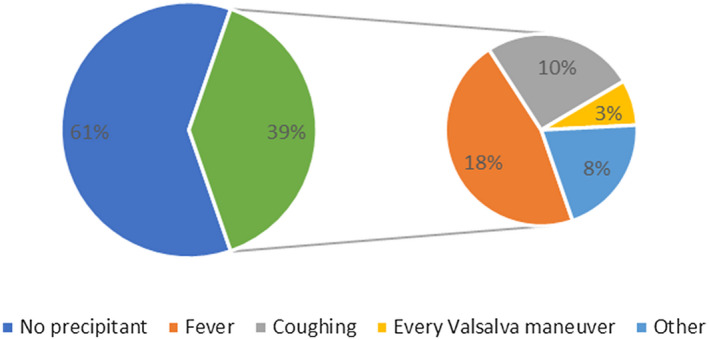
Headache triggers.
Which Factors Aggravate COVID‐19‐Related Headache and Which Features are Associated With It?
Physical activity (45/99, 45.5%) and coughing without the influence of other Valsalva maneuver (43/99, 43.4%) were frequent aggravating factors. A propensity to prostration (41/99, 41.4%) was commonly seen. Stimuli‐phobia was not rare, with an aversion to light, sound, or smell in 29/99 (29.3%), 27/99 (27.3%), and 9/99 (9.1%) patients, respectively (Fig. 4). A patient with a prior history of migraine without aura presented with visual aura. Another patient presented 2 trigeminal‐autonomic features (eyelid edema and otic fullness) ipsilateral to a unilateral headache, interestingly not presented previously to COVID‐19 symptoms and without meeting criteria for any primary headache.
Fig. 4.
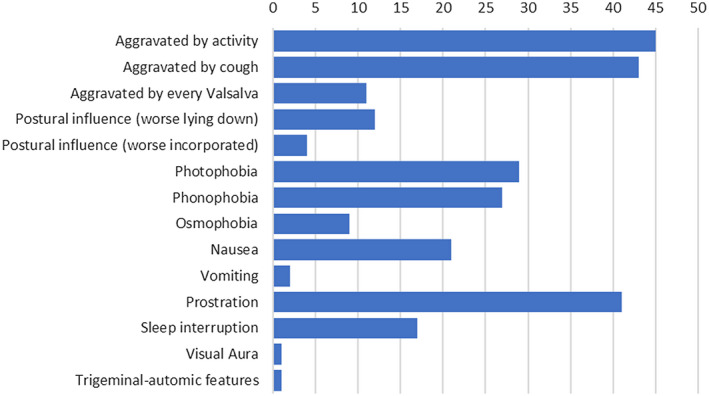
Aggravating factors and features associated with headache.
How Did COVID‐19‐Related Headache Impact on Usual Activity and How Did It Respond to Medication?
The need for cessation of usual activity was fairly frequent, being reported by 23/99 subjects (23.2%). Most of the patients (91/99, 91.9%) used medication for symptomatic relief. The most commonly used drug was acetaminophen (74/99, 74.7%). The remaining patients used nonsteroidal anti‐inflammatory drugs (NSAIDs), metamizole, triptans, or a combination of them. These drugs achieved complete pain relief in only 26/99 (26.3%) cases. Partial response was more frequent (53/99, 53.5%). Further data and comparisons are summarized in Table 4.
Table 4.
COVID‐19‐Related Headache Medication Response in Patients With and Without Prior History of Migraine
| No Medication | Patients Without Migraine (N = 74) | Patients With Migraine (N = 25) | P | ||||||
|---|---|---|---|---|---|---|---|---|---|
| 8/74 (10.8%) | 0/25 (0.0%) | .196 | |||||||
| No Response | Partial Response | Total Response | No Response | Partial Response | Total Response | No Response | Partial Response | Total Response | |
| Paracetamol | 7/54 (13.0%) | 29/54 (53.7%) | 18/54 (33.3%) | 3/20 (15.0%) | 12/20 (60.0%) | 5/20 (25.0%) | >0.999 | 0.825 | 0.685 |
| NSAIDs | 2/5 (40.0%) | 1/5 (20.0%) | 2/5 (40.0%) | 0/2 (0.0%) | 2/2 (100.0%) | 0/2 (0.0%) | >0.999 | 0.143 | >0.999 |
| Metamizole | 0/1 (0.0%) | 1/1 (100.0%) | 0/1 (0.0%) | 0 | 0 | 0 | — | >0.999 | — |
| Triptan | 0 | 0 | 0 | 0/1 (0.0%) | 1/1 (100.0%) | 0/1 (0.0%) | — | >0.999 | — |
| Paracetamol + NSAID | 0/2 (0.0%) | 2/2 (100.0%) | 0/2 (0.0%) | 0/1 (0.0%) | 1/1 (100.0%) | 0/1 (0.0%) | — | >0.999 | — |
| Paracetamol + Metamizole | 0/3 (0.0%) | 3/3 (100.0%) | 0/3 (0.0%) | 0/1 (0.0%) | 1/1 (100.0%) | 0/1 (0.0%) | — | >0.999 | — |
NSAID = nonsteroidal anti‐inflammatory drug; — = inconclusive results.
How Does COVID‐19‐Related Headache Affect Patients With Prior History of Migraine?
As previously depicted in Table 1, only 3/46 (6.5%) patients without headache in the context of COVID‐19 had a prior history of migraine, as opposed to 25/99 (25.3%) individuals with migraine in the headache group (P = .007). Status migrainosus occurred in 2/25 (8.0%) patients with migraine in the context of COVID‐19. In our sample, the frequency of status migrainosus in all patients with headache in the context of COVID‐19 is 2.0% (2/99). Most patients with previous headache disorder (28/33, 84.9%) suffered from a headache that was clearly different from previous episodes. A longer COVID‐19‐related headache was observed in patients with migraine compared to those without this condition (Fig. 5), resulting in a statistically significant association (P < .001, 95% CI: 0.272, 0.652). Most notably, 80% of individuals with migraine (20/25) had pain episodes lasting more than 24 hours, while only 33.8% of patients without migraine (25/74) presented with headache longer than 1 day. Migraine patients scored higher on the VAS than individuals without migraine (median ± IR 8.0 ± 2.5 vs 7.0 ± 3.0, P = .444). The proportion of patients with moderate‐severe headache was also higher in the migraine group (25/25 [100.0%] vs 63/74 [85.1%], P = .043 [95% CI: 0.057‐0.213]). Interestingly, there was no difference between the prevalence of migraine‐like features in patients with migraine vs patients without this condition. The prevalence of anosmia was significantly higher in patients with a previous history of migraine (17/25 [68.0%] vs 32/74 [43.2%], P = .042 [95% CI: 0.033, 0.462]). The comparisons are summarized in Table 5.
Fig. 5.
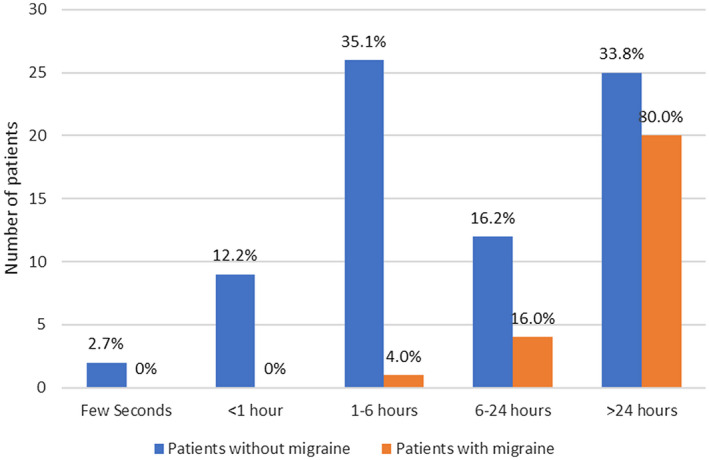
Distribution of COVID‐19‐related headache episode duration in patients with and without migraine (P < .001).
Table 5.
Comparison of COVID‐19‐Related Headache Features Between Migraine and Non‐Migraine Patients
| All Headache Patients [95% CI] N = 99 | Patients Without Migraine [95% CI] n = 74 | Patients With Migraine [95% CI] n = 25 | Difference in Proportions [95% CI] P Value | |
|---|---|---|---|---|
| Headache at onset† | 81 (81.8%) [0.720, 0.879] | 57 (77.0%) [0.658, 0.860] | 24 (96.0%) [0.797, 0.999] | 19.0% [0.067, 0.313] P = .023 |
| Unilateral | 13 (13.1%) [0.072, 0.214] | 9 (12.2%) [0.057, 0.218] | 4 (16.0%) [0.045, 0.361] | 3.7% [−0.123, 0.200] P = .443 |
| Holocranial | 34 (34.3%) [0.251, 0.456] | 25 (33.8%) [0.232, 0.457] | 9 (36.0%) [0.180, 0.575] | 2.2% [−0.195, 0.239] P = .840 |
| Throbbing | 14 (14.1%) [0.080, 0.226] | 11 (14.9%) [0.077, 0.250] | 3 (12.0%) [0.026, 0.312] | −2.9% [−0.180, 0.122] P = .487 |
| Long‐lasting headache‡ | 45 (45.5%) [0.354, 0.558] | 25 (33.8%) [0.232, 0.457] | 20 (80.0%) [0.593, 0.932] | 46.2% [0.272, 0.652] P ≤ .001 |
| Moderate‐severe headache (VAS ≥5) | 89 (89.9%) [0.822, 0.951] | 63 (85.1%) [0.766, 0.933] | 25 (100.0%) [0.862, 1.000] | 13.6% [0.057, 0.213] P = .043 |
| Headache triggers | 33 (33.3%) [0.242, 0.435] | 26 (35.1%) [0.244, 0.471] | 7 (28.0%) [0.120, 0.494] | −7.1% [−0.278, 0.136] P = .513 |
| Wakening headache | 18 (18.2%) [0.112, 0.272] | 14 (18.9%) [0.108, 0.297] | 4 (16.0%) [0.045, 0.361] | −2.9% [−0.198, 0.140] P = .542 |
| Photophobia | 29 (29.3%) [0.206, 0.393] | 23 (31.1%) [0.208, 0.429] | 6 (24.0%) [0.094, 0.451] | −7.1% [−0.269, 0.127] P = .559 |
| Phonophobia | 27 (29.3%) [0.188, 0.372] | 19 (25.7%) [0.162, 0.372] | 8 (32.0%) [0.150, 0.535] | 6.3% [−0.145, 0.271] P = .291 |
| Osmophobia | 9 (9.1%) [0.042, 0.166] | 7 (9.5%) [0.039, 0.185] | 2 (8.0%) [0.010, 0.260] | −1.5 [−0.140, 0.111] P = .578 |
| Aggravation by physical activity | 45 (45.5%) [0.354, 0.558] | 33 (44.6%) [0330, 0.566] | 12 (48.0%) [0.278, 0.687] | 3.4% [−0.192, 0.260] P = .758 |
| Nausea | 21 (21.2%) [0.136, 0.305] | 13 (17.6%) [0.097, 0.282] | 8 (32.0%) [0.150, 0.535] | 14.4% [−0.058, 0.347] P = .145 |
| Any migraine‐like feature§ | 68 (68.7%) [0.586, 0.776] | 49 (66.2%) [0.54, 0.77] | 19 (76.0%) [0.55, 0.91] | −0.098 [−0.10, 0.30] P = .254 |
| Orthostatic features | 16 (16.2%) [0.095, 0.249] | 12 (16.2%) [0.087, 0.266] | 4 (16.0%) [0.045, 0.361] | −0.2% [−0.169, 0.164] P = .531 |
| Anosmia | 49 (49.5%) [0.393, 0.597] | 32 (43.2%) [0.318, 0.553] | 17 (68.0%) [0.465, 0.851] | 24.8% [0.033, 0.462] P = .042 |
Headache presented before or simultaneously to other COVID‐19 symptoms.
Continuous headache present for more than 1 day.
Throbbing pain, photophobia, phonophobia, osmophobia, and/or aggravation by physical activity.
CI = confidence interval; VAS = visual analog scale.
Discussion
To the best of our knowledge, this is the first study to specifically evaluate the semiological features of headache in patients with COVID‐19 visiting the emergency department. The prevalence of headache in COVID‐19 in our sample is similar to that reported for health workers tested for SARS‐CoV‐2 in a previous study. 25 One recently published meta‐analysis of 3062 COVID‐19 patients reported a much lower headache prevalence. 22 This difference is probably because both our study and the health workers’ survey specifically addressed headaches. Presumably, this symptom is underrepresented in most cases, as other serious clinical scenarios may overshadow it. Our study was conducted in the emergency department, which highlights the recognition of headache as a cardinal and frequent symptom of acute COVID‐19.
The ICHD‐III diagnostic criteria for acute headache attributed to systemic viral infection points out that headache may be of any duration, if evidence of causation is demonstrated by certain clinical aspects, including diffuse pain and moderate or severe intensity. In our sample, only a minority of patients reported diffuse pain. Most of them could identify a certain pain location in relation to the cranial site, most notably frontal, followed by parietal. Most patients in our sample experienced moderate‐to‐severe headache, which was a constant symptom in patients with migraine. In the only case report of meningoencephalitis caused by SARS‐CoV‐2 with microbiological confirmation in CSF, the patient presented with headache among the prodromal symptoms that were followed by altered level of consciousness and seizures, but the semiological characteristics of this headache were not reported. 21 None of our patients presented neck stiffness, altered level of consciousness, seizures, or other symptoms that raised the suspicion of a CNS infection. In that case, they would have been classified higher than 4 in the Manchester Triage System, and therefore they would not have met the inclusion criteria. In our sample, some semiological features related to intracranial hypertension were not uncommon (most notably, worsening with cough but no other Valsalva maneuver). Nevertheless, worsening with every Valsalva maneuver and on lying down are much infrequent. As none of the subjects in our sample underwent CSF analysis, we cannot rule out that COVID‐19‐related headache may be caused by SARS‐CoV‐2 meningeal involvement in some cases.
We found that the presence of migraine‐like symptoms such as photophobia and phonophobia, and aggravation by physical activity was frequent, in both migraine and non‐migraine patients. This fact could be partly explained by convergent pathogenic mechanisms between migraine and COVID‐19‐related headaches. Proinflammatory cytokines, including interleukin (IL) 1β, IL‐6, IL‐8, and tumor necrosis factor α, have been implicated in migraine pain and are also released in the immune reaction against influenza viruses, rhinoviruses, CoVs, and other pathogens. 24 , 33 Although there is no solid evidence, the immune response to SARS‐CoV‐2 is a probable mechanism in the pathophysiology of COVID‐19‐related headache, with or without meningeal inflammation. However, we did not find a statistically significant correlation between laboratory parameters and intensity of pain or duration of headache episodes. An assessment of how COVID‐19 affects patients with a previous headache disorder is needed for optimal management. Almost all the patients in our sample with a prior history of headache disorders had pain that was different from the usual. Adequate education on COVID‐19 for patients attending headache clinics should highlight that COVID‐19 can start with a headache than is different from that usually experienced, before other COVID‐19‐related symptoms. We emphasize the importance of recognizing this symptom to establish an early diagnosis and preventive measures.
We found that patients with migraine tend to have longer and more intense episodes of COVID‐19 headaches. Increased nociceptive processing in the trigeminal cervical complex, especially in the context of peripheral sensitization of the trigeminal nerve that may occur after sustained migraine attacks, can lead to the development of central sensitization and lower pain thresholds in patients with migraine and perceptual responses being exaggerated, prolonged and of wider spread. 34 , 35 , 36 Taking this into account, it is not surprising that migraine individuals experience more prolonged and severe secondary cephalalgia, including COVID‐19‐related headaches, than those without this condition. Our results showed that COVID‐19 in patients with migraine tends to debut with headache as the first symptom when compared with non‐migraine individuals. The same pathophysiologic model may explain this finding as well, as a sensitized trigeminal cervical complex, which might react earlier to the inflammatory response of COVID‐19, leading to headaches.
Many of the features reported by the headache specialist who described his own experience with headache during COVID‐19 infection align with our most frequent findings, such as the quality of pain being pressing and aggravated by coughing. 26 Our patients did not report a multiphasic course with headache changing its semiology, but our study is not appropriate to exclude this possibility owing to its cross‐sectional design.
Our study has several limitations, such as the small sample size, the cross‐sectional design, the fact that multiple questionnaire items relied on patient memory and subjective perception of symptoms (such as identifying triggers) and the limited number of patients suffering from migraine. Besides, slightly less than half of the patients showed microbiological confirmation of SARS‐CoV‐2. We used the WHO guidelines definitions to define a probable COVID‐19 case, but little can be said about the reliability of this classification. Some patients presented with typical COVID‐19 pneumonia with negative PCR testing (most probably a false‐negative result). No microbiological determination was performed on the remaining patients, but they had a compatible clinical syndrome and close risk contacts. The contagious capacity of SARS‐CoV‐2 and the epidemiological context in Spain makes COVID‐19 infection the most likely diagnosis. However, patients with confirmed COVID‐19 showed a statistically significant incidence of anosmia, pneumonia and necessity for hospital admission than those with probable COVID‐19. Studies investigating headache in a large sample of confirmed COVID‐19 patients are needed. Headache variables did not present a statistically significant difference (apart from headache at onset, which was lower in the probable COVID‐19 group). Patients visiting the emergency department were included; thus, this sample may not be fully representative of headache attributed to COVID‐19 in other clinical settings. Many comparisons were required to study evaluate this study hypotheses; therefore, type I error is probably greater than desirable given the number of statistical interferences. These patients did not undergo the full battery of tests to exclude all complications of COVID‐19 that may cause headache (CNS infection, stroke, cerebral venous thrombosis, etc.). However, none of them presented with altered level of consciousness, neurological focal signs, or other clinical data that raised suspicion about these conditions. Lastly, this study has inherent biases associated with convenience sampling: our findings cannot be inferred to the complete spectrum of the COVID‐19 disease, as we excluded patients who required emergent diagnostic‐therapeutic intervention at the time of consulting. Nevertheless, we decided that this method of sampling was the most appropriate for recruiting patients in the emergency department in the context of the epidemiological crisis at the time the study was conducted.
Among the strengths of the study, the questionnaire, used according to the recommendations of the International Headache Society, was designed by a headache specialist neurologist, which made it easier for emergency physicians to describe the headaches accurately. The study was carried out in a public hospital that had confirmed more than 4000 people with COVID‐19, and has become a reference for patients with this infection. For all these reasons, our research has clinical implications in the fight against the pandemic and places headache as a symptom to be considered primarily among patients with COVID‐19.
Furthermore, well‐designed prospective studies are needed to enhance our knowledge on headaches and COVID‐19 for better management of the patients.
Conclusion
Headache is a very common COVID‐19 symptom among patients presenting to the emergency room. Its semiological characteristics can be highly diverse, but most frequently present as holocranial or bifrontal moderate‐to‐severe pain with pressing quality and migraine‐like features are not rare. In migraine patients, COVID‐19 headache tends to last longer, is more severe and presents earlier in the course of the disease than in patients without migraine.
Statement of Authorship
Category 1
(a) Conception and Design
Javier Díaz de Terán
(b) Acquisition of Data
Javier A. Membrilla, Íñigo de Lorenzo
(c) Analysis and Interpretation of Data
Javier A. Membrilla, Íñigo de Lorenzo, María Sastre, Javier Díaz de Terán
Category 2
(a) Drafting the Manuscript
Javier A. Membrilla, Íñigo de Lorenzo
(b) Revising It for Intellectual Content
María Sastre, Javier Díaz de Terán
Category 3
(a) Final Approval of the Completed Manuscript
Javier Díaz de Terán
Acknowledgments
The authors thank María Isabel Garrido, Lucia Esteban, all our medical resident colleagues in the Emergency Department, the physicians at “La Paz” Neurology Department, and COVID‐19 patients and their families.
Conflict of Interest: None
Funding: None
References
- 1. Rothan HA, Byrareddy SN. The epidemiology and pathogenesis of coronavirus disease (COVID‐19) outbreak. J Autoimmun. 2020;109:102433. [DOI] [PMC free article] [PubMed] [Google Scholar]
- 2. Spain: WHO Coronavirus Disease (COVID‐19) Dashboard. Available at: https://covid19.who.int/region/euro/country/es. Accessed May 8, 2020. [Google Scholar]
- 3. Huang C, Wang Y, Li X, et al. Clinical features of patients infected with 2019 novel coronavirus in Wuhan, China. Lancet. 2020;395:497‐506. [DOI] [PMC free article] [PubMed] [Google Scholar]
- 4. Tauber SC, Eiffert H, Brück W, Nau R. Septic encephalopathy and septic encephalitis. Expert Rev Anti Infect Ther. 2017;15:121‐132. [DOI] [PubMed] [Google Scholar]
- 5. Ann Yeh E, Collins A, Cohen ME, Duffner PK, Faden H. Detection of coronavirus in the central nervous system of a child with acute disseminated encephalomyelitis. Pediatrics. 2004;113:e73‐e76. [DOI] [PubMed] [Google Scholar]
- 6. Nilsson A, Edner N, Albert J, Ternhag A. Fatal encephalitis associated with coronavirus OC43 in an immunocompromised child. Infect Dis. 2020;52:419‐422. [DOI] [PubMed] [Google Scholar]
- 7. Dubé M, Le Coupanec A, Wong AHM, Rini JM, Desforges M, Talbot PJ. Axonal transport enables neuron‐to‐neuron propagation of human coronavirus OC43. J Virol. 2018;92:e00404‐18. [DOI] [PMC free article] [PubMed] [Google Scholar]
- 8. Baig AM, Khaleeq A, Ali U, Syeda H. Evidence of the COVID‐19 virus targeting the CNS: Tissue distribution, host‐virus interaction, and proposed neurotropic mechanisms. ACS Chem Neurosci. 2020;11:995‐998. [DOI] [PubMed] [Google Scholar]
- 9. Mao L, Jin H, Wang M, et al. Neurologic manifestations of hospitalized patients with coronavirus disease 2019 in Wuhan, China. JAMA Neurol. 2020;77:683. [DOI] [PMC free article] [PubMed] [Google Scholar]
- 10. Chen N, Zhou M, Dong X, et al. Epidemiological and clinical characteristics of 99 cases of 2019 novel coronavirus pneumonia in Wuhan, China: A descriptive study. Lancet. 2020;395:507‐513. [DOI] [PMC free article] [PubMed] [Google Scholar]
- 11. Guan W, Ni Z, Hu Y, et al. Clinical characteristics of coronavirus disease 2019 in China. N Engl J Med. 2020;382:1708‐1720. [DOI] [PMC free article] [PubMed] [Google Scholar]
- 12. Wu C, Chen X, Cai Y, et al. Risk factors associated with acute respiratory distress syndrome and death in patients with coronavirus disease 2019 pneumonia in Wuhan, China. JAMA Intern Med. 2020;180:934‐943. [DOI] [PMC free article] [PubMed] [Google Scholar]
- 13. Arentz M, Yim E, Klaff L, et al. Characteristics and outcomes of 21 critically Ill patients with COVID‐19 in Washington State. JAMA. 2020;323:1612‐1614. [DOI] [PMC free article] [PubMed] [Google Scholar]
- 14. Lechien JR, Chiesa‐Estomba CM, De Siati DR, et al. Olfactory and gustatory dysfunctions as a clinical presentation of mild‐to‐moderate forms of the coronavirus disease (COVID‐19): A multicenter European study. Eur Arch Otorhinolaryngol. 2020;277:2251‐2261. [DOI] [PMC free article] [PubMed] [Google Scholar]
- 15. Zhao K, Huang J, Dai D, Feng Y, Liu L, Nie S. Acute myelitis after SARS‐CoV‐2 infection: A case report. Neurology. 2020. Jun 6. doi: 10.1016/j.bbih.2020.100091 [Epub ahead of print] [DOI] [Google Scholar]
- 16. Poyiadji N, Shahin G, Noujaim D, Stone M, Patel S, Griffith B. COVID‐19‐associated acute hemorrhagic necrotizing encephalopathy: CT and MRI features. Radiology. 2020;296:E119‐E120. [DOI] [PMC free article] [PubMed] [Google Scholar]
- 17. Parsons T, Banks S, Bae C, Gelber J, Alahmadi H, Tichauer M. COVID‐19‐associated acute disseminated encephalomyelitis (ADEM). Journal of Neurology. 2020;May :1–4.. [DOI] [PMC free article] [PubMed] [Google Scholar]
- 18. Gutiérrez‐Ortiz C, Méndez A, Rodrigo‐Rey S, et al. Miller Fisher syndrome and polyneuritis cranialis in COVID‐19. Neurology. 2020;95:e601‐e605. [DOI] [PubMed] [Google Scholar]
- 19. Zhao H, Shen D, Zhou H, Liu J, Chen S. Guillain‐Barré syndrome associated with SARS‐CoV‐2 infection: Causality or coincidence? Lancet Neurol. 2020;19:383‐384. [DOI] [PMC free article] [PubMed] [Google Scholar]
- 20. García‐Moncó JC, Erro ME, García Azorín D, Ezpeleta D. Neurological syndrome associated with SARS‐CoV‐2 infection. In: García Azorín D, Ezpeleta D, eds.COVID‐19 Manual for the General Neurologist, 1st edn. Madrid: Ediciones SEN; 2020:35‐46. [Google Scholar]
- 21. Moriguchi T, Harii N, Goto J, et al. A first case of meningitis/encephalitis associated with SARS‐Coronavirus‐2. Int J Infect Dis. 2020;94:55‐58. [DOI] [PMC free article] [PubMed] [Google Scholar]
- 22. Zhu J, Ji P, Pang J, et al. Clinical characteristics of 3062 COVID‐19 patients: A meta‐analysis. J Med Virol. 2020. Apr 15. doi: 10.1002/jmv.25884. [Epub ahead of print] [DOI] [PMC free article] [PubMed] [Google Scholar]
- 23. Headache Classification Committee of the International Headache Society (IHS) . The International Classification of Headache Disorders, 3rd edition. Cephalalgia. 2018;38:1‐211. [DOI] [PubMed] [Google Scholar]
- 24. Eccles R. Understanding the symptoms of the common cold and influenza. Lancet Infect Dis. 2005;5:718‐725. [DOI] [PMC free article] [PubMed] [Google Scholar]
- 25. Tostmann A, Bradley J, Bousema T, et al. Strong associations and moderate predictive value of early symptoms for SARS‐CoV‐2 test positivity among healthcare workers, the Netherlands, March 2020. Eurosurveillance. 2020;25:2000508. [DOI] [PMC free article] [PubMed] [Google Scholar]
- 26. Belvis R. Headaches during COVID‐19: My clinical case and review of the literature. Headache. 2020;60:1422‐1426. [DOI] [PMC free article] [PubMed] [Google Scholar]
- 27. Porta‐Etessam J, Matías‐Guiu JA, González‐García N, et al. Spectrum of headaches associated with SARS‐CoV‐2 infection: Study of healthcare professionals. Headache. 2020;60:1697‐1704. [DOI] [PMC free article] [PubMed] [Google Scholar]
- 28. von Elm E, Altman DG, Egger M, Pocock SJ, Gøtzsche PC, Vandenbroucke JP. The Strengthening the Reporting of Observational Studies in Epidemiology (STROBE) statement: Guidelines for reporting observational studies. Int J Surg. 2014;12:1495‐1499. [DOI] [PubMed] [Google Scholar]
- 29. Mackway‐Jones K, Marsden J, Windle J. Emergency Triage: Manchester Triage Group, 3rd edn. Manchester: BMJ Books; 2014. [Google Scholar]
- 30. World Health Organization . Global Surveillance for COVID‐19 Caused by Human Infection With COVID‐19 Virus: Interim Guidance. World Health Organization; 2020. Available at: https://apps.who.int/iris/handle/10665/331506. License: CC BY‐NC‐SA 3.0 IGO. [Google Scholar]
- 31. Sanitary Alerts and Emergencies Coordination Center, Public Health General Direction . COVID‐19 Management in the Emergency Department. Ministry of Health, Consumer Affairs and Social Welfare (Government of Spain); 2020:12. Report No. 2. [Google Scholar]
- 32. Terpos E, Ntanasis‐Stathopoulos I, Elalamy I, et al. Hematological findings and complications of COVID‐19. Am J Hematol. 2020;95:834‐847. [DOI] [PMC free article] [PubMed] [Google Scholar]
- 33. Theoharides TC, Donelan J, Kandere‐Grzybowska K, Konstantinidou A. The role of mast cells in migraine pathophysiology. Brain Res Rev. 2005;49:65‐76. [DOI] [PubMed] [Google Scholar]
- 34. Andreou AP, Edvinsson L. Mechanisms of migraine as a chronic evolutive condition. J Headache Pain. 2019;20:117. [DOI] [PMC free article] [PubMed] [Google Scholar]
- 35. Russo A, Coppola G, Pierelli F, et al. Pain perception and migraine. Front Neurol. 2018;2:576. [DOI] [PMC free article] [PubMed] [Google Scholar]
- 36. Iyengar S, Johnson KW, Ossipov MH, Aurora SK. CGRP and the trigeminal system in migraine. Headache. 2019;59:659‐681. [DOI] [PMC free article] [PubMed] [Google Scholar]