

Summary
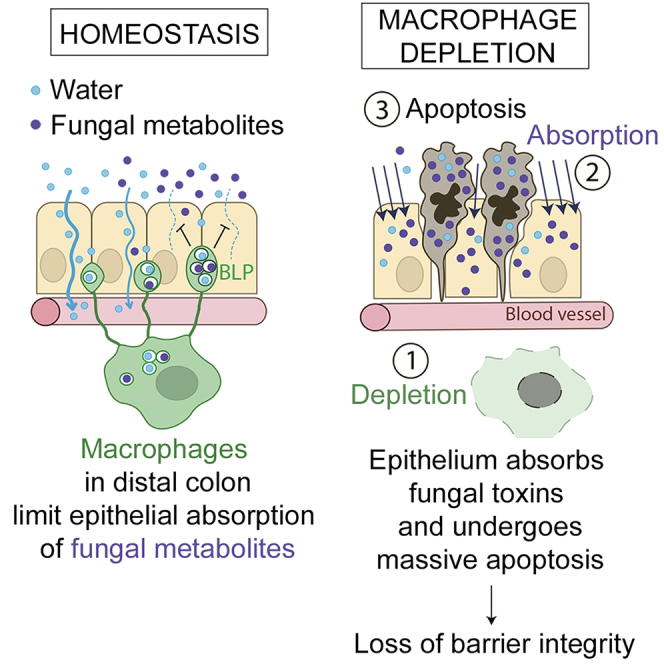
The colon is primarily responsible for absorbing fluids. It contains a large number of microorganisms including fungi, which are enriched in its distal segment. The colonic mucosa must therefore tightly regulate fluid influx to control absorption of fungal metabolites, which can be toxic to epithelial cells and lead to barrier dysfunction. How this is achieved remains unknown. Here, we describe a mechanism by which the innate immune system allows rapid quality check of absorbed fluids to avoid intoxication of colonocytes. This mechanism relies on a population of distal colon macrophages that are equipped with “balloon-like” protrusions (BLPs) inserted in the epithelium, which sample absorbed fluids. In the absence of macrophages or BLPs, epithelial cells keep absorbing fluids containing fungal products, leading to their death and subsequent loss of epithelial barrier integrity. These results reveal an unexpected and essential role of macrophages in the maintenance of colon-microbiota interactions in homeostasis.
Video Abstract
Keywords: macrophages, gut, epithelium integrity, fungi, microbiota, fluid absorption, protrusions, colon, metabolites, toxins
Graphical Abstract
Highlights
-
•
Epithelium in the distal colon requires macrophages (Мɸs) for survival
-
•
Distal colon Мɸs insert “balloon-like” protrusions (BLPs) in the epithelium
-
•
BLPs sense fungal toxins within the fluids absorbed through epithelial cells
-
•
BLP+ Мɸs prevent the absorption of fungal toxins, protecting the barrier integrity
Protrusions on distal colonic macrophages orchestrate fluid sampling, which is critical to protect epithelial cells from absorbing fluids enriched in fungi toxins/metabolites.
Introduction
The intestinal tract provides a unique environment because it is continuously exposed to food antigens as well as to the commensal microbiota. It comprises different regions with distinct anatomies and physiological roles. Maintenance of the intestinal barrier is critical given that it controls the absorption of nutrients, electrolytes, and water from the gut lumen into the blood circulation and further prevents the absorption of toxic luminal substances (Al-Bahrani et al., 2010). Accordingly, disruption of the intestinal barrier leads to multiple pathological situations ranging from nutrient deprivation (Fishman et al., 2014) and inflammatory bowel diseases (Anbazhagan et al., 2018; Michielan and D’Incà, 2015) to sepsis (Yoseph et al., 2016) and multi-organ failure (Al-Bahrani et al., 2010; de Haan et al., 2009; Swank and Deitch, 1996).
Among the different regions of the intestine, the distal colon is particularly important for fluid absorption. On the one hand, the distal colon epithelium is exposed to the elevated osmotic pressure needed to induce water absorption by epithelial cells to dehydrate and solidify feces (Naftalin, 1994). On the other hand, the distal colon faces a tremendous amount of microorganisms, including bacteria, fungi, archaea, and viruses (Donaldson et al., 2016; Flynn et al., 2018; Leonardi et al., 2018; Scupham et al., 2006). In particular, fungi are more abundant in the distal colon and can produce metabolites that trigger apoptosis of intestinal epithelial cells (Upperman et al., 2003). The colonic mucosa must therefore tightly regulate fluid absorption to avoid potential entry of toxic fungal metabolites into epithelial cells and further into the blood circulation. The mechanisms underlying such regulation remain unknown.
Fluid absorption in the distal colon is achieved by a single-layered epithelium displaying a selective permeability. Permeability is controlled by the presence of (1) an abundant mucus, which consists of net-like polymers (Matsuo et al., 1997) and acts as a physical mesh separating the colon luminal content from the epithelium (Kamphuis et al., 2017), and (2) junctional complexes, which seal the space between epithelial cells (Ballard et al., 1995). Fluid absorption through epithelial cells is tightly coordinated by sodium pumps, ionic channels, transporters (e.g., ENac, Na/K-ATPase), and Aquaporins (Masyuk et al., 2002). Altogether, these components control the selective absorption of nutrients, electrolytes, and water. This process, referred to as intestinal permeability, continuously adapts to fluctuations in the availability of nutrients and electrolytes and to the body salt/water balance (Martínez et al., 2012; De Santis et al., 2015). Intestinal permeability is also regulated by the microbiota (Yu, 2018; Martinez-Guryn et al., 2018) and immune cells (Dalton et al., 2006; Groschwitz et al., 2009; Musch et al., 2002). How the dialog between intestinal epithelial cells, microbes, and immune cells is orchestrated to maintain intestinal permeability in homeostasis remains unclear.
In homeostatic conditions, one of the most abundant types of intestinal immune cells are macrophages (Mɸs), which mainly differentiate from monocytes in response to local cues. Intestinal Mɸs reside either within the lamina propria or the muscle layer, where they participate in a variety of biological processes, including the degradation of microorganisms (Smith et al., 2011), silent clearance of apoptotic bodies (Cummings et al., 2016; Sisirak et al., 2016), tissue repair (Pull et al., 2005), and gastrointestinal motility (Muller et al., 2014). Intestinal Mɸs also limit inflammation (Shouval et al., 2017; Ueda et al., 2010; Zigmond et al., 2014) and facilitate the survival of local FOXP3+ T regulatory cells and tolerance to food (Brockmann et al., 2017; Mazzini et al., 2014). The function of Mɸs is tightly regulated by the microbiota (Schulthess et al., 2019) and, accordingly, they are more abundant in the colon than in the small intestine (Denning et al., 2011; Nagashima et al., 1996). Interestingly, in the colon, Mɸs can be found in close association with epithelial cells (Kang et al., 2020; Nagashima et al., 1996). Disruption of Mɸs’ sub-epithelial localization participates in the loss of intestinal barrier integrity observed in inflammatory bowel diseases such as ulcerative colitis and Crohn’s disease (Nalle and Turner, 2015). Mɸs are, therefore, ideally positioned to orchestrate epithelial cell-microbiota interactions for maintenance of colon homeostasis.
Here, we investigated the role of Mɸs in the integrity and function of the colon epithelium in homeostasis. We show that sub-epithelial Mɸs perform a rapid quality check of the fluids absorbed through distal colon epithelial cells, protecting them from being poisoned by luminal fungal metabolites.
Results
Mɸ Control Epithelial Cell Survival and Barrier Integrity in the Distal Colon
The gut immune system is highly compartmentalized, with different cell types distributed in gradients along the intestine (Mowat and Agace, 2014). This particularly concerns Mɸs, which are present in greater amounts in the colon as compared to the small intestine. Colonic Mɸs display an anergic phenotype (Bain et al., 2013; Smythies et al., 2005) and their loss correlates with the development of ulcerative colitis and Crohn’s disease (Rubio et al., 2018), suggesting a contribution to the maintenance of epithelium integrity. However, the mechanism(s) by which Mɸs achieve such a homeostatic function in vivo remains unknown. To address this question, we depleted Mɸs using the CD64DTR mouse model (Baranska et al., 2018) and evaluated the state of the epithelium (Figure 1A). We analyzed both proximal and distal colons as they are known to exhibit differences both in physiology (Dolman and Edmonds, 1975; Foster et al., 1986; Hardin et al., 1999) and microbiota composition (Flynn et al., 2018; Leonardi et al., 2018). The efficient depletion of colonic Mɸs was verified by flow cytometry and immunostaining in both colon segments (Figure S1A). Unexpectedly, we found that Mɸ depletion led to massive apoptosis of epithelial cells in the distal but not the proximal colon (Figures 1B and 1C). Death of epithelial cells in the distal colon was also observed when Mɸs were depleted by injecting anti-CSF1 receptor antibodies in C57BL/6J mice (Figures S1B and S1C). Of note, if the presence of apoptotic cells merely resulted from the lack of scavenging by Mɸs, equal numbers of dead cells should be detected in distal and proximal colons (Figure 1C). Our results, therefore, suggest that Mɸs facilitate the survival of epithelial cells in the distal colon specifically.
Figure 1.

Mɸs Are Required for Epithelial Cell Survival in the Distal Colon and Form “Balloon-like” Protrusions Inserted in between Epithelial Cells
(A) Scheme of Мф depletion. CD64WT or CD64DTR littermates received two injections of diphtheria toxin (DT) 24 h apart.
(B) Maximum z-projection (30 μm) of proximal and distal colon transversal sections 44 h after the first DT injection. Apoptotic cells were revealed with cleaved caspase 3 staining (red), F-actin (green). Scale bar: 50 μm.
(C) Number of apoptotic epithelial cells per crypt in the distal or proximal colon. Pooled data from three independent experiments; dots represent average number per individual mouse. Mean ± SEM, multiple comparison Kruskal-Wallis test, ∗p < 0.05.
(D) Serum fluorescence intensities 5–10 min after intra-rectal administration of hypotonic solution of hydrazide-AlexaFluor633. All mice were injected with DT. Pooled data from two independent experiments; dots represent average number per individual mouse. Mean ± SEM, Mann-Whitney test, ∗p < 0.05.
(E) Morphological differences of Мфs in the proximal and distal colon. Whole-mount staining of the distal and proximal colon of CD11c: Cre/R26mTmG mice. mGFP (green), CD11b (blue), CD103 (red), membrane tdTomato (gray). BLPs are indicated with arrows, the border between epithelium and the stroma is indicated with the dashed line. Z-projections of 20–40 μm; scale bars: 50 μm.
(F) Single Mф forming BLPs (left) or thin extensions (right). Yellow star: cell bodies; green arrows: BLPs; green arrowheads: extensions. Maximum z-projection of 10–15 μm; scale bar: 2 μm.
(G) Number of BLPs, normalized per crypt (left) or per Mф (right). Dots represent average number per individual mouse; left: pooled data from seven independent experiments; right: pooled data from another two independent experiments.
(H) Number of Mфs in the proximal and distal colon, analyzed by imaging (F4/80+MHCII+CD103− cells per crypt; each dot represents average number per individual mouse; data pooled from three independent experiments) and by flow cytometry (presented as percentage of CD45+ cells; dots represent individual mouse; data pooled from four independent experiments).
(I) Number of extensions, normalized per Mф. Dots represent average number per individual mouse; four independent experiments.
In (G–I), mean ± SEM, Mann-Whitney test, ∗p < 0.05, ∗∗p < 0.01, ∗∗∗∗p < 0.0001. See also Figure S1 and S2, Video S1.
Figure S1.

Mф Depletion Efficiency Using CD64DTR and Anti-CSF1R Antibody-Mediated Models, Related to Figure 1
(A) Mф depletion efficiency using CD64DTR model analyzed by imaging and flow cytometry in the proximal and the distal colon.
(B) Mф depletion efficiency using anti-CSF1R antibody – mediated model analyzed by imaging and flow cytometry in the proximal and the distal colon.
(C) Number of apoptotic epithelial cells per crypt in the distal or proximal colon of control or anti-CSF1R antibody-injected mice. Maximum z-projections of ∼30 μm, scale bar - 50 μm. Data pooled from 2 independent experiments, dots represent average number per individual mouse. Results are presented as mean ± SEM, Mann- Whitney test, ∗p < 0.05, ∗∗p < 0.01, ∗∗∗∗p < 0.0001.
To evaluate the impact of epithelial cell death on epithelium permeability, we infused CD64WT and CD64DTR mice intra-rectally with a hypotonic solution containing the small fluorescent molecule hydrazide and measured its appearance in the blood. We found that hydrazide was more abundant in the blood of Mɸ-depleted mice compared to control animals (Figure 1D), indicative of an increase in barrier permeability in these animals. Altogether, these results show that Mɸs are needed for epithelial cell survival and intestinal barrier integrity in the distal colon.
Distal Colon Mɸ Insert “Balloon-like” Protrusions in between Epithelial Cells
These results prompted us to investigate distribution of Mɸs and their physical interaction with epithelial cells in the proximal and distal colon. To address this question, we performed whole-mount immunostaining of proximal and distal colon sections isolated from CD11c-Cre/R26mTmG mice (Caton et al., 2007; Muzumdar et al., 2007). In this mouse model, all cells that express CD11c throughout their differentiation, which include intestinal Mɸs (and dendritic cells, DCs), switch from membrane-tomato to membrane-GFP expression, allowing better visualization of these phagocytes in the tissue.
Using these animals, we observed a phagocyte population in the distal colon that physically interacted with epithelial cells through membrane protrusions shaped as balloons (Figures 1E and 1F), which we will refer to as “balloon-like” protrusions (BLPs) hereafter. The cell bodies of these cells were localized around the opening of the crypts (Video S1). On average, each cell displayed three BLPs that crossed the basement membrane and contacted the base of epithelial cells. Of note, BLPs do not correspond to the “transepithelial dendrites” previously described in the small intestine (Rescigno et al., 2001; Vallon-Eberhard et al., 2006) as they do not reach the lumen of the colon. Immunostaining showed that BLP+ cells resembled bona fide intestinal Mɸs (CD11b+ MHCII+ F4/80+ CX3CR1+ CD64+ CD103− CX3CR1-GFP+; Figure S2) and accordingly, they were lost in toxin-injected CD64DTR mice (Figure S1A) (Mowat and Bain, 2011). Strikingly, reduced numbers of BLPs were observed in the proximal colon (Figures 1E and 1G), even though proximal crypts contained a similar number of Mɸs as their distal counterpart (Figure 1H). Observation of proximal colon Mɸs at higher resolution showed that they also displayed protrusions, which, however, were rather thin and without balloons (Figures 1F and 1I). We conclude that the distal colon is enriched with Mɸs equipped with peculiar balloon-like membrane protrusions inserted at the base of epithelial cells.
Figure S2.

BLP-Forming Мϕ Express Common Intestinal Macrophage Markers, Related to Figure 1
(A) Cell bodies of Mф are indicated with yellow stars, arrows indicate BLPs. CD11b, MHCII, F4/80 staining of distal colon Мф from CD11c: Cre/R26mTmG mouse, z-projection of 12 μm. Bottom panel (left): CD11b, CD103 staining of CX3CR1-GFP mouse, z-projection of 14 μm.
(B) CD64 and MHCII staining of colon Мф from CD11c: Cre/R26mTmG mouse, z-projection of 11 μm, scale bars – 20 μm.
Green – membrane GFP, blue – CD11b staining, red – CD103 staining, gray – membrane tdTomato. Scale bar – 50 μm in the beginning of the movie, arrows indicate opening of the crypts (00:18, mm:ss), body of the single Mф and BLPs (00:34, mm:ss).
BLPs Are Filled with Epithelial Cell Membranes and Endolysosomal Compartments
We next analyzed the inner structure of BLPs using high-resolution confocal microscopy. We found that BLPs were approximately 1–5 μm in diameter, some of them forming thin extensions (about 0.3 μm in diameter and 5–10 μm in length; Video S2) that extended between epithelial cells (Figure 2A, left). BLPs were filled with membranes and vesicles devoid of actin (Figure 2A, right). Most BLP internal vesicles in CD11c-Cre/R26mTmG mice were Tomato+, indicating that they originated from cells that do not express CD11c (Figure 2B, upper panel). Given the intra-epithelial localization of BLPs, we hypothesized that these membranes might come from epithelial cells. To test this hypothesis, we generated Villin: Cre-ERT2/R26mTmG mice (el Marjou et al., 2004; Muzumdar et al., 2007) in which intestinal epithelial cells express membrane GFP (mGFP). Analysis of distal colon sections from these animals showed that BLPs were filled with GFP-positive membranes (Figure 2B, lower panel), showing that they contain membranes and vesicles of epithelial origin.
Figure 2.

BLPs Contain Epithelial Cell Membranes and Are Enriched in Endolysosomal Compartments
(A) BLPs (arrow) with thin membranous extensions (arrowheads). Maximum z-projection of a 7 μm (left) and a single slice (right) of distal colonic Мфs from CD11c: Cre/R26mTmG mouse; mGFP (green); F-actin (red); DNA (blue); deconvolved. Scale bars: 10 μm, 1 μm on the magnified inset.
(B) Inner compartments of BLPs are filled with membranous material, derived from CD11c-negative cells (top panel, distal colon of CD11c: Cre/R26mTmG mouse), in part from the epithelium (bottom panel, distal colon of Villin: Cre-ERT2/R26mTmG mouse; intestinal epithelial cells express membranous GFP [green]), BLPs (MHC class II staining [red]). Maximum z-projections of 1 μm, deconvolved. Scale bar: 1 μm.
(C) Correlative electron microscopy (left) of BLP from distal colon of CD11c: Cre/R26mTmG mouse; arrow indicates a BLPs found on the confocal image (mGFP [green], membrane tdTomato, boxed [red]) and overlaid with the low-magnification TEM image; borders or the same BLPs are highlighted with yellow dashed line on the higher-magnification TEM image (right). Scale bar: 1 μm.
(D) LAMP2, LAMP1, Rab7A, and Rab11 staining of BLPs, maximum z-projections of 1–2 μm, deconvolved. Scale bars: 2 μm.
(E) MHCII, CD74, and F4/80 staining of BLPs. Maximum z-projection of 1–2 μm, deconvolved. Scale bars: 2 μm. See also Video S2.
Green – membrane GFP, red – membrane tdTomato. Scale bar – 4 μm in the beginning of the movie.
Correlative light-transmission electron microscopy analysis showed that BLP inner vesicles varied from 10 to 200 nm in diameter and were partly filled with electron-dense material, suggesting that they might contain lysosomes (Figure 2C). Accordingly, most BLPs were positive for the LAMP1, LAMP2, and Rab7A late-endosomal/lysosomal markers (LAMP1-positive, 73.3% ± 3.5%; LAMP2-positive, 62% ± 2.5%; Rab7A-positive, 63.6% ± 3%) (Figure 2D). In contrast, the marker of early endosomes, EEA1, was barely detected in BLPs (EEA1-positive, 8.8% ± 3.6%, Figure 2D). Consistent with their late-endosomal/lysosomal origin, all BLPs were also enriched in major histocompatibility complex (MHC) class II and associated invariant chain, CD74 or Ii (100%; Figure 2E). Of note, as we did not observe these two molecules in the epithelium, this result suggests that the endolysosomal markers found within BLPs were most likely expressed in the Mɸs themselves rather than internalized from neighboring cells. These data show that BLPs are filled with endolysosomal compartments that contain membranes internalized from epithelial cells.
BLP+ Mɸ Are CD11chigh
We next asked whether BLP+ Mɸs constitute a unique cell population, distinct from its BLP− counterpart. To address this question, we FACS-sorted terminally differentiated Mɸs from both proximal (majority of Mɸs are BLP−) and distal colons (majority of Mɸs are BLP+) of a C57BL/6J mouse and compared their gene expression profiles using single-cell RNA sequencing (RNA-seq) (Zheng et al., 2017) (Figure 3A; Figure S3). To reliably identify transcriptionally different Mɸ subpopulations, we adopted a semi-supervised approach to group the cells based on their gene expression profile. First, we explored different solutions obtained by varying the input with a graph-based clustering algorithm (Satija et al., 2015) to identify the cluster whose relative abundance was greater in the distal than in the proximal colon, as observed for BLP+ Mɸs. Based on the percentages of BLP+ Mɸs quantified from colon sections (Figure 3B), we selected feasible solutions as the ones where the fraction of putative BLP+ Mɸs was between 50% and 70% in the distal colon and below 40% in the proximal colon. Second, we scored the solutions using the silhouette width, a measure of the similarity of each cell to the cells of the same cluster compared to the cells belonging to the neighboring cluster. The optimal solution was then defined as a feasible one whose average silhouette width of all cells (silh(C)) and of putative BLP+ Mɸ (silh(BLP+ Mɸ)) was maximal.
Figure 3.

BLP+ Mфs Have Distinct Transcriptomic Profile and Express CD11c as a Specific Marker
(A) Single-cell RNA-seq experiment workflow. Mфs were isolated from proximal/distal colon by FACS and sequenced. 2,106 Mфs were identified, n = 1176 for proximal and n = 930 for distal colon, and shown on a t-distributed stochastic neighbor embedding (tSNE) representation; cells isolated from proximal (orange), cells from distal colon (blue) (top 22 PCs computed on the top 1,000 variable genes, vst method).
(B) Selection of clustering parameters was based on the silhouette score and expected fraction of BLP+ Mфs in proximal and distal colon obtained from IHC (mean fraction of BLP+ Mфs out of all Mфs; data pooled from two independent experiments). The selected clustering solution (graph-based clustering, 30 neighbors, resolution = 0.3) revealed the presence of two Mф subpopulations, displayed on the same tSNE as in (A) and colored accordingly: cluster 0, containing 964 cells in proximal and 390 cells in distal colon, and cluster 1, containing 212 cells in proximal and 540 cells in distal colon. Cluster 1 expresses CD11c as a specific marker.
(C) Co-staining of MHC class II and CD11c of the distal colon from C57B6J mouse. Maximum z-projection of 30 μm; scale bar: 20 μm.
(D) Percentage of CD11c+ Mфs out of all Mфs in proximal and distal colon determined by imaging (top, % of CD11c+ Mфs out of F4/80+ CD103− MHCII+ cells) or flow cytometry (bottom, % of CD11c+ Мфs out of CD45+CD3−CD19−CD11b+CD103−CD64+F4/80+Ly6C−MHCII+ cells); dots represent average number per individual mice; three independent experiments. Mean ± SEM, Mann-Whitney test, ∗∗p < 0.01.
(E) Heatmap of the top 20 significantly up- and downregulated genes between BLP+ Mфs (cluster 1) and BLP− Mфs (cluster 0), respectively, sorted by non-decreasing p value; entries represent the scaled (Z score) normalized expression, values <−2.5 or >2.5 are clipped; genes found respectively up- and downregulated in Kang et al. (2020) are highlighted in bold (see F).
(F) (Top) Comparison of significantly upregulated genes in BLP+ Mфs (cluster 1, 88 genes, in blue) and in cluster 4 from Kang et al. (2020) (166 genes, in gray). Fisher’s exact test using 10,768 detected genes in the 2,106 Mфs as background. (Bottom) Comparison of significantly upregulated genes in BLP− Mфs (cluster 0, 121 genes, in pink) and cluster 6 from Kang et al. (2020) (168 genes, in gray). See also Figures S3 and S4 and Tables S1 and S2.
Figure S3.

Gating Strategy Used to Isolate Мϕ from the Distal and the Proximal Murine Colon, Related to Figure 3
The gating strategy begins on the top row, left.
The optimal solution identified with this approach contained five clusters (Figures S4A and S4B; Table S1). Only two of them, clusters 0 and 1, expressed high levels of all Mɸ markers (CD45, CD11b, F4/80, CD64, MHCII), hence the other three, comprising 140 cells overall, likely contained contaminants (e.g., epithelial cells and fibroblasts, Figure S4C) and were therefore removed. In total, we collected 2,106 МΦs: 1,354 cells in cluster 0 and 1,752 cells in cluster 1 (Figure 3B). Whereas the distal colon sample included 58% of cells from cluster 1, the proximal colon only included 18%. This result suggested that cluster 1 is enriched for BLP+ Mɸs, whereas cluster 0 is enriched for BLP− МΦs. To test this hypothesis, we stained tissue sections with anti-CD11c (Itgax) antibodies, as the CD11c gene was found to be more expressed in cluster 1 as compared to cluster 0 (Figure 3B). Strikingly, we observed that these antibodies specifically labeled sub-epithelial BLPs+ Mɸs in the distal colon (Figure 3C). Importantly, the percentage of BLP+ Mɸs found by tissue staining (Figure 3B) was similar to the percentage of CD11chigh Mɸs defined by flow cytometry and imaging in the distal colon (Figure 3D), suggesting that tissue disaggregation leads to the limited death of BLP+ Mɸs. Altogether, these results strongly suggest that cluster 1 is enriched for BLP+ Mɸs.
Figure S4.

Single-Cell RNA Sequencing of Colonic Macrophages, Related to Figure 3
(A, left) tSNE computed on the top 22 PCs obtained on the 1000 most variable genes (vst method). Cells are colored by the sample. (A, right) tSNE computed on the top 22 PCs obtained on the 1000 most variable genes (vst method). Cells are colored by the cluster (number of neighbors = 30, resolution = 0.3).
(B) Distribution of the log-normalized expression levels of genes used for sorting terminally-differentiated Мϕ across clusters (gated on alive, CD45+, CD3-, CD19-, CD103-, CD11b+, F4/80+, CD64+, Ly6C-, MHCII+).
(C, top panel) Distribution of the log-normalized expression levels of fibroblast/myofibroblasts markers across clusters. (C, bottom panel). Distribution of the log-normalized expression level of epithelial cell markers across clusters.
(D) Clusters 4 and 6 from Kang et al., consist of terminally differentiated (mature) Mф. Venn diagram of the set of cluster 4, 6 and 7 markers (top 50 upregulated genes, gene AF251705 is excluded because it is not associated to any official gene name, Kang et al.) and the terminally differentiated macrophage signature, defined as the genes showing log2(FC) 3 3 from P1 (monocytes) to P4 (mature Мϕ) by Schridde et al. (65 genes).
BLP+ Mɸs Exhibit a Distinct Gene Expression Profile
To identify the genes specific for BLP+ Mɸs, we then extracted the genes that are differentially expressed in clusters 0 and 1. We found that 88 and 122 genes were respectively up- and downregulated in BLP+ Mɸs as compared to BLP− Mɸs (Figure 3E; Table S2). Among them, several genes could be directly or indirectly linked with microbiota recognition and inflammatory disorders in the colon, such as lgal3 (Esteban et al., 2011; Kohatsu et al., 2006; Linden et al., 2013), plaur (Genua et al., 2015; Wiersinga et al., 2010), Il1b (Seo et al., 2015), Ilr2 (Rogier et al., 2017), and cd9 (Suzuki et al., 2009).
We next compared our results to a recently published study (Kang et al., 2020) in which single-cell RNA-seq was used to identify the presence of distinct Mɸ subpopulations in the murine colon. This comparison showed that one of these subpopulations, cluster 4, which corresponded to terminally differentiated Mɸs (Figure S4D), shared 60 genes with the signature of our BLP+ Mɸ, including CD11c (Figure 3F). In contrast, the cluster described in that study as cluster 6 strongly resembled our BLP− Mɸs, with 59 overlapping genes. Consistent with our results, these two subpopulations were found to be spatially segregated within the colonic stroma; cluster 4 was localized closer to the epithelium, whereas cluster 6 was closer to the muscle layer. Interestingly, both clusters 4 and 6 were decreased in germ-free mice (Kang et al., 2020). These results suggest that BLP+ colonic Mɸs correspond to a specific Mɸ subpopulation that is enriched in the distal colon, forms tight interactions with epithelial cells, and might be influenced by the microbiota.
Intestinal Fungi Augment the Formation of BLPs
These results prompted us to evaluate the impact of the microbiota on BLP+ Mɸs. The colon harbors the largest amount of microorganisms in the body, where commensal bacterial and fungal populations share the intestinal niche (Donaldson et al., 2016; Leonardi et al., 2018). To assess the potential effect of bacteria and fungi on the formation of BLPs, we treated mice with a broad-spectrum antibiotic cocktail or anti-fungal agents. While there was no effect of antibiotics (Figure 4A), two anti-fungal agents, fluconazole and amphotericin B, significantly decreased the number of BLPs (Figures 4A and 4B) without altering the total number of Mɸs (Figure S5A). We have previously highlighted that these drugs efficiently reduce the amount of intestinal fungi in mice (Wheeler et al., 2016) but using distinct mechanisms of action (Anderson et al., 2014; Bolard et al., 1993; Morrow, 1991). Tissue staining showed that the number of subepithelial Mɸs was also unchanged in mice treated with anti-fungal drugs (Figure S5A), and that these cells displayed long thin protrusions instead of BLPs (Figure S5B), as observed in the proximal colon. The combination of fluconazole or amphotericin B with antibiotics showed no additive effect (Figure 4C), suggesting that these two anti-fungal agents do not act on BLPs indirectly, i.e., by leading to the expansion of colonic bacteria. These results suggest that distal colon-resident fungi might promote the formation of BLPs in subepithelial Mɸs.
Figure 4.

Intestinal Fungi Stimulate BLP Formation and Account for Epithelial Death in the Absence of Mфs
(A) Number of BLPs, normalized per crypt in the distal colon of mice treated with antibiotic cocktail (AB) or anti-fungal agent (fluconazole, fluc). Dots represent average number per individual mouse; four independent experiments. Mean ± SEM, multiple comparison Kruskal-Wallis test, ∗p < 0.05.
(B) Number of BLPs, normalized per crypt in the distal colon of mice treated with anti-fungal agent (amphotericin B, AmphB). Dots represent average number per individual mouse; two independent experiments. Mean ± SEM, Mann-Whitney test, ∗p < 0.05
(C) Number of BLPs, normalized per crypt in the distal colon of mice treated with antibiotic cocktail, fluconazole, amphotericin B, or in combinations of antibacterial and anti-fungal agents. Dots represent average number per individual mouse; two independent experiments. Mean ± SEM, multiple comparison Holm-Sidak’s test, ∗p < 0.05, ∗∗∗p < 0.001.
(D) Number of BLPs, normalized per crypt, in germ-free mice colonized with bacteria (Schaedler flora, ASF) or fungi (C. albicans). Dots represent average number per individual mouse; two independent experiments. Multiple comparison Kruskal-Wallis test, ∗p < 0.05.
In (A and D), Mфs (F4/80, cyan) and crypts (laminin, purple); maximum z-projections of 30 μm. Scale bars: 10 μm.
(E) Number of apoptotic (cleaved caspase 3+) epithelial cells per crypt in the distal colon of germ-free mice colonized with bacteria (Schaedler flora, ASF) or fungi (C. albicans). Dots represent average number per individual mouse; two independent experiments.
(F) CD64WT or CD64DTR littermates were treated with anti-fungal agents (fluconazole or amphotericin B in separate sets of experiments) or antibiotic cocktail before Mф depletion; 44 h after the first DT injection distal colons were processed for IHC staining. All mice received DT injections.
(E and F) Apoptotic cells (cleaved caspase 3 staining, red); F-actin (green). Scale bars: 20 μm. Dots represent average number per individual mouse; data pooled from three (fluconazole and antibiotic cocktail treatment) and two (amphotericin B treatment) independent experiments. Mean ± SEM, multiple comparison Dunn’s test, ∗p < 0.05, ∗∗p < 0.01. See also Figure S5.
Figure S5.

Effect of Microbiota on Colonic Macrophages and Epithelium, Related to Figure 4
(A) Number of Mф in mice treated with anti-fungal agents (fluconazole and amphotericin B), and in germ-free mice, reconstituted with fungi (C. albicans) or bacteria (ASF), analyzed by flow cytometry and imaging.
(B) Number of extensions normalized per number of Mф in mice treated with antibiotic cocktail or fluconazole. Dots represent average number per individual mouse, data pooled from 2 independent experiments. Results are presented as mean ± SEM, Mann-Whitney test, Kruskal-Wallis test was used in germ-free reconstitution experiments and in (B).
(C) Dectin-1 and Dectin-2 staining of Mф isolated from the distal and proximal colon. Gated on Mф, gray histogram – negative control (FMO), orange – proximal colon Mф, blue – distal colon Мф. A representative example from 2 independent experiments, performed with 6 mice in total.
(D) Number of BLPs analyzed by IHC staining and normalized per crypt of Dectin-1WT and Dectin-1KO mice. Dots represent average number per individual mouse, results are presented as mean ± SEM, Mann-Whitney test. (D) Number of BLPs normalized per crypt in mice pre-treated with anti-fungal agent (fluconazole, fluc) and infused with hypotonic solution. Pooled data from 5 independent experiments.
(E) Number of Hydrazide+ epithelial cells normalized per crypt upon hypotonic solution infusion with hydrazide used as the water tracer. Pooled data from 5 independent experiments. Dots represent average number per individual mouse, results are presented as mean ± SEM, Dunn`s multiple comparison test, ∗p < 0.05.
To directly asses the role of fungi in the induction of BLPs, we colonized germ-free mice with altered Schaedler flora (ASF), a well-defined community of eight bacterial species (Li et al., 2018), or with the gut fungal pathobiont Candida albicans. Notably, fungal colonization induced strong BLP formation by Mɸs in the distal colon of germ-free mice that were otherwise devoid of these structures, whereas bacterial colonization did not influence the formation of BLPs (Figure 4D). No change in the number of subepithelial Mɸs was observed (Figure S5A). While colonization of germ-free mice with pathobiont, Candida albicans, led to epithelial cell death, bacteria had no effect (Figure 4E). Altogether, these results support a role for the mycobiota in the formation of BLPs in the distal colon, where these microorganisms are particularly abundant.
Intestinal Fungi Are Responsible for Epithelial Cell Death in the Distal Colon of Mɸ-Depleted Mice
So far, our results suggest that in the distal colon, there is a population of CD11chigh Mɸs that form BLPs in response to local fungi. On the other hand, we found that Mɸ depletion was associated with massive epithelial cell apoptosis in the distal colon but not the proximal one (Figure 1). We, therefore, hypothesized that by forming BLPs, Mɸ might protect epithelial cells from fungi-induced death. Indeed, fungi have been shown to produce many toxic molecules, including toxins and metabolites that can be deleterious for the host (Bukelskien, 2006; Egbuta et al., 2017; Upperman et al., 2003; Weber et al., 2008). To test this hypothesis, we pre-treated CD64DTR mice with anti-fungal agents before Mɸ depletion and assessed the impact of such treatment on epithelial cell survival. Strikingly, we found that anti-fungal treatment rescued the epithelial cells from death in Mɸ-depleted animals (Figure 4F). The number of apoptotic colonocytes in mice treated with either fluconazole or amphotericin B prior to Mɸ depletion was comparable to those observed in Mɸ-containing mice. In contrast, epithelial cell death was not rescued when Mɸ-depleted mice were treated with antibiotics (Figure 4F). We conclude that fungi are most likely responsible for the death of epithelial cells observed in the distal colon of Mɸ-depleted mice. These results further suggest that Mɸs might protect epithelial cells from fungi-induced cell death.
BLP+ Mɸs Sample the Fluids Absorbed through Epithelial Cells
How do Mɸ detect fungi in the distal colon? Colonic Mɸs use C-type lectin receptors such as Dectin-1,Dectin-2, and Mincle to recognize fungi cell-wall constituents and orchestrate anti-fungal immunity (Iliev et al., 2012; Leonardi et al., 2018; Li et al., 2018). However, we did not observe any difference in the level of expression of Dectin-1 and Dectin-2 in Mɸs sorted from the distal and proximal colons (Figure S5C). In addition, Dectin-1KO Mɸs formed similar numbers of BLPs in the distal colon as compared to wild-type animals (Figure S5D). These data suggest that BLP+ Mɸs might not respond to intestinal fungi through the recognition of β-glucan by Dectins. This is consistent with BLPs not reaching the colon lumen and the microorganisms it contains.
BLP characterization showed that they were filled with membranes from epithelial cells and enriched in endolysosomal compartments (Figure 2). We, therefore, hypothesized that BLPs might sample fungal metabolites/toxins indirectly through the fluids absorbed by the epithelial cells they are in contact with. Indeed, epithelial cells in the distal colon possess specific mechanisms that optimize the absorption of water and facilitate stool dehydration (Masyuk et al., 2002). Such mechanisms might allow BLP+ Mɸs to sample the environment in the absence of direct contact with the local microbiota. To assess whether BLP+ Mɸs respond to fluid absorption by epithelial cells, we infused CD11c-Cre/R26mTmG mice intra-rectally with a hypotonic solution. We found that such treatment increased the number of BLPs as fast as 10 min after infusion (Figure 5A) and returned to steady state in 30 min. This increase was also observed when fluid absorption was stimulated by aldosterone injection, a corticosteroid hormone which increases sodium and thus water absorption specifically in the distal colon (Figure 5B). To the opposite, when inhibiting water absorption by treating animals with the laxative Bisacodyl, we observed a significant decrease in the number of BLPs (Figure 5C). Noticeably, this decrease was abrogated when mice were pre-treated with indomethacin, which inhibits the action of Bisacodyl (Ikarashi et al., 2011). Tracing the fluid absorbed through epithelial cells using Alexa-633-labeled hydrazide (a 0.5–1.5 kDa low molecular weight compound) showed an important accumulation of the dye inside the BLP+ Mɸ network as fast as 5 min upon infusion (Figures 5D and 5F). These results show that the fluid absorbed through the epithelium of the distal colon stimulates the formation of BLPs in associated Mɸs wherein this fluid accumulates. Importantly, we found that the formation of BLPs upon fluid absorption was increased when fungi were present (Figure 5E) while the efficiency of epithelial fluid absorption was unchanged (Figure S5E), supporting our hypothesis that BLPs sample fluids for the presence of fungal products.
Figure 5.

BLP Sample Fluids Absorbed through the Epithelium.
(A–C) Number of BLPs normalized per crypt upon stimulation/inhibition of intestinal fluid absorption. (A) Mice (CD11c: Cre/R26mTmG) received an intra-rectal infusion of hypotonic solution and were sacrificed 5, 10, 20, or 30 min later. (B) Mice were injected with aldosterone and sacrificed 2, 4, 6, or 8 h later. (C) Mice (C57BL/6J) were force-fed with a laxative (bisacodyl) and sacrificed 5 h later. Indomethacin injection (IMC) 15 min before the gavage was used as an inhibitor of bisacodyl. Dots represent average number per individual mouse; data pooled from three (A and B) or two (C) independent experiments. Mean ± SEM, multiple comparison Kruskal-Wallis test, ∗p < 0.05, ∗∗p < 0.01.
(D) Maximal z-projection of distal colonic Mфs 5 min after intra-rectal infusion of hydrazide (a polar low molecular weight membrane-impermeant dye used as a water tracer) in hypotonic solution. mGFP (green), hydrazide (red); z-projection of 20 μm. Scale bar: 10 μm.
(E) Number of BLPs normalized per crypt in C57BL/6J mice pre-treated with anti-fungal agent (fluconazole, fluc) and infused with hypotonic solution. Dots represent average number per individual mouse; five independent experiments. Mean ± SEM, multiple comparison Kruskal-Wallis test, ∗p < 0.05.
(F) Maximal z-projection of distal colonic Mфs forming BLPs, filled with hydrazide after intra-rectal infusion. CD11c: Cre/R26mTmG mouse, left: z-projection of 8 μm, scale bar: 2 μm; and individual optical planes at different depths of the same BLP, scale bar: 1 μm.
Mɸs Protect Epithelial Cells from Being Poisoned by Fungal Toxins
To directly test this hypothesis, we searched for a molecule to be used as a generic fungal metabolite, toxic for epithelial cells when concentrated. We turned our attention to gliotoxin. Indeed, this fungi metabolite was shown to induce apoptosis in epithelial cells (Upperman et al., 2003) and to be produced by both pathobionts and food spoilage fungi such as Penicillium chrysogenum (Ismaiel and Papenbrock, 2015; Lewis et al., 2005), which is abundant in the murine intestinal tract (Wheeler et al., 2016). Of note, gliotoxin was also found to be produced by Candida spp., including Candida albicans, even though there are conflicting reports on this subject (Bertling et al., 2010; Kosalec et al., 2008; Kupfahl et al., 2007; Shah and Larsen, 1991; Shah et al., 1995; Tshabalala et al., 2016). To investigate whether Mɸs can sense fungal metabolites present in the fluids absorbed by epithelial cells, we infused fungi-depleted C57BL/6J mice with a hypotonic solution containing or not containing gliotoxin (Figure 6A). We found that gliotoxin-containing solution stimulated BLP-formation as soon as 5 min after the infusion (Figure 6B). While the epithelium kept absorbing the gliotoxin-free hypotonic solution, it stopped the absorption of the one containing gliotoxin 20 min upon infusion (Figure 6C). Similar results were obtained when using two additional fungi toxins: Candidalysin from pathobiont Candida albicans and T-2 toxin from commensal Fusarium sporotrichoioides (Marasas et al., 1987; Wheeler et al., 2016) (Figure 6D). These data show that epithelial cells sense and stop absorbing fluids that are poisoned with fungal toxins.
Figure 6.

Mфs Protect Epithelial Cells from Death by Limiting Fungal Toxin Absorption
(A) C57BL/6J littermates were treated with anti-fungal agent (fluconazole), received intra-rectal infusion of hypotonic solution (1:1 H2O/PBS) with or without gliotoxin, and were sacrificed 5 or 20 min later. Hydrazide was used as the water tracer.
(B) Number of BLPs normalized per crypt in C57BL/6J mice pre-treated with anti-fungal agent and infused with hypotonic solution with or without gliotoxin. Control (non-infused) group is indicated as “NI.”
(C) Number of hydrazide+ epithelial cells normalized per crypt in C57BL/6J mice pre-treated with anti-fungal agent and infused with hypotonic solution with or without gliotoxin.
(D) Number of BLPs normalized per crypt in C57BL/6J mice pre-treated with anti-fungal agent (fluconazole, fluc) and infused with hypotonic solution containing DMSO (H2O-infused control group), Candidalysin or T-2 toxin. Non-infused control groups are indicated as “NI.”
(E) CD64WT or CD64DTR littermates were treated with anti-fungal agent (fluconazole) before Mф depletion; 20 h after the first DT injection mice received intra-rectal infusion of gliotoxin (in hypotonic solution + hydrazide) and were killed 5 min, 20 min, or 6 h later. All mice were injected with DT. Mф depletion was confirmed by F4/80 staining, basement membrane (laminin, purple); maximum z-projections of 30 μm. Scale bars: 20 μm.
(C) Maximum z-projection of distal colon sections of Mф-depleted animals 6 h after gliotoxin infusion. Apoptotic cells (cleaved caspase 3, red) staining, F-actin (green). All mice were injected with DT.
In (A–F), dots represent average number per individual mouse; data pooled from three (B and C) or two (D–F) independent experiments. Mean ± SEM. In (B–E), multiple comparison Kruskal-Wallis test. In (F), Mann-Whitney test, ∗p < 0.05, ∗∗p < 0.01.
To investigate whether this is an intrinsic capacity of epithelial cells or requires associated BLP+ Mɸs, we performed a similar experiment in CD64WT or CD64DTR littermates injected with diphtheria toxin (DT) and infused with the gliotoxin-containing hypotonic solution (Figure 6E). Remarkably, we found that while DT-injected CD64WT mice stopped the absorption of the gliotoxin-containing solution, Mɸ-depleted CD64DTR mice kept absorbing (Figure 6E). To assess whether this uncontrolled absorption of gliotoxin had long-term effects on epithelium homeostasis, we infused CD64WT and CD64DTR littermates with the gliotoxin-containing hypotonic solution and sacrificed them 6 h later. In these experiments, distal colon epithelial cells underwent massive apoptosis when Mɸs were depleted, confirming that these phagocytes protect epithelial cells from being poisoned by the fungal toxin (Figure 6F). We conclude that in the distal colon, Mɸs endow epithelial cells with the ability to recognize toxic fluids and stop absorption, maintaining epithelial integrity and local homeostasis.
BLPs Are Needed for Mɸs to Prevent Epithelium Poisoning by Fungi Toxins
These results highlight the essential role of Mɸs in stopping the absorption of toxin-containing fluids through epithelial cells. Are BLPs required for this process? As shown in Figure 2, BLPs are enriched for CD74+ endolysosomal compartments, and CD74 expression was slightly increased in cluster 1 (log fold change 0.4). CD74, also known as invariant chain, controls MHC class II trafficking to endocytic compartments, and its expression typically leads to the expansion of endolysosomal compartments (reviewed in Schröder, 2016). It was also shown to enhance the internalization of extracellular fluid by macropinocytosis (Chabaud et al., 2015). We thus hypothesized that CD74 might help BLP+ Mɸs internalizing within endolysosomes the fluid and small vesicles released by epithelial cells.
To test this hypothesis, we infused fluconazole-treated CD74WT and CD74KO mice with a hypotonic solution containing gliotoxin (Figure 7A). We found that the number of BLPs was equivalent in the two groups of mice at steady state (Figure 7B). While the number of BLPs increased in wild-type mice 5 min after gliotoxin infusion, it did not in CD74KO animals, suggesting a decrease in uptake of extracellular fluids. Accordingly, CD74KO subepithelial Mɸs exhibited reduced level of hydrazide internalization (Figure 7C). This result suggests that CD74 is required for BLP formation in response to fluid absorption through epithelial cells, indicating that CD74KO mice constitute a valuable model to evaluate the implication of BLPs in fluid sampling by Mɸs. Quantification of fluid absorption showed no difference between CD74WT and CD74KO 5 min after infusion of gliotoxin (Figure 7D, graph). This is consistent with a wild-type epithelium absorbing equivalent amounts of toxin-rich fluid at this early time point (Figure 6C). Strikingly, while in wild-type mouse, absorption of gliotoxin-containing solution stopped 20 min after infusion, this decrease in absorption was not observed in the epithelium of CD74KO mice (Figure 7D). In agreement with these results, we found that CD74KO epithelial cells later undergo massive apoptosis (Figure 7E). These findings strongly suggest that BLPs orchestrate fluid sampling by distal colon Mɸs, which is critical to protect epithelial cells from absorbing fluids enriched in fungi toxins/metabolites.
Figure 7.

CD74-dependent BLP Formation Protects Epithelial Cells from Death by Limiting Fungal Toxin Absorption
(A) CD74WT or CD74KO littermates were treated with an anti-fungal agent (fluconazole) and infused intra-rectally with a hypotonic solution containing gliotoxin. Hydrazide was used as the water tracer. Mice were killed 5 min, 20 min, or 4 h after the infusion, and distal colon samples were processed for IHC staining.
(B) Number of BLPs formed 5 min after gliotoxin infusion. Mфs (F4/80 staining, cyan), basement membrane (laminin, purple). Scale bar: 20 μm.
(C) Efficiency of BLP-mediated hydrazide uptake upon gliotoxin infusion. Hydrazide (red), Mфs (F4/80 staining, green), basement membrane (laminin, white), and DNA (DAPI, blue). Scale bars: 5 μm.
(D) Epithelial absorption of fluid upon gliotoxin infusion. Hydrazide (white), basement membrane (laminin, purple), maximal z-projections of 30 μm. Scale bars: 20 μm.
(E) Distal colon sections 4 h after gliotoxin infusion. Apoptotic cells (cleaved caspase 3 staining, red), F-actin (green); z-projections of 30 μm. Scale bars: 50 μm. Three independent experiments; dots represent average number per individual mouse.
In (B and D), dots represent average number per individual mouse; data pooled from five independent experiments. Mean ± SEM, multiple comparison Dunn’s test, ∗p < 0.05, ∗∗p < 0.01, ∗∗∗p < 0.001. In (C and E), mean ± SEM, Mann-Whitney test, ∗∗p < 0.01, ∗∗∗∗p < 0.0001.
Discussion
The intestinal barrier separates the gut lumen from the internal milieu. It acts as a selectively permeable filter that allows the absorption of nutrients, electrolytes, and water, which can then reach the blood circulation for organ irrigation. At the same time, because the intestine lumen also contains many toxic substances produced by the microbiota, absorption must be tightly regulated to prevent intoxication and disease. Indeed, dysregulation of intestinal barrier permeability is a leading cause of sepsis-related mortality in critically ill patients and IBD. While mechanisms that regulate intestinal permeability have been widely studied in the small intestine, little is known on how the colon, whose main physiological function is fluid absorption and which contains the highest microorganism burden, protects itself from toxic microbial products.
Here, we describe a mechanism driven by a particular population of CD11chigh subepithelial Mɸs, which ensures rapid quality check of absorbed fluids to maintain barrier integrity. For this, Mфs use BLPs inserted at the base of the epithelium, which sample the fluids absorbed through epithelial cells. If fluids are overloaded with fungal metabolites/toxins, Mɸs instruct epithelial cells to stop absorption, preventing epithelial cell poisoning and death. This could for example occur through the secretion of prostaglandin 2 (PGE2) by Mɸs, which decreases Aquaporin localization at the apical membrane of epithelial cells in vitro (Ikarashi et al., 2011). In the absence of Mɸs or BLPs, epithelial cells absorb fluids independently of their fungal toxin/metabolite load and undergo apoptosis, compromising barrier integrity. These results suggest that, in homeostasis, the permeability of the intestinal barrier is differentially regulated depending on the local physiological function of the specific intestine segment and on its microbial content. Mɸs thus emerge as key players in the orchestration of such regulation.
In the small intestine, Mɸs form transient transepithelial dendrites visible by live imaging (Rescigno et al., 2001; Vallon-Eberhard et al., 2006). In response to microbial signals, these protrusions extend between epithelial cells and reach the gut lumen where they capture bacteria or dietary antigens. They express tight-junctional proteins to form adhesions with epithelial cells during crossing the barrier, which ensures the maintenance of the epithelium integrity (Rescigno et al., 2001). They, therefore, appear as different from the colonic BLPs described here. Although BLPs also penetrate the basement membrane and occupy the intercellular space of the epithelium and do not directly contact the colon lumen. These differences are in line with the distinct properties of epithelia in the small and large bowels. While paracellular permeability is elevated in the small intestine epithelium, reflecting its physiological role in nutrient absorption and establishment of food tolerance, the colonic epithelium exhibits limited paracellular permeability (Gitter et al., 2000). This helps the colonic epithelium to resist local mechanical stress imposed by elevated osmotic pressure and stool solidification, preventing loss in barrier integrity. Mɸs might, therefore, have developed an alternative sampling strategy in the context of such tightly sealed colonic epithelium. They form BLPs, which sample fluids absorbed through or between epithelial cells, rather than directly engulfing the content of the colon lumen, which contains a huge number of microorganisms. Although the paracellular route allows sampling of the fluid absorbed through the epithelium, a process needed for stool formation, the transcellular route might detect transient events of barrier leakage that result from stretch and shear mechanical insult. These findings suggest that sampling mechanisms by the peripheral immune system are adapted to both the local cues and physiological function(s) of the gut segment.
We unexpectedly found that distal colon BLP+ Mɸs respond to the presence of fungi products. Similar results were observed with two different anti-fungal agents, fluconazole and amphotericin B, which target distinct fungal species through different mechanisms (Anderson et al., 2014; Bolard et al., 1993; Morrow, 1991). These results are consistent with fungi being particularly enriched in the distal colon (Iliev et al., 2012). We did not obtain any evidence that bacterial compounds stimulate the formation of BLPs. However, we cannot exclude the possibility that bacteria insensitive to the used antibiotics or absent from the ASF flora could still stimulate formation of BLPs.
How do subepithelial BLP+ Mɸs detect fungal products? Our data strongly suggest that Dectins might not be involved in this process in homeostatic conditions given that (1) the number of BLPs does not vary between wild-type and Dectin 1KO mice and (2) the level of expression of these receptors are equivalent in Mɸs isolated from proximal (majority are BLP−) and distal colon (majority are BLP+). This is coherent with previous findings showing that the distal colon contains a thick mucus layer that physically separates the microbiota from the epithelial cells; inner parts of this mucus are sterile (Kamphuis et al., 2017). Therefore, in homeostasis, there is no contact between subepithelial Mɸs and the colon lumen, impairing Dectin engagement by their ligands, which are part of the fungal cell wall. Mɸs use BLPs to sample the fluids absorbed through epithelial cells, which carry the whole spectrum of fungal metabolites, providing a comprehensive picture of local mycobiota composition. Whether BLP+ Mɸs directly sense fungal products absorbed by the epithelium or detect stress compounds released by poisoned epithelial cells requires additional investigations. This is in sharp contrast with what happens in response to barrier rupture or in the presence of invading fungal species: in that case, Mɸs physically contact fungi and use Dectin-1 to mount effective anti-fungi immune responses (Iliev et al., 2012; Leonardi et al., 2018).
Similar results were obtained using three different fungi toxins: gliotoxin, which is produced by both pathobionts and commensals, Candidalysin, from pathobiont Candida albicans, and T-2 toxin, from commensal Fusarium sporotrichoioides (Marasas et al., 1987). In all cases, the number of BLPs increased upon toxin inoculation in fungi-depleted mice, indicating that BLP+ Mфs recognize all three fungi metabolites. This result suggests that BLPs do not only respond to fungi compounds produced by pathogenic species but to a broad variety of fungi metabolites. The BLP response may thus be critical not only to sense potentially dangerous fungi species but also to detect the over-growth of commensal fungi, whose metabolites might compromise the survival of epithelial cells if too abundant. Accordingly, we found that commensal fungi are indeed responsible for epithelial cell apoptosis in Mф-depleted mice. Defining the precise nature of the commensal fungi involved will require additional investigations. An interesting candidate is the commensal species Fusarium sporotrichoioides, as it is targeted by both fluconazole and amphotericin B (Wheeler et al., 2016) and produce the T-2 toxin (Marasas et al., 1987). How BLP+ Mфs themselves resist toxins remains an open question; it could be envisioned that BLPs maintain toxins away from the cell body of these cells.
In conclusion, here we highlight a so-far uncovered homeostatic function of CD11chigh subepithelial Mфs in the distal colon: they help the epithelium maintain its integrity in an environment subjected to elevated physical and chemical insults that result from osmotic pressure, feces solidification, and an important microbial load. How BLP+ Mфs instruct epithelial cells to absorb or not absorb fluids in homeostasis and whether alterations in such mechanisms lead to pathologies such as IBD and cancer shall next be addressed.
STAR★Methods
Key Resources Table
| REAGENT or RESOURCE | SOURCE | IDENTIFIER |
|---|---|---|
| Antibodies | ||
| Rat IgG2b kappa monoclonal anti-CD45, PE/Cyanine5.5 conjugated, clone 30-F11, dilution for flow cytometry – 1 to 500 | ThermoFischer Scientific, eBiosciences™ | Cat# 35-0451-82; RRID: AB_469718 |
| Armenian Hamster IgG monoclonal anti-CD3 epsilon, APC/Cyanine7 conjugated, clone 145-2C11, dilution for flow cytometry – 1 to 200 | BioLegend | Cat# 100330; RRID: AB_1877170 |
| Rat IgG2a kappa monoclonal anti-CD19, APC/Cyanine7 conjugated, clone 6D5, dilution for flow cytometry – 1 to 200 | BioLegend | Cat# 115530; RRID: AB_830707 |
| Rat IgG2b kappa monoclonal anti-CD11b, PE/Cyanine7 conjugated, clone M1/70, dilution for flow cytometry – 1 to 200 | ThermoFischer Scientific, eBiosciences™ | Cat# 25-0112-82; RRID: AB_469588 |
| Armenian Hamster IgG monoclonal anti-CD103, PE conjugated, clone 2E7, dilution for flow cytometry – 1 to 200 | ThermoFischer Scientific, eBiosciences™ | Cat# 12-1031-82; RRID: AB_465799 |
| Rat IgG2a kappa monoclonal anti-F4/80, PE/Cyanine5 conjugated, clone BM8, dilution for flow cytometry – 1 to 20 | BioLegend | Cat# 123112; RRID: AB_893482 |
| Mouse IgG1 kappa monoclonal anti-CD64, Brilliant Violet™ 421 conjugated, clone X54-5/7.1, dilution for flow cytometry – 1 to 13 | BioLegend | Cat# 139309; RRID: AB_2562694 |
| Rat IgG2c kappa monoclonal anti - Ly6C, PE/Dazzle™ 594 conjugated, clone HK1.4, dilution for flow cytometry – 1 to 333 | BioLegend | Cat# 128044; RRID: AB_2566577 |
| Rat IgG2b kappa monoclonal anti- mouse I-A/I-E, Alexa Fluor™ 700 conjugated, clone M5/114.15.2, dilution for flow cytometry – 1 to 400 | BioLegend | Cat# 107622; RRID: AB_493727 |
| Armenian Hamster IgG1 λ2 monoclonal anti-CD11c, APC conjugated, clone HL3, dilution for flow cytometry – 1 to 100 | BD Biosciences | Cat# 550261; RRID: AB_398460 |
| Rat IgG2b monoclonal anti-Dectin-1, FITC conjugated, clone 2A11, dilution for flow cytometry – 1 to 5 | Bio-Rad | Cat# MCA2289FT; RRID: AB_2081659 |
| Rat IgG2a monoclonal anti-Dectin-2, FITC conjugated, clone KVa7-6E7, dilution for flow cytometry – 1 to 5 | Miltenyi Biotec | Cat# 130-102-212; RRID: AB_2660824 |
| Rat DA/HA IgG2b kappa monoclonal anti – CD11b, Brilliant Violet™ 421 conjugated, clone M1/70, dilution for cryosections – 1 to 100; dilution for whole-mount – 1 to 20 | BD Biosciences, BD Horizon™ | Cat# 562605; RRID: AB_11152949 |
| Rat IgG2b monoclonal anti-CD11b, unconjugated, clone 5C6, dilution for cryosections – 1 to 100; dilution for whole-mount – 1 to 50 | Bio-Rad | Cat# MCA711G; RRID: AB_323167 |
| Goat IgG polyclonal anti-CD103, unconjugated, dilution for cryosections – 1 to 100; dilution for whole-mount – 1 to 50 | R&D systems | Cat# AF1990; RRID: AB_2128618 |
| Rat IgG2a monoclonal anti-CD64, unconjugated, clone AT152-9, dilution for cryosections – 1 to 100; dilution for whole-mount – 1 to 50 | Bio-Rad | Cat# MCA5997; RRID: AB_2687456 |
| Rat IgG2b monoclonal anti-F4/80, unconjugated, clone Cl:A3-1, dilution for cryosections – 1 to 100; dilution for whole-mount – 1 to 50 | Bio-Rad | Cat# MCA497R; RRID: AB_323279 |
| Rat IgG2b monoclonal anti-mouse I-A/I-E, unconjugated, clone M5/114.15.2, dilution for cryosections – 1 to 100; dilution for whole-mount – 1 to 50 | BioLegend | Cat# 107602; RRID: AB_313317 |
| Rat IgG2b kappa monoclonal anti- mouse I-A/I-E, Brilliant Violet™ 510 conjugated, clone M5/114.15.2, dilution for cryosections – 1 to 20 |
BioLegend | Cat# 107636; RRID: AB_2734168 |
| Rat (WF) IgG2b kappa monoclonal anti-CD74, unconjugated, clone In-1, dilution for cryosections – 1 to 100, dilution for whole-mount – 1 to 50 | BD Biosciences, BD PharMingen™ | Cat# 555317; RRID: AB_395727 |
| Rabbit IgG monoclonal anti-Cleaved Caspase 3 (Asp175), unconjugated, clone 5A1E, dilution for cryosections – 1 to 100 | Cell Signaling Technology | Cat# 9664S; RRID: AB_2070042 |
| Rabbit IgG polyclonal anti-Laminin, unconjugated, dilution for cryosections – 1 to 200, dilution for whole-mount – 1 to 100 | Sigma-Aldrich | Cat# L9393; RRID: AB_477163 |
| Rat (SD) IgG2a kappa polyclonal anti-CD107a (LAMP1), unconjugated, clone 1D4B, dilution for cryosections – 1 to 100 | BD Biosciences, BD PharMingen™ | Cat# 553792; RRID: AB_2134499 |
| Rat IgG1 kappa monoclonal anti-CD107b (LAMP2), unconjugated, clone M3/84, dilution for cryosections – 1 to 100 | BioLegend | Cat# 108502; RRID: AB_313383 |
| Rabbit IgG monoclonal anti-EEA1, clone C45B10, unconjugated, dilution for cryosections – 1 to 100 | Cell Signaling Technology | Cat# 3288S; RRID: AB_2096811 |
| Rabbit IgG monoclonal anti-Rab7, clone D95F2, unconjugated, dilution for cryosections – 1 to 100 | Cell Signaling Technology | Cat# 9367S; RRID: AB_1904103 |
| Rabbit IgG monoclonal anti-Rab11, clone D4F5, unconjugated, dilution for cryosections – 1 to 100 | Cell Signaling Technology | Cat# 5589S; RRID: AB_10693925 |
| Rat IgG2b kappa monoclonal anti- mouse CD16/CD32, Mouse BD Fc Block™, dilution for flow cytometry – 1 to 200 | BD Biosciences | Cat# 553142; RRID: AB_394657 |
| Chemicals, Peptides, and Recombinant Proteins | ||
| LIVE/DEAD™ Fixable Aqua Dead Cell Stain Kit, dilution for flow cytometry – 1 to 1000 in protein-free buffer | ThermoFischer Scientific | Cat# L34965 |
| Phalloidin, Rhodamine conjugated, dilution for cryosections – 1 to 200, dilution for whole-mount – 1 to 100 | ThermoFischer Scientific | Cat# R415 |
| Phalloidin, Alexa Fluor™ 488 conjugated, dilution for cryosections – 1 to 200, dilution for whole-mount – 1 to 100 | ThermoFischer Scientific | Cat# A12379 |
| DAPI (4’,6-Diamidino-2-Phenylindole, Dihydrochloride), dilution for cryosections – 1 to 400, dilution for whole-mount – 1 to 200 | ThermoFischer Scientific | Cat# D1306 |
| Hydrazide coupled with Alexa Fluor™ 633 | ThermoFischer Scientific | Cat# A30634 |
| Gliotoxin from Gliocladium fimbriatum | Sigma-Aldrich | Cat# G9893-5MG |
| T-2 toxin from Fusarium sp. | Sigma-Aldrich | Cat# T4887-25MG |
| Candidalysin from Candida albicans | Peptides International | Cat# PCT-4494-v |
| Deposited Data | ||
| Spectral um-mixing macro code | This paper | Mendeley Data https://doi.org/10.17632/bdfyprfsv9.1 |
| Single Cell RNaseq datasets | This paper | Gene Expression Omnibus (GEO), GSE146131 |
| Original/source data for figures | This paper | Mendeley Data https://doi.org/10.17632/zwhhrht7bd.1. |
| Experimental Models: Organisms/Strains | ||
| Mouse: R6/2: B6CBA-Tg(HDexon1)62Gpb/3J | The Jackson Laboratory | JAX: 006494 |
| Mouse: DectinKO: B6.129S6-Clec7atm1Gdb/J | The Jackson Laboratory | JAX: 012337 |
| Mouse: CD11c:Cre | S. Amigorena (Institut Curie) | Caton et al. (2007) |
| Mouse: mT/mG | Lequn Luo (Stanford) | Muzumdar et al. (2007) |
| Mouse: Villin: Cre: B6.C57BL/6N-Tg(Villin-CreERT2)1SR | Institut Curie | el Marjou et al. (2004) |
| Mouse: CD64DTR ± | Sandrine Henri and Bernard Malissen (Marseille Université) | Baranska et al. (2018) |
| Mouse: CD74KO/KO | H. Ploegh (Harvard) | Viville et al. (1993) |
| Mouse: C57BL/6J | Charles River | JAX: 000664 |
| Software and Algorithms | ||
| ImageJ | Schneider et al., 2012 | https://imagej.nih.gov/ij/ |
| Spectral um-mixing macro code | This paper | Mendeley Data https://doi.org/10.17632/bdfyprfsv9.1 |
| Single Cell RNaseq datasets | This paper | Gene Expression Omnibus (GEO), GSE146131 |
| Scientific Volume Imaging, Huygens Software | https://svi.nl/Huygens-Software | https://svi.nl/Huygens-Essential |
Resource Availability
Lead Contact
Further information and requests for resources and reagents should be directed to and will be fulfilled by Lead Contact Ana-Maria Lennon-Duménil (ana-maria.lennon@curie.fr).
Materials Availability
This work did not generate new unique reagents.
Data and Code Availability
The scRNaseq datasets generated in this study are available for download at the Gene Expression Omnibus (GEO): GSE146131.
Spectral un-mixing Fiji macro code is available on Mendeley Data: https://doi.org/10.17632/bdfyprfsv9.1
Original/source data for figures in the paper is available on Mendeley Data: https://doi.org/10.17632/zwhhrht7bd.1.
Experimental Model and Subject Details
Mice
Animal care and use for this study were performed in accordance with the European and French National Regulation for the Protection of Vertebrate Animals used for Experimental and other Scientific Purposes (2010/63/UE) for the care and use of laboratory animals. Experimental procedures were specifically approved by the ethics committee of the Institut Curie CEEA-IC #118 (AuthorizationAPAFiS#26130-2020062023431460-v1 given by National Authority) in compliance with the international guidelines. All mice were maintained in the SPF animal facility of Institut Curie (Paris, France) prior to use. Germ free (GF) mice were bred and maintained within sterile vinyl isolators at Weill Cornell Medical College Mouse Facility. Altered Schaedler flora (ASF) mice were generated from germ-free wild-type C57BL/6 mice upon inoculation with ASF community (Li et al., 2018), bred for at least 5 generations for fully immunocompetent progeny and maintained within sterile vinyl isolators. All animal experiments were approved and are in accordance with the Institutional Animal Care and Use Committee guidelines at Weill Cornell Medicine. Experiments were performed on 8 to 16 weeks-old male or female mice. CD11c: Cre/R26mTmG mice were generated by crossing CD11c:Cre+/− mice (Caton et al., 2007) with the tdTomato/GFP reporter mice, where membrane-targeted green fluorescent protein (GFP) is expressed upon Cre activation (Muzumdar et al., 2007) and labels CD11c compartment. Villin: Cre/R26mTmG mice were generated by crossing Villin:Cre-ERT2 ± mice, bearing tamoxifen-dependent Cre recombinase in intestinal epithelial cells (el Marjou et al., 2004) with the tdTomato/GFP reporter mice (Muzumdar et al., 2007). Tamoxifen (0215673891, MP Biomedicals) was prepared as described previously (Metzger and Chambon, 2001) in sunflower seed oil (S5007, Sigma-Aldrich). In order to induce sufficient labeling of intestinal epithelial cells’ membrane, mice were i.p. injected with tamoxifen stock solution (50 mg/kg) for 5 consecutive days. C57BL/6J mice (females) were purchased from Charles River. CD64DTR ± mice (Baranska et al., 2018) were a kind gift from Sandrine Henri and Bernard Malissen and used for macrophage depletion experiments. Animals were i.p. injected with unnicked diphtheria toxin from Corynebacterium diphtheriae (50 μg/kg, solution was prepared in PBS, right before use from 1mg/mL stock solution kept at −80C, 322326, Sigma-Aldrich). Number of injections was dependent on the duration of experiment and on experimental design. For the intestinal barrier integrity experiments, mice received two i.p. injections, 24 h apart and sacrificed 20 h after the second injection. For infusion experiments, mice received one i.p. injection 20 h prior to infusion. CD64DTR −/− littermates injected with DT were used as a control. CD74KO/KO mice (Viville et al., 1993) were a kind gift from Dr. Hidde Ploegh, CD74WT/WT littermates were used as control. All treatments were done at the same time of the day, to eliminate any variability resulting from the circadian rhythm and its effects on the intestinal physiology.
Method Details
Tissue preparation
To ensure the same segmentation of the colons across the experiments, colons, including intra-basin part and anus, were removed from the animals, washed with PBS (10010001, ThermoFisher Scientific) at room temperature (RT) and separated onto proximal and distal parts ex vivo. First, anus and rectum were cut out (approximately 4 mm from the anus), second proximal colon was defined as the first 1/4 of the residual tube, starting from the caecum; distal colon was defined as last 4/4, and segments were separated with the scalpel. Segments were further perpendicularly cut into 3-4 mm pieces and fixed in 4% Paraformaldehyde (PFA) /PBS solution (5 mL per segment) for 1 h at RT with mild agitation. PFA 4% solution was prepared on the same day (30525-89-4, Electron Microscopy Sciences) with 10xDPBS (1x final concentration, 14080055, ThermoFisher Scientific) and distilled water (15230001, ThermoFisher Scientific). After fixation, tissue was washed 3 times with PBS (10010056, ThermoFisher Scientific) and processed for the staining.
Immunostaining of colonic tissue sections
Tissue was dehydrated in 15% sucrose (m/v, S8501, Sigma-Aldrich)/PBS solution for 1 h and after in 30% sucrose/PBS solution for 2 h at RT or overnight (O/N) at 4C (until tissue fragments sunk). After, tissue was embedded with Optimal Cutting Temperature compound (OCT, 4583, Sakura finetek France SAS) in plastic base molds (62352-15, Euromedex), frozen at −20°C and cut on the cryostat using SuperFrost Plus Adhesion slides (631-9483, VWR, Menzel Gläser). Tissue sections were left for several minutes to melt and covered in PBS to prevent drying until the permeabilization step. Sections were after permeabilized with 0.2% Triton x100 (T8787, Sigma-Aldrich)/PBS solution for 1 h at RT; blocked with 3% Bovine Serum Albumin (BSA, m/v, IgG-Free, Protease-Free, 001-000-162, Jackson Immuno Research), serum of the host of the secondary antibody (donkey or goat serum, depending on the staining, 1:20 dilution, 017-000-121 and 005-000-121 respectively, Jackson Immuno Research) in 0.05% Triton x100/PBS solution for 1 h at RT; and stained with primary antibody O/N in humidified chambers at RT. Sections were then washed 3 times with 0.05% Tx100/PBS solution for 1 h; incubated with secondary antibodies, DAPI and phalloidin, depending on the staining, for 4 h at RT; washed 3 times in 0.05% Tx100/PBS solution for 1 h and mounted using AquaPolyMount (18606-5, Polysciences). In case the FACS-conjugated antibodies were used (CD11c-APC, CD64-BV421) for co-labeling with other antibodies, they were added after the secondary antibody wash-out and incubated O/N at RT. After samples were later washed 3 additional times with 0.05% Tx100/PBS solution for 1 h and mounted. After drying for 1 h in the dry incubator at 37C or O/N at the RT, samples were ready for the imaging. All antibodies (references and dilutions) are presented in Table S3.
Whole-mount staining of colonic tissue
Fixed tissue was sliced perpendicularly to the intestinal length with the scalpel into 1 mm tissue sections and placed in the Eppendorf tubes filled with PBS (1 tube per staining, 4-6 sections per tube). The staining was performed as described above with slight modifications: permeabilization was performed with 1% Triton X-100 in PBS for 1 h at RT (500 uL per Eppendorf tube), all antibody solutions and washing steps were performed using 0.2% Triton X-100 in PBS, under mild shaking conditions (2 mL per Eppendorf tube) and concentration of antibodies was increased (see the Table S3, 150 uL of the final antibody solution per Eppendorf tube). Incubations with antibodies were done without agitation.
Confocal Microscopy
Images were acquired using an inverted confocal microscope (Leica DMi8, SP8 scanning head unit), equipped with HC PL APO CS2 40x/1.30 OIL objective, with a regular pixel size of 284 nm (x, y dimensions), 0,5 −1 um (z dimension) and a resolution of 1024x1024 pixels. For high-resolution BLP structural imaging, deconvolution was used. For these acquisitions we have performed oversampling (pixel size of 36 nm (x, y dimensions) and 0.2 (z dimension)) on the zoomed fragment of the tissue. For all types of acquisition Hybrid Detectors were used. Deconvolution was performed with Huygens Essential Software pack.
Correlative light - transmission electron microscopy (TEM)
Distal colon tissue of CD11c: Cre/R26mTmG mice was fixed in 4% PFA prepared in 0,1M phosphate buffer from 16% aqueous stock (30525-89-4, Electron Microscopy Sciences) and incubated 1 h at RT with mild agitation. Tissue was then washed 3 times in the regular PBS without Ca2+ and Mg2+ and cryoprotected by O/N incubation with 2,3M sucrose at 4°. Freezing of the tissue and cryosectioning was done as described above and sections were mounted in PBS: glycerol (1:1) without additional staining. BLPs were located using the inverted confocal microscope (Leica DMi8, SP8 scanning head unit) and obtained their x, y, z coordinates. Coverslips were then removed and samples were processed for the immunegold staining. The immunolabeling of cryosections was done as described previously (Melo et al., 2014), with some modifications. In brief, after 30 min in blocking buffer (0,1% gelatin (104070, Merck), 10% Normal goat serum (ab7481, Abcam) and 1% BSA (A9647, Sigma-Aldrich) in PBS), sections were immunolabelled with rabbit anti-GFP antibodies (ab290, Abcam) followed by 1.4 nm Nanogold labeled Fab’ anti-rabbit secondary antibody (#2004-5, Nanoprobes). After washing in PBS, sections were fixed in 2% (vol/vol) glutaraldehyde for 5 min, washed in water and silver enhanced (HQ Silver enhancement kit, Nanoprobes, NY). Finally, tissue was processed for osmication, dehydration, Epon embedding and sectioned based on the coordinates obtained previously for the each BLPs. Images were acquired with a digital camera Quemesa (SIS) mounted on a Tecnai Spirit transmission electron microscope (FEI) operated at 80kV. Montage of the EM and fluorescent confocal images was done in AdobePhotoshop.
Isolation of Intestinal Cell Suspensions and flow cytometry
For preparation of single-intestinal-cell suspension colons were opened with scissors along the intestinal length, proximal and distal colons were separated, washed 3 times in different baths of PBS without Ca2+ and Mg2+. Next, tissues were incubated on a magnetic stirrer in complete medium (CM, 2% heat-inactivated Fetal Bovine Serum (FBS) in Ca2+_, Mg2+-free Phenol Red 10X HBSS; H4385 Sigma-Aldrich, St. Louis, MO, USA diluted to 1x in filtered H2O) in the presence of 1 mM DTT (D9779, Sigma-Aldrich, St. Louis, MO, USA) and EDTA (15575-038 from Invitrogen) at 37°C for 30 min and subsequently incubated with 1 mM EDTA in 5% FBS/ PBS at 37°C for 10min. This was followed by incubation with 15mM HEPES (15630-056 from GIBCO) in 1% FBS/PBS at RT for 7 min without agitation. The supernatants containing intestinal epithelial cells were discarded. Isolated tissues were collected and digested using 0.15 mg/mL Liberase™ TL (054010200001, Roche) and 0.1mg/mL DNase1 (10104159001, Roche) in HBSS at 37°C for 45 min with magnetic agitation. Tissues were then filtered through 100μm cell strainer, and washed in HBSS. Single-cell suspensions were later stained with live-dead stain and Fc-block in a protein-free buffer for 30 min on ice, washed with FACS-buffer (1% BSA, 5% FCS and 2 mM EDTA in PBS), stained with FACS-conjugated antibodies for 20 min on ice, washed and analyzed by flow cytometry. Counting Beads (ACBP-100-10, Spherotech) were used for quantification of cell numbers in the sample and OneComp eBeads Compensation Beads (01-1111-42, Thermofisher Scientific, were used as single-color controls for compensation. Dilutions of reagents can be found in Table S3. Data was acquired on BD LSRII cytometer and processed with FlowJo vX software. Cell-sorting was performed on BD FACSAria sorter.
Single Cell RNA-sequencing using dropseq
RNaseq libraries preparation
Cellular suspension (∼5000 cells, with expected recovery of ∼3000 cells) of sorted Mɸ from proximal and distal colon of 8 weeks old female C57BL/6J mouse were loaded on the 10X Chromium Controller instrument (10X Genomics) according to the manufacturer’s protocol, based on the 10X GEMCode proprietary technology, both samples were processed in one batch. The Chromium Single Cell 3¢ v2 Reagent kit (10X Genomics) was used to generate the cDNA and prepare the libraries, according to the manufacturer’s protocol. The libraries were then equimolarly pooled and sequenced on a Novaseq 6000 (Illumina) in Paired-end 26x91. A coverage of 400M reads per sample was targeted, in order to obtain 100 000 reads per cell. The raw data were then demultiplexed and processed with the Cell Ranger software (10X Genomics) v2.1.1.
Quality check, read alignment, and computation of the UMI counts
FASTQ files are obtained from BCF files using the cellranger mkfastq command from CellRanger v2.1.1. Sequencing quality is assessed using FastQC v11.8. cellranger count command (default parameters) is used to map the reads to the annotated mm10 genome (accession: GCA_000001635.6, gene build: 2016-01), compute UMI counts, and call cellular barcodes.
Processing of the gene-cell expression matrix
The gene-cell expression matrix for each sample is imported in R using Seurat v3.0.0 and normalized as follows: the UMI count of each gene i in cell j is augmented by 1, divided by the total UMI count for cell j, multiplied by 10000, and log-transformed. Cells with less than 200 or more than 4000 detected genes (UMI count 3 1) are filtered out. Only the genes detected in 3 2 cells in at least one sample are retained. Normalized matrices for the two samples are concatenated to obtain a joint normalized matrix M and gene expression is standardized (Z-score) to obtain a scaled matrix M’.
Generation of the clustering solution
Feature selection methods and clustering parameters are let vary in order to optimize the definition of the cell populations.
Feature selection is performed on M (defined above) using either mean.var.plot or vst method from Seurat. They both model the expression dispersion of each gene in order to detect the candidates that show the highest variability across cells. For mean.var.plot, the average expression is set in [0.1, 0.1] and the scaled dispersion is 3 d, with d = 0.5, 1, or 1.5. For vst, the number of top highly variable genes retained is either 500, 1000, or 2000.
A PCA dimensionality reduction is possibly performed on M’ (defined above) after feature selection. The first 50 principal components (PCs) are calculated using an SVD approximation. The number of PCs to be retained is automatically defined using the approach defined as follows. First, a p value ph is computed for each component PCh using the JackStraw method (Seurat, default parameters). To identify the contribution to the standard deviation that is likely due to noise, we compute the standard deviation σnoise explained on average by PC40,…,PC50. The optimal number of top PCs is set to the maximal h such that the two conditions σh 3 1.25σnoise and ph £ 10−5 simultaneously hold.
Clustering is done using the Waltman and van Eck algorithm, either on the selected features or on the top h PCs, by varying the number of neighbors k in {30, 40, 50} and the resolution parameter r from 0.1 to 0.5 in steps of 0.1. Overall, 180 clustering solutions are generated: 6 ways to select the features, followed or not by PCA, 3 choices for k and 5 choices for r in the clustering step.
Selection of the optimal clustering solution and identification of cell populations
Given a clustering solution C, a silhouette width silh(j) is computed for each cell j using the n × n matrix D, where n is the number of cells and Djk is the euclidean distance between cell j and cell k, computed on the same space where C is calculated (features or PCs). The average silhouette width across a cluster c will be referred to as silh(c).
For each solution, the putative BLP+ Mф cluster is defined as the largest whose fraction of cells in the distal colon is greater than in the proximal colon. Among the solutions C whose expected fraction of BLP+ Mф (based on IHC) is < 0.4 in the proximal colon and comprised between 0.5 and 0.7 in the distal colon, we select the one such that the average between silh(C) and silh(BLP+ Mф) is maximal. The optimal solution contains five clusters (top 1000 variable genes selected with vst, selection of the first 22 PCs, and clustering with parameters k = 30 and r = 0.1). A tSNE is computed (using default parameters) on the same input used for clustering.
Differential expression analysis and clusters annotation
Differential expression analysis between each cluster and its complementary or between two clusters is performed using the MAST method on the optimal solution defined at the previous step. Genes detected (UMI count > 0) in 3 10% cells in one of the two conditions, with |log2FC| > 0.5, and adjusted p value < 0.05 (Bonferroni correction) are defined as differentially expressed. Two clusters expressing higher level of fibroblast markers (Acta2, Dcn, Des, Lamb1, Lama4, Lamc1, Tpm2, Nid1) and of epithelial cell markers (Krt8, Muc2, Krt19, Car1, Krt18, Car4), respectively, and one cluster expressing lower level of the Mф marker Itgam (Cd11b) are filtered out, resulting in two remainder clusters for downstream analysis, which will be referred to as BLP+ Mф and BLP- Mф, respectively.
Comparison with published colon Mф datasets
Processed single-cell RNA-Seq data from monocyte-derived phagocytes in mouse colon are retrieved from (Kang et al.). First, we assess the expression of mature Mф signatures (Schridde et al.), namely, the expression of upregulated genes from P1 (monocytes) to P4 (mature Mф), in the seven Mф sub-populations identified by Kang et al. Second, we compare the two Mф sup-populations whose size is decreased in germ-free mice compared to specific pathogen-free mice, corresponding to clusters 4 and 6 in (Kang et al.), to BLP+ Mф and BLP- Mф. The genes tested for differential expression between cluster 4 and 6 that are detected in 3 10% cells in either cluster 4 or 6, with |log2FC| > 0.5, and adjusted p value < 0.05 (Bonferroni correction) are defined as differentially expressed. We intersect the upregulated DEGs in BLP+ Mф with the upregulated DEGs in cluster 4 and compute the probability of observing an equal or higher odds-ratio (maximum-likelihood estimate) with a Fisher’s exact test (using the R function fisher.test) using the genes detected in at least 20 cells across BLP+ Mф and BLP- Mф as background. Comparison of the upregulated DEGs in BLP- Mф and in cluster 6 is evaluated with the same procedure.
Microbiota depletion
Antibiotics cocktail was prepared as described previously (Qiu et al., 2015) and contained Ampicillin A9393 1mg/mL+ Gentamicin sulfate G4918 1mg/mL+ Vancomycin 861987 0,5mg/mL+ Metronidazole M1547 1mg/mL+ Neomycin trisulfate salt N1876 1mg/mL (all products purchased at Sigma-Aldrich). For fungi depletion, fluconazole (0,5 mg/mL, F8929, Sigma-Aldrich) and amphotericin B (1 mg/kg, A9528, Sigma-Aldrich) were used. Mice were force-fed for 10 (for fluconazole and antibiotics treatment) or 14 (for amphotericin B treatment) consecutive days by using plastic feeding tubes (FTP-20-38-50, Phymep) greased with Vaseline. Volume of the fed solution was normalized to the weight of an animal (200 uL / 20 g mouse). Solutions were kept at +4C in the dark, and renewed every 5 days.
Bacterial and Fungal colonization of germ-free mice
8-10-week-old germ-free mice were orally either force-fed with Altered Schaedler flora (ASF) or C. albicans. After bacterial or fungal colonization, all mice were maintained within sterile vinyl isolators for 3 weeks and then sacrificed to obtain colonic tissues. For bacterial colonization, cecal contents from a ASF mouse were directly diluted with 5 mL sterile PBS to obtain ASF solution. Then each germ-free mouse was fed with 300 μL ASF cecal contents solution. For fungal colonization, C. albicans strain (SC 5314, (1 × 10⁸ CFU/mouse) were cultured in Sabouraud dextrose broth (SDB) and then washed by sterile PBS twice before oral inoculation.
Intra-rectal infusions
The main driving force for water absorption by colonic epithelium is the osmolarity gradient (Masyuk et al., 2002), with the colonic stroma osmolarity of 800-1000 mOsmol/kg (Thiagarajah et al., 2001). Based on these studies, we have chosen to infuse the solution which is hypotonic to the stroma (DPBS with Ca2+ and Mg2+ with osmolarity of 290-315 mOsmol/kg, half-diluted in the distilled water). Solutions were prepared 30 min before the infusion at latest and volumes were adjusted to the weight of the individual mice (150uL per 20 g mouse). Solutions were pre-heated to 37C just before infusion into the animals.
Hydrazide coupled with Alexa Fluor™ 633 (A30634, Thermo Fisher Scientific) was used to trace fluid absorption. Stock solution (25x, 10 mg/mL) was prepared by diluting 1 mg into 100 uL of sterile distilled water and kept at −20C prior to use. Final infusion solution contained 0,4 mg/mL Hydrazide Alexa Fluor™ 633, DPBS (10x with Ca2+ and Mg2+, 1:20 diluted), and sterile distilled water.
Gliotoxin (G9893-5MG, Sigma-Aldrich) solution was prepared and used immediately after the purchase and never kept at −20C or at +4C. Stock solution (383x) was prepared by diluting 5 mg into 1 mL of sterile DMSO. Final infusion solution was prepared on ice and contained 13 μg/mL of Gliotoxin, 0,4 mg/mL Hydrazide-AlexaFluor633, DPBS (10x, 1:20 diluted), and sterile distilled water. Solution was kept on ice in the dark and was heated for 3 min before the infusion.
T-2 (T4887-25MG, Sigma-Aldrich) solution was prepared using DMSO and stored at −80C prior use no longer than 2 weeks. Animals were infused with 1mg/kg of T-2 toxin. Final infusion solution was prepared on ice and contained T-2 toxin, 0,4 mg/mL Hydrazide-AlexaFluor633, DPBS (10x, 1:20 diluted), and sterile distilled water. Solution was kept on ice in the dark and was heated for 3 min before the infusion.
Candidalysin (PCT-4494-v, Peptides International) solution was prepared using DMSO and stored at −80C prior use no longer than 2 weeks. Animals were infused with 75 μg/kg of Candidalysin. Final infusion solution was prepared on ice and contained Candidalysin, 0,4 mg/mL Hydrazide-AlexaFluor633, DPBS (10x, 1:20 diluted), and sterile distilled water. Solution was kept on ice in the dark and was heated for 3 min before the infusion.
To empty the distal colon prior to infusion, mice’s stomachs were massaged 5-7 times with 5 min intervals. Animals were then placed under isoflurane gas anesthesia (2.5% v/v), on the heating pad, their breath rate was monitored and percentage of the isoflurane was adjusted based on the breathing rhythm. If mice were showing signs of suffocation, isoflurane dose was decreased. Efficiency of anesthesia was validated prior to the infusion, by the loss of pedal withdrawal reflex. To avoid dehydration animals were subcutaneously injected with warm 0,9% NaCl, 100 uL per animal. After 10 min from the start of anesthesia administration if pedal withdrawal reflex was lost, pre-heated infusion solution was administrated through 1mL syringe with connected plastic feeding tube (FTP-20-38-50, Phymep). Tube’s tip was immersed in the infusion solution to facilitate the intra-rectal insertion. Because the infusion solution was rapidly excreted in the majority of animals, the excreted solution was collected and re-infused every 5 min.
Colonic permeability measurement
To monitor the efficiency of systemic absorption through the colon mucosa, mice were infused with Hydrazide Alexa Fluor™ 633 in hypotonic solution as described above. To measure efficiency of absorption into the blood, 2 min 30 s prior to the end of the infusion, thorax was cut open and blood was collected by cardiac puncture from the left ventricle. Since absorption of hemoglobin may interact with absorption/emission of Alexa Fluor™ 633, we applied following procedures to avoid hemolysis, such as: (1) use of pre-heated 20G needles with 1mL syringe (2) horizontal positioning of the syringe during the cardiac puncture to decrease the force applied to collect blood (3) slow blood collection and withdrawal into the 2 mL Eppendorf tubes, on average collection was taking 2 min and withdrawal – 30 s. After the blood collection, Eppendorf tubes were placed in the dark and were left to coagulate for 30 min at RT. After blood was centrifuged at 2200 rcf at 10-15C for 15 min and serum (supernatant) was collected into new 1.5 mL Eppendorf tubes. After the second centrifugation at 2200 rcf at 10-15C for 10 min, serum (supernatant) was placed in 96 well plate, calibration curves were prepared by serial dilutions of Hydrazide Alexa Fluor™ 633, and fluorescence intensity was read on CLARIOstar™ plate reader (BMG LABTECH Inc). To measure the efficiency of epithelial absorption, colon tissues were fixed and stained with phalloidin, DAPI and Laminin antibodies. After z stacks were acquired for every section and amount of Hydrazide positive epithelial cells were quantified and normalized per number of crypts.
Stimulation of water absorption by aldosterone administration
We used aldosterone injections to stimulate water absorption specifically in distal colon (Garty, 2000; Goldschmidt et al., 2004; Greig et al., 2002). To partially repress endogenous aldosterone production, mice received 0.3% of NaCl in drinking water at least 5 days prior to the injection, as described previously (Fakitsas et al., 2007; Turchin et al., 2006). Mice were after i.p. injected with aldosterone (10 mg/kg, in 0.33% ethanol and 0.9% NaCl, A9477, Sigma-Aldrich), sacrificed after 2, 4, 6 and 8 h and tissue were treated as described above. Control animals were injected with the solvent and sacrificed 2 h and 8 h after the injection.
Laxative treatment
Bisacodyl, stimulant laxative, which stimulates Cl- secretion in the colon and not in the small intestine was used to decrease water absorption (Engelhorn et al., 2014; Ikarashi et al., 2011). As described previously (Ikarashi et al., 2011), bisacodyl was administrated by oral gavage (20 mg/kg, B1390, Sigma-Aldrich) and mice were sacrificed 5 h later. In addition, indomethacin (10 mg/kg, I7378, Sigma-Aldrich) was i.p. injected 15 min before oral administration of bisacodyl, to inhibit the bisacodyl activity, other conditions received injection of the solvent.
Anti-CSF1R antibody – mediated macrophage depletion
To produce anti-CSF1R antibody we used the hybridoma cell line AFS98, which was cultured in protein-free hybridome medium (PFHM-II GIBCO ref: 12040-077) in disposable reactor cell culture flasks (CELLine 1000 Wheaton ref: WCL1000-1) for 7 days, and antibodies were purified with disposable PD10 desalting columns (GE healthcare ref: 17-0851-01). Mice were i.p. injected with 37.5 mg/kg of antibodies, diluted in PBS every 24 h for 3 consecutive days and killed 24 h after the 3rd injection.
Quantification and Statistical Analysis
Image analysis and processing
Image analysis and processing was performed using Fiji software (Schindelin et al., 2012). Quantification of BLPs and Мϕ were performed using the CellCounter build-in plugin, by manually counting the number of BLPs and crypts on every slide of the acquired z stack. 3D reconstructions and movies were created using Imaris software.
For experiments with more than 4 colors staining, un-mixing approach was used to remove fluorophores spillover. As described in (Gerner et al., 2012), we used single stain tissues to obtain compensation coefficients that were after applied to perform spectral un-mixing using an homemade Fiji macro.
First, we have chosen the fluorophores combination to minimize crosstalk in between fluorescent emissions when It was impossible to separate the dyes on excitation. A maximum of a 9 colors configuration with 4 lasers set up was used (Figure S6A). Second, to choose the fluorophore for each particular antigen, we evaluated the staining efficiency. To do so, we performed individual staining for each particular antigen using the same fluorophore and then we attributed the less efficient staining to the channel that receive less spillover contribution from the other channels. Additionally, staining that label the same cells/structures were put in channels with minimized cross-talk. Third, to obtain compensation coefficients, single stained tissues were imaged with the same microscope settings used for tissues stained with the whole panel of antibodies. Coefficients were calculated as described previously (Roederer, 2002) and imported into the matrix (Figure S6B). After inverse matrix was calculated using Excel and contained compensation coefficients used for spectral un-mixing. Additional details are available on the macro code.
Figure S6.

Spectral Unmixing Protocol, Related to STAR Methods
(A) Combination of fluorophores and detection configuration used for 9-color imaging with 4 lasers.
(B) Compensation coefficient matrix obtained with single-color labeled controls.
(C) Example of spectral unmixing with APC and Alexa680 dyes, scale bar – 50 μm.
Statistics
Statistical significance was calculated between two groups by Mann-Whitney test. Multiple comparison Kruskal-Wallis, Dunn`s and Holm-Sidak’s tests were used to calculate statistical significance between multiple groups. Analyses were performed using GraphPad Prism 8 software. Error bars represent SEM and p < 0.05 was considered statistically significant (∗p < 0.05, ∗∗p < 0.01, ∗∗∗p < 0.001).
Acknowledgments
We would like to thank Vignjevic and Lennon’s teams for helpful discussions and critical readings of the manuscript. We thank Dr. Andreas Schlitzer and Natalie Katzmarski for providing the Dectin-1KO mouse strain. We acknowledge the Cell and Tissue Imaging facility (PICT-IBiSA), Animal Facility, FACS, and Bioinformatic platform (Kamoun Choumouss) of Institut Curie. We also acknowledge “Ecole Doctorale Frontières de l'Innovation en Recherche et Education - Programme Bettencourt,” ITMO Cancer-Aviesan and Fondation pour la Recherche Médicale for financial support (A.S.C.). This project has received funding from the European Research Council (ERC) under the European Union’s Horizon 2020 research and innovation program (grant agreement no. 772487 to D.M.V. and STRAPACEMI to A.-M.L.-D.), the DCBIOL Labex (ANR-10-IDEX-0001-02-PSL and ANR-11-LABX-0043), the Fondation pour la Recherche Médicale, and the Institut National Du Cancer to A.-M.L.-D. Defined microbiota, fungal mono-colonization, and GF experiments were funded by US National Institute of Health (grants R01 DK113136 and DK121977 to I.D.I.). High-throughput sequencing has been performed by the ICGex NGS platform Institut Curie supported by the grants ANR-10-EQPX-03 (Equipex) and ANR-10-INBS-09-08 (France Génomique Consortium) from the Agence Nationale de la Recherche (“Investissements d’Avenir” program), by the Canceropôle lle-de-France and by the SiRIC-Curie program (SiRIC grant INCa-DGOS- 4654).
Author Contributions
A.S.C. conducted most of the experimental work and participated in experiment design and manuscript preparation. F.N. performed all bioinformatic analyses. M.M. developed spectral-unmixing protocol and wrote macros for image analysis. M.S.-R. performed correlative EM. T.T.-B. helped with BLP imaging experiments. X.V.L. performed germ-free mice reconstitution experiments. S.L. and S.B. prepared RNA-seq libraries. S.H. and B.M. built CD64DTR mice. L.L.M. produced anti-CSF1R antibody. J.B. helped with water-infusion experiments. I.D.I. supervised germ-free mice reconstitution experiments and, together with J.M.B., provided key intellectual input. D.M.V. and A.-M.L.-D. coordinated and supervised the study and wrote the manuscript. All authors helped with manuscript preparation.
Declaration of Interests
The authors declare no competing interests.
Published: September 23, 2020
Footnotes
Supplemental Information can be found online at https://doi.org/10.1016/j.cell.2020.08.048.
A video abstract is available at https://doi.org/10.1016/j.cell.2020.08.048#mmc6.
Contributor Information
Danijela Matic Vignjevic, Email: danijela.vignjevic@curie.fr.
Ana-Maria Lennon-Duménil, Email: ana-maria.lennon@curie.fr.
Supplemental Information
References
- Al-Bahrani A.Z., Darwish A., Hamza N., Benson J., Eddleston J.M., Snider R.H., Nylén E.S., Becker K.L., Barclay G.R., Ammori B.J. Gut barrier dysfunction in critically ill surgical patients with abdominal compartment syndrome. Pancreas. 2010;39:1064–1069. doi: 10.1097/MPA.0b013e3181da8d51. [DOI] [PubMed] [Google Scholar]
- Anbazhagan A.N., Priyamvada S., Alrefai W.A., Dudeja P.K. Pathophysiology of IBD associated diarrhea. Tissue Barriers. 2018;6:e1463897. doi: 10.1080/21688370.2018.1463897. [DOI] [PMC free article] [PubMed] [Google Scholar]
- Anderson T.M., Clay M.C., Cioffi A.G., Diaz K.A., Hisao G.S., Tuttle M.D., Nieuwkoop A.J., Comellas G., Maryum N., Wang S. Amphotericin forms an extramembranous and fungicidal sterol sponge. Nat. Chem. Biol. 2014;10:400–406. doi: 10.1038/nchembio.1496. [DOI] [PMC free article] [PubMed] [Google Scholar]
- Bain C.C., Scott C.L., Uronen-Hansson H., Gudjonsson S., Jansson O., Grip O., Guilliams M., Malissen B., Agace W.W., Mowat A.M.I. Resident and pro-inflammatory macrophages in the colon represent alternative context-dependent fates of the same Ly6Chi monocyte precursors. Mucosal Immunol. 2013;6:498–510. doi: 10.1038/mi.2012.89. [DOI] [PMC free article] [PubMed] [Google Scholar]
- Ballard S.T., Hunter J.H., Taylor A.E. Regulation of tight-junction permeability during nutrient absorption across the intestinal epithelium. Annu. Rev. Nutr. 1995;15:35–55. doi: 10.1146/annurev.nu.15.070195.000343. [DOI] [PubMed] [Google Scholar]
- Baranska A., Shawket A., Jouve M., Baratin M., Malosse C., Voluzan O., Vu Manh T.P., Fiore F., Bajénoff M., Benaroch P. Unveiling skin macrophage dynamics explains both tattoo persistence and strenuous removal. J. Exp. Med. 2018;215:1115–1133. doi: 10.1084/jem.20171608. [DOI] [PMC free article] [PubMed] [Google Scholar]
- Bertling A., Niemann S., Uekötter A., Fegeler W., Lass-Flörl C., von Eiff C., Kehrel B.E. Candida albicans and its metabolite gliotoxin inhibit platelet function via interaction with thiols. Thromb. Haemost. 2010;104:270–278. doi: 10.1160/TH09-11-0769. [DOI] [PubMed] [Google Scholar]
- Bolard J., Joly V., Yeni P. Mechanism of action of Amphotericin B at the cellular level. Its modulation by delivery systems. J. Liposome Res. 1993;3:409–427. [Google Scholar]
- Brockmann L., Gagliani N., Steglich B., Giannou A.D., Kempski J., Pelczar P., Geffken M., Mfarrej B., Huber F., Herkel J. IL-10 Receptor Signaling Is Essential for TR1 Cell Function In Vivo. J. Immunol. 2017;198:1130–1141. doi: 10.4049/jimmunol.1601045. [DOI] [PMC free article] [PubMed] [Google Scholar]
- Bukelskien V. Study of health risks associated with Aspergillus amstelodami and its mycotoxic effects. Ekologija (Liet. Moksl. Akad.) 2006;3:42–47. [Google Scholar]
- Caton M.L., Smith-Raska M.R., Reizis B. Notch-RBP-J signaling controls the homeostasis of CD8- dendritic cells in the spleen. J. Exp. Med. 2007;204:1653–1664. doi: 10.1084/jem.20062648. [DOI] [PMC free article] [PubMed] [Google Scholar]
- Chabaud M., Heuze M.L., Bretou M., Vargas P., Maiuri P., Solanes P., Maurin M., Terriac E., Le Berre M., Lankar D. Cell migration and antigen capture are antagonistic processes coupled by myosin II in dendritic cells. Nat. Commun. 2015;6:7526. doi: 10.1038/ncomms8526. [DOI] [PMC free article] [PubMed] [Google Scholar]
- Cummings R.J., Barbet G., Bongers G., Hartmann B.M., Gettler K., Muniz L., Furtado G.C., Cho J., Lira S.A., Blander J.M. Different tissue phagocytes sample apoptotic cells to direct distinct homeostasis programs. Nature. 2016;539:565–569. doi: 10.1038/nature20138. [DOI] [PMC free article] [PubMed] [Google Scholar]
- Dalton J.E., Cruickshank S.M., Egan C.E., Mears R., Newton D.J., Andrew E.M., Lawrence B., Howell G., Else K.J., Gubbels M.J. Intraepithelial gammadelta+ lymphocytes maintain the integrity of intestinal epithelial tight junctions in response to infection. Gastroenterology. 2006;131:818–829. doi: 10.1053/j.gastro.2006.06.003. [DOI] [PubMed] [Google Scholar]
- de Haan J.J., Lubbers T., Derikx J.P., Relja B., Henrich D., Greve J.W., Marzi I., Buurman W.A. Rapid development of intestinal cell damage following severe trauma: a prospective observational cohort study. Crit. Care. 2009;13:R86. doi: 10.1186/cc7910. [DOI] [PMC free article] [PubMed] [Google Scholar]
- De Santis S., Cavalcanti E., Mastronardi M., Jirillo E., Chieppa M. Nutritional keys for intestinal barrier modulation. Front. Immunol. 2015;6:612. doi: 10.3389/fimmu.2015.00612. [DOI] [PMC free article] [PubMed] [Google Scholar]
- Denning T.L., Norris B.A., Medina-Contreras O., Manicassamy S., Geem D., Madan R., Karp C.L., Pulendran B. Functional specializations of intestinal dendritic cell and macrophage subsets that control Th17 and regulatory T cell responses are dependent on the T cell/APC ratio, source of mouse strain, and regional localization. J. Immunol. 2011;187:733–747. doi: 10.4049/jimmunol.1002701. [DOI] [PMC free article] [PubMed] [Google Scholar]
- Dolman D., Edmonds C.J. The effect of aldosterone and the renin-angiotensin system on sodium, potassium and chloride transport by proximal and distal rat colon in vivo. J. Physiol. 1975;250:597–611. doi: 10.1113/jphysiol.1975.sp011072. [DOI] [PMC free article] [PubMed] [Google Scholar]
- Donaldson G.P., Lee S.M., Mazmanian S.K. Gut biogeography of the bacterial microbiota. Nat. Rev. Microbiol. 2016;14:20–32. doi: 10.1038/nrmicro3552. [DOI] [PMC free article] [PubMed] [Google Scholar]
- Egbuta M.A., Mwanza M., Babalola O.O. Health risks associated with exposure to filamentous fungi. Int. J. Environ. Res. Public Health. 2017;14:14–17. doi: 10.3390/ijerph14070719. [DOI] [PMC free article] [PubMed] [Google Scholar]
- el Marjou F., Janssen K.P., Chang B.H.J., Li M., Hindie V., Chan L., Louvard D., Chambon P., Metzger D., Robine S. Tissue-specific and inducible Cre-mediated recombination in the gut epithelium. Genesis. 2004;39:186–193. doi: 10.1002/gene.20042. [DOI] [PubMed] [Google Scholar]
- Engelhorn R., Seeger E., Zwaving J.H., Eberlin M. Ullmann’s Encyclopedia of Industrial Chemistry. Wiley-VCH Verlag GmbH & Co.; 2014. Laxatives. [DOI] [Google Scholar]
- Esteban A., Popp M.W., Vyas V.K., Strijbis K., Ploegh H.L., Fink G.R. Fungal recognition is mediated by the association of dectin-1 and galectin-3 in macrophages. Proc. Natl. Acad. Sci. USA. 2011;108:14270–14275. doi: 10.1073/pnas.1111415108. [DOI] [PMC free article] [PubMed] [Google Scholar]
- Fakitsas P., Adam G., Daidié D., van Bemmelen M.X., Fouladkou F., Patrignani A., Wagner U., Warth R., Camargo S.M.R., Staub O., Verrey F. Early aldosterone-induced gene product regulates the epithelial sodium channel by deubiquitylation. J. Am. Soc. Nephrol. 2007;18:1084–1092. doi: 10.1681/ASN.2006080902. [DOI] [PubMed] [Google Scholar]
- Fishman J.E., Levy G., Alli V., Zheng X., Mole D.J., Deitch E.A. The intestinal mucus layer is a critical component of the gut barrier that is damaged during acute pancreatitis. Shock. 2014;42:264–270. doi: 10.1097/SHK.0000000000000209. [DOI] [PMC free article] [PubMed] [Google Scholar]
- Flynn K.J., Ruffin M.T., 4th, Turgeon D.K., Schloss P.D. Spatial variation of the native colon microbiota in healthy adults. Cancer Prev. Res. (Phila.) 2018;11:393–402. doi: 10.1158/1940-6207.CAPR-17-0370. [DOI] [PubMed] [Google Scholar]
- Foster E.S., Budinger M.E., Hayslett J.P., Binder H.J. Ion transport in proximal colon of the rat. Sodium depletion stimulates neutral sodium chloride absorption. J. Clin. Invest. 1986;77:228–235. doi: 10.1172/JCI112281. [DOI] [PMC free article] [PubMed] [Google Scholar]
- Garty H. Regulation of the epithelial Na+ channel by aldosterone: open questions and emerging answers. Kidney Int. 2000;57:1270–1276. doi: 10.1046/j.1523-1755.2000.00961.x. [DOI] [PubMed] [Google Scholar]
- Genua M., D’Alessio S., Cibella J., Gandelli A., Sala E., Correale C., Spinelli A., Arena V., Malesci A., Rutella S. The urokinase plasminogen activator receptor (uPAR) controls macrophage phagocytosis in intestinal inflammation. Gut. 2015;64:589–600. doi: 10.1136/gutjnl-2013-305933. [DOI] [PubMed] [Google Scholar]
- Gerner M.Y., Kastenmuller W., Ifrim I., Kabat J., Germain R.N. Histo-cytometry: a method for highly multiplex quantitative tissue imaging analysis applied to dendritic cell subset microanatomy in lymph nodes. Immunity. 2012;37:364–376. doi: 10.1016/j.immuni.2012.07.011. [DOI] [PMC free article] [PubMed] [Google Scholar]
- Gitter A.H., Bendfeldt K., Schulzke J.D., Fromm M. Trans/paracellular, surface/crypt, and epithelial/subepithelial resistances of mammalian colonic epithelia. Pflugers Arch. 2000;439:477–482. doi: 10.1007/s004249900202. [DOI] [PubMed] [Google Scholar]
- Goldschmidt I., Grahammer F., Warth R., Schulz-Baldes A., Garty H., Greger R., Bleich M. Kidney and colon electrolyte transport in CHIF knockout mice. Cell. Physiol. Biochem. 2004;14:113–120. doi: 10.1159/000076932. [DOI] [PubMed] [Google Scholar]
- Greig E.R., Baker E.H., Mathialahan T., Boot-Handford R.P., Sandle G.I. Segmental variability of ENaC subunit expression in rat colon during dietary sodium depletion. Pflugers Arch. 2002;444:476–483. doi: 10.1007/s00424-002-0828-7. [DOI] [PubMed] [Google Scholar]
- Groschwitz K.R., Ahrens R., Osterfeld H., Gurish M.F., Han X., Åbrink M., Finkelman F.D., Pejler G., Hogan S.P. Mast cells regulate homeostatic intestinal epithelial migration and barrier function by a chymase/Mcpt4-dependent mechanism. Proc. Natl. Acad. Sci. USA. 2009;106:22381–22386. doi: 10.1073/pnas.0906372106. [DOI] [PMC free article] [PubMed] [Google Scholar]
- Hardin J.A., Kimm M.H., Wirasinghe M., Gall D.G. Macromolecular transport across the rabbit proximal and distal colon. Gut. 1999;44:218–225. doi: 10.1136/gut.44.2.218. [DOI] [PMC free article] [PubMed] [Google Scholar]
- Ikarashi N., Baba K., Ushiki T., Kon R., Mimura A., Toda T., Ishii M., Ochiai W., Sugiyama K. The laxative effect of bisacodyl is attributable to decreased aquaporin-3 expression in the colon induced by increased PGE2 secretion from macrophages. Am. J. Physiol. Gastrointest. Liver Physiol. 2011;301:G887–G895. doi: 10.1152/ajpgi.00286.2011. [DOI] [PubMed] [Google Scholar]
- Iliev I.D., Funari V.A., Taylor K.D., Nguyen Q., Reyes C.N., Strom S.P., Brown J., Becker C.A., Fleshner P.R., Dubinsky M. Interactions between commensal fungi and the C-type lectin receptor Dectin-1 influence colitis. Science. 2012;336:1314–1317. doi: 10.1126/science.1221789. [DOI] [PMC free article] [PubMed] [Google Scholar]
- Ismaiel A.A., Papenbrock J. Mycotoxins: Producing fungi and mechanisms of phytotoxicity. Agriculture. 2015;5:492–537. [Google Scholar]
- Kamphuis J.B.J., Mercier-Bonin M., Eutamène H., Theodorou V. Mucus organisation is shaped by colonic content; a new view. Sci. Rep. 2017;7:8527. doi: 10.1038/s41598-017-08938-3. [DOI] [PMC free article] [PubMed] [Google Scholar]
- Kang B., Alvarado L.J., Kim T., Lehmann M.L., Cho H., He J., Li P., Kim B.-H., Larochelle A., Kelsall B.L. Commensal microbiota drive the functional diversification of colon macrophages. Mucosal Immunol. 2020;13:216–229. doi: 10.1038/s41385-019-0228-3. [DOI] [PMC free article] [PubMed] [Google Scholar]
- Kohatsu L., Hsu D.K., Jegalian A.G., Liu F.-T., Baum L.G. Galectin-3 induces death of Candida species expressing specific β-1,2-linked mannans. J. Immunol. 2006;177:4718–4726. doi: 10.4049/jimmunol.177.7.4718. [DOI] [PubMed] [Google Scholar]
- Kosalec I., Puel O., Delaforge M., Kopjar N., Antolovic R., Jelic D., Matica B., Galtier P., Pepeljnjak S. Isolation and cytotoxicity of low-molecular-weight metabolites of Candida albicans. Front. Biosci. 2008;13:6893–6904. doi: 10.2741/3197. [DOI] [PubMed] [Google Scholar]
- Kupfahl C., Ruppert T., Dietz A., Geginat G., Hof H. Candida species fail to produce the immunosuppressive secondary metabolite gliotoxin in vitro. FEMS Yeast Res. 2007;7:986–992. doi: 10.1111/j.1567-1364.2007.00256.x. [DOI] [PubMed] [Google Scholar]
- Leonardi I., Li X., Semon A., Li D., Doron I., Putzel G., Bar A., Prieto D., Rescigno M., McGovern D.P.B. CX3CR1+ mononuclear phagocytes control immunity to intestinal fungi. Science. 2018;359:232–236. doi: 10.1126/science.aao1503. [DOI] [PMC free article] [PubMed] [Google Scholar]
- Lewis R.E., Wiederhold N.P., Lionakis M.S., Prince R.A., Kontoyiannis D.P. Frequency and species distribution of gliotoxin-producing Aspergillus isolates recovered from patients at a tertiary-care cancer center. J. Clin. Microbiol. 2005;43:6120–6122. doi: 10.1128/JCM.43.12.6120-6122.2005. [DOI] [PMC free article] [PubMed] [Google Scholar]
- Li X., Leonardi I., Semon A., Doron I., Gao I.H., Putzel G.G., Kim Y., Kabata H., Artis D., Fiers W.D. Response to Fungal Dysbiosis by Gut-Resident CX3CR1+ Mononuclear Phagocytes Aggravates Allergic Airway Disease. Cell Host Microbe. 2018;24:847–856.e4. doi: 10.1016/j.chom.2018.11.003. [DOI] [PMC free article] [PubMed] [Google Scholar]
- Linden J.R., De Paepe M.E., Laforce-Nesbitt S.S., Bliss J.M. Galectin-3 plays an important role in protection against disseminated candidiasis. Med. Mycol. 2013;51:641–651. doi: 10.3109/13693786.2013.770607. [DOI] [PMC free article] [PubMed] [Google Scholar]
- Marasas W.F.O., Yagen B., Sydenham E., Combrinck S., Thiel P.G. Comparative yields of T-2 toxin and related trichothecenes from five toxicologically important strains of Fusarium sporotrichioides. Appl. Environ. Microbiol. 1987;53:693–696. doi: 10.1128/aem.53.4.693-696.1987. [DOI] [PMC free article] [PubMed] [Google Scholar]
- Martínez C., González-Castro A., Vicario M., Santos J. Cellular and molecular basis of intestinal barrier dysfunction in the irritable bowel syndrome. Gut Liver. 2012;6:305–315. doi: 10.5009/gnl.2012.6.3.305. [DOI] [PMC free article] [PubMed] [Google Scholar]
- Martinez-Guryn K., Hubert N., Frazier K., Urlass S., Musch M.W., Ojeda P., Pierre J.F., Miyoshi J., Sontag T.J., Cham C.M. Small Intestine Microbiota Regulate Host Digestive and Absorptive Adaptive Responses to Dietary Lipids. Cell Host Microbe. 2018;23:458–469.e5. doi: 10.1016/j.chom.2018.03.011. [DOI] [PMC free article] [PubMed] [Google Scholar]
- Masyuk A.I., Marinelli R.A., LaRusso N.F. Water transport by epithelia of the digestive tract. Gastroenterology. 2002;122:545–562. doi: 10.1053/gast.2002.31035. [DOI] [PubMed] [Google Scholar]
- Matsuo K., Ota H., Akamatsu T., Sugiyama A., Katsuyama T. Histochemistry of the surface mucous gel layer of the human colon. Gut. 1997;40:782–789. doi: 10.1136/gut.40.6.782. [DOI] [PMC free article] [PubMed] [Google Scholar]
- Mazzini E., Massimiliano L., Penna G., Rescigno M. Oral tolerance can be established via gap junction transfer of fed antigens from CX3CR1+ macrophages to CD103+ dendritic cells. Immunity. 2014;40:248–261. doi: 10.1016/j.immuni.2013.12.012. [DOI] [PubMed] [Google Scholar]
- Melo R.C.N., Morgan E., Monahan-Earley R., Dvorak A.M., Weller P.F. Pre-embedding immunogold labeling to optimize protein localization at subcellular compartments and membrane microdomains of leukocytes. Nat. Protoc. 2014;9:2382–2394. doi: 10.1038/nprot.2014.163. [DOI] [PMC free article] [PubMed] [Google Scholar]
- Metzger D., Chambon P. Site- and time-specific gene targeting in the mouse. Methods. 2001;24:71–80. doi: 10.1006/meth.2001.1159. [DOI] [PubMed] [Google Scholar]
- Michielan A., D’Incà R. Intestinal Permeability in Inflammatory Bowel Disease: Pathogenesis, Clinical Evaluation, and Therapy of Leaky Gut. Mediators Inflamm. 2015;2015:628157. doi: 10.1155/2015/628157. [DOI] [PMC free article] [PubMed] [Google Scholar]
- Morrow J.D. Fluconazole: a new triazole antifungal agent. Am. J. Med. Sci. 1991;302:129–132. doi: 10.1097/00000441-199108000-00012. [DOI] [PubMed] [Google Scholar]
- Mowat A.M., Agace W.W. Regional specialization within the intestinal immune system. Nat. Rev. Immunol. 2014;14:667–685. doi: 10.1038/nri3738. [DOI] [PubMed] [Google Scholar]
- Mowat A.M., Bain C.C. Mucosal macrophages in intestinal homeostasis and inflammation. J. Innate Immun. 2011;3:550–564. doi: 10.1159/000329099. [DOI] [PMC free article] [PubMed] [Google Scholar]
- Muller P.A., Koscsó B., Rajani G.M., Stevanovic K., Berres M.L., Hashimoto D., Mortha A., Leboeuf M., Li X.M., Mucida D. Crosstalk between muscularis macrophages and enteric neurons regulates gastrointestinal motility. Cell. 2014;158:300–313. doi: 10.1016/j.cell.2014.04.050. [DOI] [PMC free article] [PubMed] [Google Scholar]
- Musch M.W., Clarke L.L., Mamah D., Gawenis L.R., Zhang Z., Ellsworth W., Shalowitz D., Mittal N., Efthimiou P., Alnadjim Z. T cell activation causes diarrhea by increasing intestinal permeability and inhibiting epithelial Na+/K+-ATPase. J. Clin. Invest. 2002;110:1739–1747. doi: 10.1172/JCI15695. [DOI] [PMC free article] [PubMed] [Google Scholar]
- Muzumdar M.D., Tasic B., Miyamichi K., Li L., Luo L. A global double-fluorescent Cre reporter mouse. Genesis. 2007;45:593–605. doi: 10.1002/dvg.20335. [DOI] [PubMed] [Google Scholar]
- Naftalin R.J. The dehydrating function of the descending colon in relationship to crypt function. Physiol. Res. 1994;43:65–73. [PubMed] [Google Scholar]
- Nagashima R., Maeda K., Imai Y., Takahashi T. Lamina propria macrophages in the human gastrointestinal mucosa: their distribution, immunohistological phenotype, and function. J. Histochem. Cytochem. 1996;44:721–731. doi: 10.1177/44.7.8675993. [DOI] [PubMed] [Google Scholar]
- Nalle S.C., Turner J.R. Intestinal barrier loss as a critical pathogenic link between inflammatory bowel disease and graft-versus-host disease. Mucosal Immunol. 2015;8:720–730. doi: 10.1038/mi.2015.40. [DOI] [PubMed] [Google Scholar]
- Pull S.L., Doherty J.M., Mills J.C., Gordon J.I., Stappenbeck T.S. Activated macrophages are an adaptive element of the colonic epithelial progenitor niche necessary for regenerative responses to injury. Proc. Natl. Acad. Sci. USA. 2005;102:99–104. doi: 10.1073/pnas.0405979102. [DOI] [PMC free article] [PubMed] [Google Scholar]
- Qiu X., Zhang F., Yang X., Wu N., Jiang W., Li X., Li X., Liu Y. Changes in the composition of intestinal fungi and their role in mice with dextran sulfate sodium-induced colitis. Sci. Rep. 2015;5:10416. doi: 10.1038/srep10416. [DOI] [PMC free article] [PubMed] [Google Scholar]
- Rescigno M., Urbano M., Valzasina B., Francolini M., Rotta G., Bonasio R., Granucci F., Kraehenbuhl J.P., Ricciardi-Castagnoli P. Dendritic cells express tight junction proteins and penetrate gut epithelial monolayers to sample bacteria. Nat. Immunol. 2001;2:361–367. doi: 10.1038/86373. [DOI] [PubMed] [Google Scholar]
- Roederer M. Compensation in flow cytometry. Curr. Protoc. Cytom. 2002;Chapter 1 doi: 10.1002/0471142956.cy0114s22. [DOI] [PubMed] [Google Scholar]
- Rogier R., Ederveen T.H.A., Boekhorst J., Wopereis H., Scher J.U., Manasson J., Frambach S.J.C.M., Knol J., Garssen J., van der Kraan P.M. Aberrant intestinal microbiota due to IL-1 receptor antagonist deficiency promotes IL-17- and TLR4-dependent arthritis. Microbiome. 2017;5:63. doi: 10.1186/s40168-017-0278-2. [DOI] [PMC free article] [PubMed] [Google Scholar]
- Rubio C.A., Langner C., Schmidt P.T. Partial to complete abrogation of the subepithelial macrophage barrier against the gut microbiota in patients with ulcerative colitis and Crohn’s colitis. Histopathology. 2018;72:580–587. doi: 10.1111/his.13417. [DOI] [PubMed] [Google Scholar]
- Satija R., Farrell J.A., Gennert D., Schier A.F., Regev A. Spatial reconstruction of single-cell gene expression data. Nat. Biotechnol. 2015;33:495–502. doi: 10.1038/nbt.3192. [DOI] [PMC free article] [PubMed] [Google Scholar]
- Schindelin J., Arganda-Carreras I., Frise E., Kaynig V., Longair M., Pietzsch T., Preibisch S., Rueden C., Saalfeld S., Schmid B. Fiji: an open-source platform for biological-image analysis. Nat. Methods. 2012;9:676–682. doi: 10.1038/nmeth.2019. [DOI] [PMC free article] [PubMed] [Google Scholar]
- Schneider C.A., Rasband W.S., Eliceiri K.W. NIH Image to ImageJ: 25 years of image analysis. Nature methods. 2012;9:671–675. doi: 10.1038/nmeth.2089. [DOI] [PMC free article] [PubMed] [Google Scholar]
- Schröder B. The multifaceted roles of the invariant chain CD74 — More than just a chaperone. Biochim. Biophys. Acta - Mol. Cell Res. 2016;1863:1269–1281. doi: 10.1016/j.bbamcr.2016.03.026. [DOI] [PubMed] [Google Scholar]
- Schulthess J., Pandey S., Capitani M., Rue-Albrecht K.C., Arnold I., Franchini F., Chomka A., Ilott N.E., Johnston D.G.W., Pires E. The Short Chain Fatty Acid Butyrate Imprints an Antimicrobial Program in Macrophages. Immunity. 2019;50:432–445.e7. doi: 10.1016/j.immuni.2018.12.018. [DOI] [PMC free article] [PubMed] [Google Scholar]
- Scupham A.J., Presley L.L., Wei B., Bent E., Griffith N., McPherson M., Zhu F., Oluwadara O., Rao N., Braun J., Borneman J. Abundant and diverse fungal microbiota in the murine intestine. Appl. Environ. Microbiol. 2006;72:793–801. doi: 10.1128/AEM.72.1.793-801.2006. [DOI] [PMC free article] [PubMed] [Google Scholar]
- Seo S.-U., Kamada N., Muñoz-Planillo R., Kim Y.-G., Kim D., Koizumi Y., Hasegawa M., Himpsl S.D., Browne H.P., Lawley T.D. Distinct commensals induce interleukin-1β via NLRP3 inflammasome in inflammatory monocytes to promote intestinal inflammation in response to injury. Immunity. 2015;42:744–755. doi: 10.1016/j.immuni.2015.03.004. [DOI] [PMC free article] [PubMed] [Google Scholar]
- Shah D.T., Larsen B. Clinical isolates of yeast produce a gliotoxin-like substance. Mycopathologia. 1991;116:203–208. doi: 10.1007/BF00436836. [DOI] [PubMed] [Google Scholar]
- Shah D.T., Glover D.D., Larsen B. In situ mycotoxin production by Candida albicans in women with vaginitis. Gynecol. Obstet. Invest. 1995;39:67–69. doi: 10.1159/000292381. [DOI] [PubMed] [Google Scholar]
- Shouval S., Biswas D., Goettel A., McCann J.A., Conaway K., Naresh E., Mascanfroni S.R., Adham I.D., Al Z., Lavoie S. Interleukin-10 Receptor Signaling in Innate Immune Cells Regulates Mucosal Immune Tolerance and Anti-Inflammatory Macrophage Function. Immunity. 2014;40:706–719. doi: 10.1016/j.immuni.2014.03.011. [DOI] [PMC free article] [PubMed] [Google Scholar]
- Sisirak V., Sally B., D’Agati V., Martinez-Ortiz W., Özçakar Z.B., David J., Rashidfarrokhi A., Yeste A., Panea C., Chida A.S.S. Digestion of Chromatin in Apoptotic Cell Microparticles Prevents Autoimmunity. Cell. 2016;166:88–101. doi: 10.1016/j.cell.2016.05.034. [DOI] [PMC free article] [PubMed] [Google Scholar]
- Smith P.D., Smythies L.E., Shen R., Greenwell-Wild T., Gliozzi M., Wahl S.M. Intestinal macrophages and response to microbial encroachment. Mucosal Immunol. 2011;4:31–42. doi: 10.1038/mi.2010.66. [DOI] [PMC free article] [PubMed] [Google Scholar]
- Smythies L.E., Sellers M., Clements R.H., Mosteller-Barnum M., Meng G., Benjamin W.H., Orenstein J.M., Smith P.D. Human intestinal macrophages display profound inflammatory anergy despite avid phagocytic and bacteriocidal activity. J. Clin. Invest. 2005;115:66–75. doi: 10.1172/JCI19229. [DOI] [PMC free article] [PubMed] [Google Scholar]
- Suzuki M., Tachibana I., Takeda Y., He P., Minami S., Iwasaki T., Kida H., Goya S., Kijima T., Yoshida M. Tetraspanin CD9 negatively regulates lipopolysaccharide-induced macrophage activation and lung inflammation. J. Immunol. 2009;182:6485–6493. doi: 10.4049/jimmunol.0802797. [DOI] [PubMed] [Google Scholar]
- Swank G.M., Deitch E.A. Role of the gut in multiple organ failure: bacterial translocation and permeability changes. World J. Surg. 1996;20:411–417. doi: 10.1007/s002689900065. [DOI] [PubMed] [Google Scholar]
- Thiagarajah J.R., Jayaraman S., Naftalin R.J., Verkman A.S. In vivo fluorescence measurement of Na(+) concentration in the pericryptal space of mouse descending colon. Am. J. Physiol. Cell Physiol. 2001;281:C1898–C1903. doi: 10.1152/ajpcell.2001.281.6.C1898. [DOI] [PubMed] [Google Scholar]
- Tshabalala N., Mrudula P., Dutton M.F. Examination of Candida albicans strains from South Africa for the production of gliotoxin and other cytotoxic secondary metabolites. J. Yeast Fungal Res. 2016;7:19–27. [Google Scholar]
- Turchin A., Guo C.Z., Adler G.K., Ricchiuti V., Kohane I.S., Williams G.H. Effect of acute aldosterone administration on gene expression profile in the heart. Endocrinology. 2006;147:3183–3189. doi: 10.1210/en.2005-1674. [DOI] [PubMed] [Google Scholar]
- Ueda Y., Kayama H., Jeon S.G., Kusu T., Isaka Y., Rakugi H., Yamamoto M., Takeda K. Commensal microbiota induce LPS hyporesponsiveness in colonic macrophages via the production of IL-10. Int. Immunol. 2010;22:953–962. doi: 10.1093/intimm/dxq449. [DOI] [PubMed] [Google Scholar]
- Upperman J.S., Potoka D.A., Zhang X.R., Wong K., Zamora R., Ford H.R. Mechanism of intestinal-derived fungal sepsis by gliotoxin, a fungal metabolite. J. Pediatr. Surg. 2003;38:966–970. doi: 10.1016/s0022-3468(03)00135-0. [DOI] [PubMed] [Google Scholar]
- Vallon-Eberhard A., Landsman L., Yogev N., Verrier B., Jung S. Transepithelial pathogen uptake into the small intestinal lamina propria. J. Immunol. 2006;176:2465–2469. doi: 10.4049/jimmunol.176.4.2465. [DOI] [PubMed] [Google Scholar]
- Viville S., Neefjes J., Lotteau V., Dierich A., Lemeur M., Ploegh H., Benoist C., Mathis D. Mice lacking the MHC class II-associated invariant chain. Cell. 1993;72:635–648. doi: 10.1016/0092-8674(93)90081-z. [DOI] [PubMed] [Google Scholar]
- Weber K., Sohr R., Schulz B., Fleischhacker M., Ruhnke M. Secretion of E,E-farnesol and biofilm formation in eight different Candida species. Antimicrob. Agents Chemother. 2008;52:1859–1861. doi: 10.1128/AAC.01646-07. [DOI] [PMC free article] [PubMed] [Google Scholar]
- Wheeler M.L., Limon J.J., Bar A.S., Leal C.A., Gargus M., Tang J., Brown J., Funari V.A., Wang H.L., Crother T.R. Immunological Consequences of Intestinal Fungal Dysbiosis. Cell Host Microbe. 2016;19:865–873. doi: 10.1016/j.chom.2016.05.003. [DOI] [PMC free article] [PubMed] [Google Scholar]
- Wiersinga W.J., Kager L.M., Hovius J.W.R., van der Windt G.J.W., de Vos A.F., Meijers J.C.M., Roelofs J.J., Dondorp A., Levi M., Day N.P. Urokinase receptor is necessary for bacterial defense against pneumonia-derived septic melioidosis by facilitating phagocytosis. J. Immunol. 2010;184:3079–3086. doi: 10.4049/jimmunol.0901008. [DOI] [PubMed] [Google Scholar]
- Yoseph B.P., Klingensmith N.J., Liang Z., Breed E.R., Burd E.M., Mittal R., Dominguez J.A., Petrie B., Ford M.L., Coopersmith C.M. Mechanisms of Intestinal Barrier Dysfunction in Sepsis. Shock. 2016;46:52–59. doi: 10.1097/SHK.0000000000000565. [DOI] [PMC free article] [PubMed] [Google Scholar]
- Yu L.C.-H. Microbiota dysbiosis and barrier dysfunction in inflammatory bowel disease and colorectal cancers: exploring a common ground hypothesis. J. Biomed. Sci. 2018;25:79. doi: 10.1186/s12929-018-0483-8. [DOI] [PMC free article] [PubMed] [Google Scholar]
- Zheng G.X.Y., Terry J.M., Belgrader P., Ryvkin P., Bent Z.W., Wilson R., Ziraldo S.B., Wheeler T.D., McDermott G.P., Zhu J. Massively parallel digital transcriptional profiling of single cells. Nat. Commun. 2017;8:14049. doi: 10.1038/ncomms14049. [DOI] [PMC free article] [PubMed] [Google Scholar]
- Zigmond E., Bernshtein B., Friedlander G., Walker C.R., Yona S., Kim K.W., Brenner O., Krauthgamer R., Varol C., Müller W., Jung S. Macrophage-restricted interleukin-10 receptor deficiency, but not IL-10 deficiency, causes severe spontaneous colitis. Immunity. 2014;40:720–733. doi: 10.1016/j.immuni.2014.03.012. [DOI] [PubMed] [Google Scholar]
Associated Data
This section collects any data citations, data availability statements, or supplementary materials included in this article.
Supplementary Materials
Green – membrane GFP, blue – CD11b staining, red – CD103 staining, gray – membrane tdTomato. Scale bar – 50 μm in the beginning of the movie, arrows indicate opening of the crypts (00:18, mm:ss), body of the single Mф and BLPs (00:34, mm:ss).
Green – membrane GFP, red – membrane tdTomato. Scale bar – 4 μm in the beginning of the movie.
Data Availability Statement
The scRNaseq datasets generated in this study are available for download at the Gene Expression Omnibus (GEO): GSE146131.
Spectral un-mixing Fiji macro code is available on Mendeley Data: https://doi.org/10.17632/bdfyprfsv9.1
Original/source data for figures in the paper is available on Mendeley Data: https://doi.org/10.17632/zwhhrht7bd.1.