Abstract
OBJECTIVE:
The objective of this study was to determine the proportion of stroke patients presenting in an extended time window who have a thrombolytic treatment target.
BACKGROUND:
Patients presenting up to 24 h after stroke onset have been found to have penumbral tissue on multimodal imaging. Stroke patients presenting in this extended time window without a large vessel occlusion (LVO) may benefit from reperfusion therapy using thrombolysis.
METHODS:
Patients seen at our institutions from 2011 through 2015 were reviewed to identify those who presented >4 h and <24 h from last seen normal (LSN) and did not receive acute treatment. Magnetic resonance imaging (MRI) scans were used to dichotomize patients using a diffusion–perfusion mismatch ratio of 1.2.
RESULTS:
During the study period, 3469 patients were evaluated by our stroke service, with 893 seen 4–24 h from LSN who were not treated. MRI was performed with diffusion and perfusion imaging in 439 patients, of whom 26 were excluded due to hemorrhage and 37 were excluded due to LVO. This left 376 patients who potentially could have been treated with thrombolysis in an extended time window and were included in the analysis. Of these, 156 (42%) demonstrated a mismatch ratio >1.2. Patients with a mismatch presented earlier (P = 0.012), were more likely to be female (P = 0.03), and had higher National Institutes of Health Stroke Scale (P < 0.001).
CONCLUSIONS:
Almost half of the patients presenting 4–24 h from LSN had a target for thrombolysis in our study. Multimodal imaging may be able to expand the population of treatable stroke patients given the results of recent clinical trials.
Keywords: Extended time window, magnetic resonance imaging, penumbral imaging, thrombolysis
Introduction
Patients who present with acute stroke within 4.5 h from symptom onset are eligible for treatment with intravenous tissue plasminogen activator (IV-tPA) under current guidelines.[1] Patients presenting beyond 4.5 h may have endovascular treatment options if they have a large vessel occlusion (LVO),[2,3] but for patients presenting beyond 4.5 h without an LVO, there are currently no approved acute treatment options. Less than 10% of stroke patients are treated with IV-tPA,[4] and arrival outside the eligible time window is the most common reason patients are excluded from thrombolysis.[5]
Although the benefit of thrombolysis is known to be time dependent in the absence of multimodal imaging,[6] more recent studies have found that a subset of acute stroke patients benefit from revascularization independent of time.[7] Although this was initially demonstrated in patients with LVO, recent studies using multimodal imaging to guide thrombolysis have also found potential benefit.[8,9,10] These studies have relied on penumbral imaging to identify the population who may benefit.
The ischemic penumbra[11] can be approximated with magnetic resonance imaging (MRI) using diffusion-weighted imaging (DWI) and perfusion-weighted imaging (PWI).[12] The diffusion–perfusion mismatch (DPMM) is a form of penumbral imaging that can identify tissue that can be salvaged with late window thrombolysis.[13] The purpose of this study was to determine how common it is for patients presenting outside the current treatment window to have a target for thrombolytic treatment and what factors may influence this profile.
Methods
Patient population
This research was conducted as a retrospective analysis of de-identified registry data, for which we obtained a determination of Not Human Subjects Research from the NIH Office of Human Subjects Research Protections.
Data from patients presenting to our stroke service at either of two hospitals (Suburban Hospital, Bethesda, MD or Medstar Washington Hospital Center, Washington, DC) during the 5-year period from January of 2011 through December of 2015 were reviewed for inclusion. Patients who presented between 4 and 24 h from last seen normal (LSN) were included if they did not receive an acute treatment but did have an evaluable MRI with DWI and PWI during that time window. The lower bound of 4 h was used instead of 4.5 h so as to include untreated patients who may not have been treated due to the window closing within 30 min of arrival. In addition to reporting time from LSN to MRI and the time from symptom discovery to MRI, we also report the time from the midpoint between LSN and symptom discovery to the time of the MRI, which has been used as an estimate for patients with an unknown onset in previous studies.[8,9]
Image analysis
All MRIs were performed on a 1.5T GE Signa scanner (General Electric Medical Systems, Milwaukee, WI), a 3T Philips Achieva scanner (Philips Healthcare, Best, The Netherlands), or a 3T Siemens Skyra scanner (Siemens AG, Munich, Germany). Imaging protocols varied between scanners and over this time period. However, all patients had trace-weighted DWI and dynamic susceptibility contrast PWI using gadolinium. Images were reviewed for DPMM both qualitatively and quantitatively. Qualitatively, the DWI trace image and the apparent diffusion coefficient (ADC) map were compared with the time-to-peak (TTP) and/or the mean transit time images generated by the scanner. The presence of a PWI lesion that was visually larger than the DWI lesion was qualitatively considered to represent a mismatch.
Quantitative assessment of the mismatch was performed using the source images of the DWI and PWI sequences, which were processed on a computer workstation using Matlab software (Mathworks, Natick, MA). PWI lesions were identified using a threshold of 4-s relative delay on TTP maps compared to the contralateral hemisphere. Relative delay in TTP has been found to be equivalent to other methods of identifying ischemia but does not require deconvolution of an arterial input function (AIF) making it less susceptible to errors introduced by AIF selection.[14,15] PWI lesions were superimposed on the ADC maps after co-registration of the source images. The mismatch ratio was defined as the total volume of the PWI lesion divided by the volume of the PWI deficit which, when superimposed on the DWI, had an ADC value <620 μm/s.[2] The mismatch calculation process is depicted in Figure 1. Patients were dichotomized into two groups: those with both a visual mismatch and a quantitative mismatch ratio >1.2 and those without (no mismatch). Although clinical trials of endovascular treatment have used a mismatch ratio of >1.8,[2] they have also used a >1.2 threshold.[16] Clinical trials using penumbral imaging to guide thrombolytic therapy have used a cutoff of >1.2,[8,10] which is why that cutoff was chosen for this study. In the case where there was a visual mismatch, but it did not meet the quantitative definition, the case was classified as no mismatch.
Figure 1.
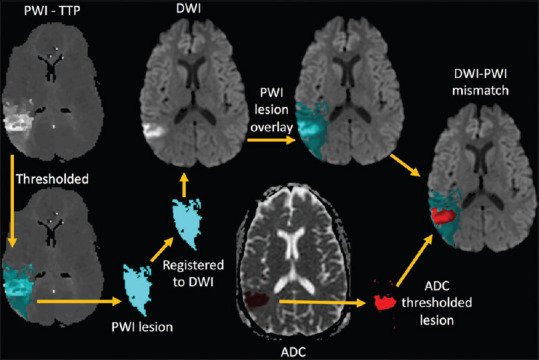
A schematic of how the diffusion–perfusion mismatch was calculated is shown. Perfusion-weighted imaging lesion masks (blue region) were created by applying a threshold of 4 s beyond normal tissue on the time-to-peak maps. The perfusion-weighted imaging lesion mask was transformed using the co-registration matrix and superimposed on the diffusion-weighted imaging. The core infarct (red region) was identified on the apparent diffusion coefficient maps of the diffusion-weighted imaging by applying a threshold of 620 μm/s. The volume of the perfusion-weighted imaging lesion (blue) divided by the volume of core infarct (red) determined the mismatch ratio
Statistical analysis
To assess whether the subgroup of patients who were included in the study due to having had an MRI with DWI/PWI was representative of the overall untreated population who presented at 4–24 h from LSN, a comparison was carried out for gender, age, and National Institutes of Health Stroke Scale (NIHSS) using Fisher's exact test or the Mann–Whitney U-test. Tests were conducted using GraphPad Prism version 8 for Mac (GraphPad Software, La Jolla, CA) using two-tailed tests with significance set at P < 0.05 and results described as medians with interquartile ranges.
Patients with DWI/PWI imaging were dichotomized into two groups, mismatch versus no mismatch, which were compared based on clinical and demographic data using logistic regression in the STATA 13 (StataCorp LLC, College Station, TX) software package. P < 0.05 was considered statistically significant, and any variable with P < 0.10 was included in a multivariate analysis.
Results
During the study period, 3,469 patients were evaluated by our stroke service. Two thousand eight hundred and four had a documented LSN at the time of initial evaluation; 893 of these were in the 4–24-h window and did not receive an acute treatment. From this group, 612 had an MRI scan in the time window, with 439 having diffusion and perfusion imaging that allowed for assessment of a mismatch. Twenty-six patients were excluded for some degree of hemorrhagic transformation and 37 were excluded due to having a LVO that could have been treated with endovascular therapy. This left 376 patients who potentially could have been treated with thrombolysis in an extended time window and were included in the final analysis [Figure 2].
Figure 2.
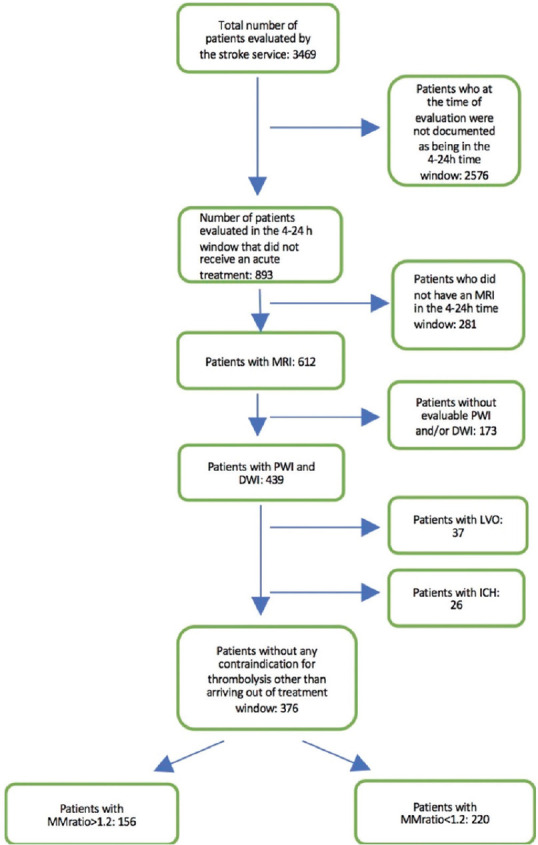
A flow chart shows how patients were included in, or excluded from, the analysis. ICH: Intracranial hemorrhage
A comparison of the included population that had the necessary imaging (n = 376) with the larger population (n = 893) that presented in the 4–24-h window did not identify any significant differences in gender. However, the included population was significantly younger (median of 71 versus 75), with a lower median NIHSS (3 versus 4), as demonstrated in Table 1. Since the imaging of patients in this study was not performed for acute treatment purposes, it is possible that patients who were younger with less severe deficits received earlier imaging for logistical reasons (such as coordination of care) and thus were more likely to meet the inclusion criteria.
Table 1.
Comparison of study population to overall population
| Characteristic | Study population (n=376) | Overall population (n=893) | P |
|---|---|---|---|
| Male:female (%) | 50.8:49.2 | 50.6:49.4 | >0.99* |
| Age (years), median (IQR) | 71 (59-83) | 75 (61.5-85) | 0.01** |
| NIHSS score, median (IQR) | 3 (0-6.25) | 4 (1-11) | <0.0001*** |
*Fisher’s exact test, two-tailed, **Mann-Whitney test, two-tailed, ***Mann-Whitney U-test, two-tailed. Study population n=370, overall population n=875 due to missing NIHSS values. IQR: Interquartile range, NIHSS: National Institutes of Health Stroke Scale
The study population characteristics are detailed in Table 2. The median age of the population was 71 years, and 49% were women. The median NIHSS was 3. The mean PWI lesion volume was 12 ml, mean DWI volume was 8 mL, and median mismatch ratio was 6.16. The mean time from LSN to MRI was 704 min, mean time from symptom discovery to MRI was 445 min, and mean time from midpoint between LSN and discovery to MRI was 565 min.
Table 2.
Characteristics for the study population comparing those with and without a mismatch ratio greater than 1.2
| All patients (n=376) | Mismatch ratio >1.2 (n=156) | Mismatch ratio <1.2 (n=220) | Univariate analysis (P) | Multivariate analysis (P) | Multivariate analysis - excluding NIHSS (P) | |
|---|---|---|---|---|---|---|
| Age, median (IQR) | 71 (26-103) | 72 (26-103) | 70 (26-98) | 0.252 | ||
| Sex, % Female** | 48.93% | 55.79% | 44.09% | 0.030 | 0.068 | 0.042 |
| NIHSS, median (IQR) | 3 (0-35) | 5 (0-32) | 2 (0-35) | <0.001 | <0.001 | |
| PWI lesion volume (mL), mean (SD) | 11.98 (0-211.29) | 26.31 (0.02-211.29) | 1.65 (0-107.51) | |||
| DWI lesion volume (mL), mean (SD) | 7.93 (0-119.77) | 5.96 (0-91.89) | 38.77 (0.22-119.77) | |||
| Mismatch ratio, median (IQR) | 6.16 (0.73-296) | 6.5 (1.21-296) | 0.99 (0.73-1.15) | |||
| Chronic microbleeds | 10.12% | 11% | 9% | 0.15 | ||
| Fazekas score, median | 1 | 2 | 1 | 0.68 | ||
| Time windows | ||||||
| Last normal to MRI (min) | 703.82 (88-1797) | 692.51 | 708.78 | 0.675 | ||
| Symptom discovery to MRI | 444.467 (0-1797) | 391.92 | 479.193 | 0.012 | 0.356 | 0.020 |
| Estimated onset to MRI | 564.49 (0-1797) | 526.60 (0-1797) | 590.02 (88-1570) | 0.095 | 0.610 | 0.155 |
**2 Patients were excluded due to sex not being specified, both had a mm-ratio >1.2. IQR: Interquartile rage, NIHSS: National Institutes of Health Stroke Scale, PWI: Perfusion-weighted imaging, DWI: Diffusion-weighted imaging, MRI: Magnetic resonance imaging
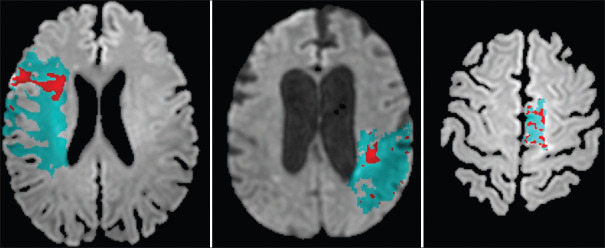
Of the 376 patients reviewed with penumbral imaging, 156 (42%) demonstrated a mismatch ratio >1.2 [Figure 3]. In the univariate analysis, the only time metric significantly associated with the presence of a mismatch was time from symptom discovery to MRI (P = 0.012). Patients with a mismatch presented an average of 1½ h earlier; the chance of having a mismatch dropped by 5% for every hour that passed (odds ratio [OR]: 0.95; confidence interval [CI]: 0.92:0.99). The relationship between time and mismatch ratio is shown in Figure 4. There was a strong association between NIHSS and the presence of a mismatch (P < 0.001). For every point increase in NIHSS, the chance of having a mismatch increased by 8% (CI: 1.08; OR: 1.05:1.13). We also found that women were significantly more likely to have a mismatch than men (55% vs. 45%, P = 0.03). Figure 5 shows the difference in mismatch ratio between men and women in a boxplot.
Figure 3.
Examples of diffusion–perfusion mismatches for three patients are shown. Panel A shows a patient who was imaged 305 min (5 h) from last seen normal and was found to have a mismatch ratio of 3.73. Panel B shows a patient who was imaged 343 min (5.7 h) from last seen normal and was found to have a mismatch ratio of 16.6. Panel C shows a patient who was imaged 271 min (4.52 h) from last seen normal and was found to have a mismatch ratio of 2.80. All three patients presented outside of the 4.5-h time window but had a target that potentially could have benefited from thrombolysis
Figure 4.
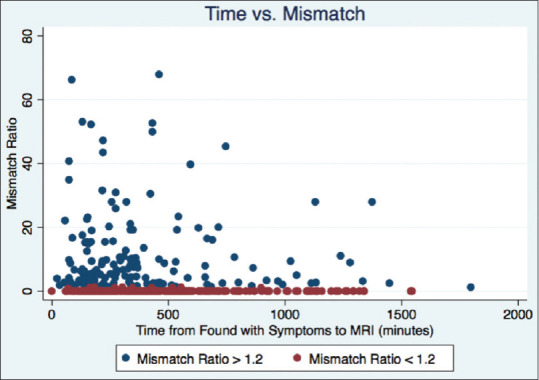
A scatter plot shows the relationship between the time from when the patient was found with symptoms to the time of magnetic resonance imaging (in minutes) and the mismatch ratio. Blue dots have a mismatch ratio >1.2 and red dots are <1.2. Of note, two patients were excluded from the graph due to having very high mismatch ratios (>80) in order to prevent the graph from having too large a scale on the y-axis
Figure 5.
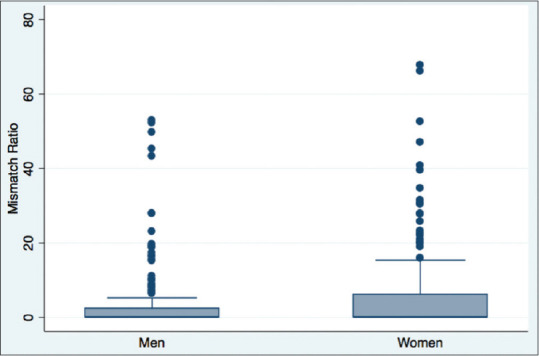
A boxplot shows the difference in mismatch ratios between men and women. Of note, two patients were excluded from the graph due to having very high mismatch ratios (>80, both women) in order to prevent the graph from having too large a scale on the y-axis
In the multivariate analysis, the strong correlation between NIHSS and mismatch was the only association that remained significant. However, when NIHSS was left out of the multivariate analysis, both female gender (P = 0.042) and time from symptom discovery (P = 0.020) were independently associated with the presence of a mismatch [Table 2].
Discussion
In this study, we found that almost half of the patients presenting in the 4–24-h time window had a diffusion–perfusion mismatch on both visual and quantitative assessment. A recent study found that thrombolysis in a similar population is safe and effective up to 9 h after onset.[9] This was further supported by a recent meta-analysis of patients selected for thrombolysis based on penumbral imaging.[10] Our results indicate that there may be a substantial number of patients who are currently not treated due to late arrival at the hospital but yet may benefit from treatment based on the presence of a thrombolytic target. These findings add to the growing recognition that acute stroke treatment should be individualized to patients using multimodal imaging.
The DEFUSE 3 study was the first clinical trial to demonstrate that penumbral imaging could select patients who would benefit from revascularization in a delayed time window.[2] In fact, that study found an unexpected phenomenon, in which patients treated in later time windows did better than those treated early, referred to as the “late window paradox.”[7] Presumably, this occurs due to the presence of robust collateralization of cerebral vessels in some individuals that preserves the penumbra into the late window and also confers better outcome with reperfusion. Although DEFUSE 3 was restricted to patients with LVO who could receive mechanical thrombectomy, earlier studies have suggested that thrombolytic targets could also benefit from an extended time window for treatment.[13]
The MR WITNESS[17] and WAKE-UP[18] studies found that patients presenting with FLAIR-negative stroke could safely and effectively be treated when their time window was unknown. However, the presumption in those studies was that patients with FLAIR-negative stroke are actually in an early time window based on the lack of vasogenic edema, which manifests as T2 signal change on a FLAIR sequence. In those trials, there was no requirement for a thrombolytic target and the word “mismatch” was applied to the difference between cytotoxic edema on DWI and vasogenic edema on FLAIR. Although those trials were aimed at a different population, they are similar to other recent positive clinical trials in that they use multimodal imaging to personalize patient care and expand the population of patients who can be treated.
Our study did identify a time dependence on the presence of a mismatch, which is in line with many previous reports that have demonstrated at the population level that there is a gradual loss of benefit with time.[6] However, this study also draws attention to how the “tissue clock” varies across the population [Figure 4]. Patients in this study with a mismatch had higher NIHSS scores and larger perfusion deficits. This might, in part, be due to some degree of spontaneous recanalization in the patients without a mismatch leading to small perfusion deficits and lower NIHSS scores. We also found that women were more likely to have a mismatch than men. Previous studies have also identified this difference.[19] One study found that penumbra progresses to core faster in men than women but only in a younger cohort.[20] We did not identify any age dependence on the presence of mismatch, but a closer look at the cohort of patients with a mismatch finds the women to have a median age of 78 while the men had a median age of 66. For the cohort without a mismatch, the median age for women was 74 while the median age for men was 69. It has been suggested that estrogen may play a role in protecting the cerebral blood vessels allowing for a more stable penumbra and thus explaining the gender difference, particularly in younger women.[19]
If the 9-h cutoff used for the EXTEND IV trial is applied to our dataset, the number of eligible patients does drop considerably. Of the 376 patients in the study, 148 presented within 9 h from LSN and 56 (38%) of these had a mismatch. Using time of symptom discovery with a 9-h cutoff increases the eligibility to 224 patients, of which 108 (48%) had a mismatch. However, the use of a 9-h cutoff may be arbitrary. There may be a late window paradox for thrombolytic targets similar to that found for endovascular targets.[7] Based on the results of our study, increasing the time window from LSN to 24 h (instead of 9 h) adds an additional 100 patients with a mismatch, nearly tripling the number of patients. Thus, if the EXTEND IV trial had used a time window out to 24 h from LSN, it could have greatly increased the number of patients eligible. However, it is not known if patients presenting in the 9–12-h window would have had the same clinical response to therapy as was seen in the EXTEND IV trial. Further studies are needed.
There are several limitations to our study. Although we use MRI as the first-line triage imaging modality for all of our stroke patients, it is possible that excluding patients who did not have an MRI introduces a bias which affects the generalizability of our findings. Of note, we found that the patients excluded due to lack of imaging were older with higher NIHSS. Because the use of automated software such as RAPID was not part of the management for our population, we do not know if our findings would be different using a third-party software. However, we did employ both visual and quantitative analyses with in-house software, and thus, such differences would likely be minor. This was a retrospective analysis of a dataset collected 5 years ago, and there have been substantive advances in the field of stroke since that time, including routine use of automated software to screen patients. This could change the distribution of patients who go untreated introducing a bias to our dataset. There also may be additional reasons patients are ineligible for treatment besides delay in arrival to the hospital that are not captured in our analysis, such as anticoagulant use or other contradictions.
Conclusions
This review of acute stroke patients presenting outside an approved treatment window who did not receive acute treatment found that almost half (42%) had a target for thrombolysis. In light of recent studies, these findings have implications with regard to patient screening and treatment, adding to the growing recognition that multimodal imaging can expand our treatment options by personalizing patient management.
Financial support and sponsorship
This research was funded by the NINDS intramural research program of the NIH.
Conflicts of interest
There are no conflicts of interest.
References
- 1.Powers WJ, Rabinstein AA, Ackerson T, Adeoye OM, Bambakidis NC, Becker K, et al. Guidelines for the early management of patients with acute ischemic stroke: 2019 Update to the 2018 Guidelines for the Early Management of Acute Ischemic Stroke: A Guideline for Healthcare Professionals From the American Heart Association/American Stroke Association. Stroke. 2019;50:e344–e418. doi: 10.1161/STR.0000000000000211. [DOI] [PubMed] [Google Scholar]
- 2.Bally L, Thabit H, Hartnell S, Andereggen E, Ruan Y, Wilinska ME, et al. Closed-loop insulin delivery for glycemic control in noncritical care. N Engl J Med. 2018;379:547–56. doi: 10.1056/NEJMoa1805233. [DOI] [PubMed] [Google Scholar]
- 3.Kwong JC, Schwartz KL, Campitelli MA, Chung H, Crowcroft NS, Karnauchow T, et al. Acute myocardial infarction after laboratory-confirmed influenza infection. N Engl J Med. 2018;378:345–53. doi: 10.1056/NEJMoa1702090. [DOI] [PubMed] [Google Scholar]
- 4.Saver JL, Fonarow GC, Smith EE, Reeves MJ, Grau-Sepulveda MV, Pan W, et al. Time to treatment with intravenous tissue plasminogen activator and outcome from acute ischemic stroke. JAMA. 2013;309:2480–8. doi: 10.1001/jama.2013.6959. [DOI] [PubMed] [Google Scholar]
- 5.Demaerschalk BM, Kleindorfer DO, Adeoye OM, Demchuk AM, Fugate JE, Grotta JC, et al. Scientific Rationale for the Inclusion and Exclusion Criteria for Intravenous Alteplase in Acute Ischemic Stroke: A Statement for Healthcare Professionals From the American Heart Association/American Stroke Association. Stroke. 2016;47:581–641. doi: 10.1161/STR.0000000000000086. [DOI] [PubMed] [Google Scholar]
- 6.Emberson J, Lees KR, Lyden P, Blackwell L, Albers G, Bluhmki E, et al. Effect of treatment delay, age, and stroke severity on the effects of intravenous thrombolysis with alteplase for acute ischaemic stroke: A meta-analysis of individual patient data from randomised trials. Lancet. 2014;384:1929–35. doi: 10.1016/S0140-6736(14)60584-5. [DOI] [PMC free article] [PubMed] [Google Scholar]
- 7.Albers GW. Late Window Paradox. Stroke. 2018;49:768–71. doi: 10.1161/STROKEAHA.117.020200. [DOI] [PubMed] [Google Scholar]
- 8.Ringleb P, Bendszus M, Bluhmki E, Donnan G, Eschenfelder C, Fatar M, et al. Extending the time window for intravenous thrombolysis in acute ischemic stroke using magnetic resonance imaging-based patient selection. Int J Stroke. 2019;14:483–90. doi: 10.1177/1747493019840938. [DOI] [PubMed] [Google Scholar]
- 9.Ma H, Campbell BC, Parsons MW, Churilov L, Levi CR, Hsu C, et al. Thrombolysis guided by perfusion imaging up to 9 hours after onset of stroke. N Engl J Med. 2019;380:1795–803. doi: 10.1056/NEJMoa1813046. [DOI] [PubMed] [Google Scholar]
- 10.Campbell BC, Ma H, Ringleb PA, Parsons MW, Churilov L, Bendszus M, et al. Extending thrombolysis to 4.5-9 h and wake-up stroke using perfusion imaging: A systematic review and meta-analysis of individual patient data. Lancet. 2019;194:139–47. doi: 10.1016/S0140-6736(19)31053-0. [DOI] [PubMed] [Google Scholar]
- 11.Astrup J, Siesjö BK, Symon L. Thresholds in cerebral ischemia-the ischemic penumbra. Stroke. 1981;12:723–5. doi: 10.1161/01.str.12.6.723. [DOI] [PubMed] [Google Scholar]
- 12.Schlaug G, Benfield A, Baird AE, Siewert B, Lövblad KO, Parker RA, et al. The ischemic penumbra: Operationally defined by diffusion and perfusion MRI. Neurology. 1999;53:1528–37. doi: 10.1212/wnl.53.7.1528. [DOI] [PubMed] [Google Scholar]
- 13.Ogata T, Christensen S, Nagakane Y, Ma H, Campbell BC, Churilov L, et al. The effects of alteplase 3-6 h after stroke in the EPITHET-DEFUSE combined dataset: Post hoc case-control study. Stroke. 2013;44:87–93. doi: 10.1161/STROKEAHA.112.668301. [DOI] [PubMed] [Google Scholar]
- 14.Wouters A, Christensen S, Straka M, Mlynash M, Liggins J, Bammer R, et al. A comparison of relative time to peak and tmax for mismatch-based patient selection. Front Neurol. 2017;8:539. doi: 10.3389/fneur.2017.00539. [DOI] [PMC free article] [PubMed] [Google Scholar]
- 15.Zaro-Weber O, Moeller-Hartmann W, Heiss WD, Sobesky J. Maps of time to maximum and time to peak for mismatch definition in clinical stroke studies validated with positron emission tomography. Stroke. 2010;41:2817–21. doi: 10.1161/STROKEAHA.110.594432. [DOI] [PubMed] [Google Scholar]
- 16.Campbell BC, Mitchell PJ, Kleinig TJ, Dewey HM, Churilov L, Yassi N, et al. Endovascular therapy for ischemic stroke with perfusion-imaging selection. N Engl J Med. 2015;372:1009–18. doi: 10.1056/NEJMoa1414792. [DOI] [PubMed] [Google Scholar]
- 17.Schwamm LH, Wu O, Song SS, Latour LL, Ford AL, Hsia AW, et al. Intravenous thrombolysis in unwitnessed stroke onset: MR WITNESS trial results. Ann Neurol. 2018;83:980–93. doi: 10.1002/ana.25235. [DOI] [PMC free article] [PubMed] [Google Scholar]
- 18.Thomalla G, Simonsen CZ, Boutitie F, Andersen G, Berthezene Y, Cheng B, et al. MRI-guided thrombolysis for stroke with unknown time of onset. N Engl J Med. 2018;379:611–22. doi: 10.1056/NEJMoa1804355. [DOI] [PubMed] [Google Scholar]
- 19.Dula AN, Luby M, King BT, Sheth SA, Magadán A, Davis LA, et al. Neuroimaging evolution of ischemia in men and women: An observational study. Ann Clin Transl Neurol. 2019;6:575–85. doi: 10.1002/acn3.733. [DOI] [PMC free article] [PubMed] [Google Scholar]
- 20.Gokcay F, Arsava EM, Baykaner T, Vangel M, Garg P, Wu O, et al. Age-dependent susceptibility to infarct growth in women. Stroke. 2011;42:947–51. doi: 10.1161/STROKEAHA.110.603902. [DOI] [PMC free article] [PubMed] [Google Scholar]


