

To the Editor,
Previous studies suggested that several recovered COVID‐19 patients may still be virus carriers after discharge from the hospital. 1 , 2 Few observational follow‐up studies had been reported. We identified a series of redetectable positive subjects from recovered mild patients.
We prospectively collected 144 hospitalized COVID‐19 patients treated at Wuhan Fangcang Hospital from February 2, 2020 to February 24, 2020. According to the guideline published by the National Health Commission of China, 3 discharge criteria were: (i) no fever more than 3 days; (ii) respiratory symptoms improved significantly; (iii) acute exudative lesions diminished by imaging examination; (iv) two consecutive negative detection of SARS‐CoV‐2 by respiratory tract samples with more than 24‐h interval. Every patient discharged was required strict 14 days isolation and RNA retest (Fluorescence quantitative polymerase chain reaction; Applied Biosystems) every 3 weeks. The epidemiological, laboratorical, and imaging data were collected and presented with a median (interquartile range [IQR]) or mean ± standard deviation. The last follow‐up date is July 20, 2020.
Five patients were transferred to a tertiary hospital for further treatment because of severe anemia, acute myocardial infarction, refractory hypoxemia, and gross hematuria. Twenty‐two cases were lost follow‐up or did not underwent RNA retest. The majority of the remaining 117 subjects were female (58.1%), with a median age of 49.00 years (IQR: 42.00–59.00; Table 1). Mean values of blood oxygen saturation upon hospitalization were 96.64 ± 1.46%. Routine laboratory examination showed white blood cells at normal range in 114 (97.4%) patients, lymphocytopenia in 28 (23.9%) patients, eosinophilic granulocytopenia in 49 (41.9%) patients, and elevated C‐reactive protein in 30 (25.6%) patients. Fifty‐eight (49.6%) cases demonstrated bilateral ground‐glass opacities and segmental consolidation in initial computed tomography (CT) images. After admission, 97 (82.9%) patients received antiviral drugs therapy, including oseltamivir (75 mg per 12‐h, orally), and arbidol (200 mg three times daily, orally). Sixty‐four (57.3%) patients were administrated Chinese medicine therapy synchronously. The median duration from admission to discharge was 13.0 (10.8–15.0) days.
Table 1.
Clinical characteristics of 117 patients with COVID‐19
| Variables | All patients (n = 117) | Repositive patients (n = 8) | Negative patients (n = 109) | P Value |
|---|---|---|---|---|
| Age (mean ± SD) | 49.32 ± 11.93 | 46.25 ± 17.70 | 49.55 ± 11.48 | .6186 |
| Range | 11–72 | 11–65 | 16–72 | |
| ≤50 | 62 (53.0%) | 4 (50.0%) | 58 (53.2%) | |
| 50–60 | 32 (27.4%) | 3 (37.5%) | 29 (26.6%) | |
| 60–70 | 22 (18.8%) | 1 (12.5%) | 21 (19.3%) | |
| 70–80 | 1 (0.9%) | 0 (0.0%) | 1 (0.9%) | |
| >80 | 0 (0.0%) | 0 (0.0%) | 0 (0.0%) | |
| Gender | .1695 | |||
| Men | 49 (41.9%) | 1 (12.5%) | 48 (44.0%) | |
| Women | 68 (58.1%) | 7 (87.5%) | 61 (56.0%) | |
| Marriage | .5874 | |||
| Married | 55 (47.0%) | 5 (62.5%) | 50 (45.9%) | |
| Unmarried | 62 (53.0%) | 3 (37.5%) | 59 (54.1%) | |
| Occupation | .8611 | |||
| Farmer | 0 (0.0%) | 0 (0.0%) | 0 (0.0%) | |
| In service | 68 (58.1%) | 4 (50.0%) | 64 (58.7%) | |
| Unemployed | 10 (8.5%) | 1 (12.5%) | 9 (8.3%) | |
| Retired | 39 (33.3%) | 3 (37.5%) | 36 (33.0%) | |
| SaO2 on admission (mean ± SD) | 96.64 ± 1.46% | 97.13 ± 0.99% | 96.61 ± 1.49% | .2013 |
| Symptoms onset | ||||
| Fever | 75 (64.1%) | 6 (75.0%) | 69 (63.3%) | .7765 |
| Cough | 20 (17.1%) | 2 (25.0%) | 18 (16.5%) | .8974 |
| Myalgia | 7 (6.0%) | 1 (12.5%) | 6 (5.5%) | .3992 |
| Fatigue | 12 (10.3%) | 0 (0.0%) | 12 (11.0%) | 1.0000 |
| Dyspnea | 10 (8.5%) | 0 (0.0%) | 10 (9.2%) | 1.0000 |
| Expectoration | 0 (0.0%) | 0 (0.0%) | 0 (0.0%) | 1.0000 |
| Headache | 2 (1.7%) | 0 (0.0%) | 2 (1.8%) | 1.0000 |
| Chest distress | 9 (7.7%) | 0 (0.0%) | 9 (8.3%) | 1.0000 |
| Diarrhea | 4 (3.4%) | 0 (0.0%) | 4 (3.7%) | 1.0000 |
| Vomit | 1 (0.9%) | 1 (12.5%) | 0 (0.0%) | .0684 |
| Dizziness | 1 (0.9%) | 1 (12.5%) | 0 (0.0%) | .0684 |
| Rhinorrhea | 1 (0.9%) | 0 (0.0%) | 1 (0.9%) | 1.0000 |
| More than one symptoms | 27 (23.1%) | 1 (12.5%) | 26 (23.9%) | .7635 |
| Asymptomatic | 8 (6.8%) | 0 (0.0%) | 8 (7.3%) | 1.0000 |
| Combined chronic diseases | ||||
| Diabetes | 6 (5.1%) | 1 (12.5%) | 5 (4.6%) | .3525 |
| Hypertension | 15 (12.8%) | 1 (12.5%) | 14 (12.8%) | 1.0000 |
| Coronary heart disease | 2 (1.7%) | 0 (0.0%) | 2 (1.8%) | 1.0000 |
| Cerebrovascular diseases | 4 (3.4%) | 0 (0.0%) | 4 (3.7%) | 1.0000 |
| COPD | 3 (2.6%) | 0 (0.0%) | 3 (2.8%) | 1.0000 |
| Malignant tumor | 2 (1.7%) | 0 (0.0%) | 2 (1.8%) | 1.0000 |
| Chronic renal failure | 1 (0.9%) | 0 (0.0%) | 1 (0.9%) | 1.0000 |
| Primary liver disease | 3 (2.6%) | 0 (0.0%) | 3 (2.8%) | 1.0000 |
| Other comorbidities | 14 (12.0%) | 1 (12.5%) | 13 (11.9%) | 1.0000 |
| Imaging manifestations | ||||
| Ground glass opacity | 106 (90.6%) | 8 (100.0%) | 98 (89.9%) | 1.0000 |
| Reticular opacity | 17 (14.5%) | 1 (12.5%) | 16 (14.7%) | 1.0000 |
| Local consolidation | 39 (33.3%) | 2 (25.0%) | 37 (33.9%) | .8970 |
| Linear opacity | 10 (8.5%) | 1 (12.5%) | 9 (8.3%) | .5220 |
| Septal thickening | 18 (15.4%) | 1 (12.5%) | 17 (15.6%) | 1.0000 |
| Normal CT scan | 3 (2.6%) | 0 (0.0%) | 3 (2.8%) | 1.0000 |
| Unilateral | 56 (47.9%) | 4 (50.0%) | 52 (47.7%) | 1.0000 |
| Bilateral | 58 (49.6%) | 4 (50.0%) | 54 (49.5%) | 1.0000 |
| Laboratory test on admission | ||||
| White blood cell count (×109/L) | 5.30 (4.20–6.13) | 4.81 (4.20–5.55) | 5.30 (4.20–6.13) | .6835 |
| Neutrophil count (×109/L) | 3.30 (2.56–4.43) | 2.89 (2.69–3.46) | 3.34 (2.56–4.43) | .6631 |
| Eosinophilic granulocyte (×109/L) | 0.01 (0.00–0.02) | 0.04 (0.01–0.10) | 0.01 (0.00–0.02) | .4693 |
| Lymphocyte count (×109/L) | 1.21 (0.98‐1.53) | 1.59 (1.25–23.66) | 1.19 (0.97–1.50) | .3887 |
| Platelet count (×109/L) | 171.00 (136.75–196.75) | 179.00 (136.75–222.50) | 171.00 (138.00–195.00) | .8234 |
| C‐reactive protein (mg/L) | 12.24 (5.20–39.86) | 4.79 (2.45–7.14) | 13.29 (5.57–42.80) | .0119 |
| Laboratory test after treatment | ||||
| White blood cell count (×109/L) | 4.92 (4.43–5.64) | 4.88 (4.72–5.06) | 4.94 (4.42–5.70) | .1648 |
| Neutrophil count (×109/L) | 2.92 (2.47–3.60) | 3.24 (2.90–3.32) | 2.91 (2.47–3.68) | .8477 |
| Eosinophilic granulocyte (×109/L) | 0.08 (0.05‐0.11) | 0.07 (0.05–0.09) | 0.08 (0.05–0.12) | .0573 |
| Lymphocyte count (×109/L) | 1.65 (1.22–1.90) | 1.35 (1.11–1.49) | 1.65 (1.22–1.91) | .1070 |
| Platelet count (×109/L) | 272.00 (228.00–323.00) | 261.00 (227.00–267.00) | 273.50 (229.50–323.75) | .2839 |
| Treatment modalities | ||||
| Antiviral drugs | 97 (56.4%) | 4 (50.0%) | 62 (56.9%) | .9924 |
| Antibacterial drugs | 29 (24.8%) | 1 (12.5%) | 28 (25.7%) | .6820 |
| Traditional Chinese medicine | 64 (54.7%) | 5 (62.5%) | 59 (54.1%) | .9273 |
| Inhalation of high flow oxygen | 14 (12.0%) | 2 (25.0%) | 12 (11.0%) | .2446 |
Abbreviation: COPD, chronic obstructive pulmonary disease.
Eight patients (6.8%) showed a re‐positive SARS‐CoV‐2 test after a median 12.5 (11.8–16.3) days since discharge (Figure 1). All of them denied contact with suspected patients or anybody with fever symptoms during follow‐up period. Seven of them were asymptomatic and follow‐up CT showed no obvious change with the previous manifestation. One 57‐year‐old female patient demonstrated mild fatigue and chest distress 28 days after discharge. Unenhanced follow‐up CT showed small areas of ground‐glass opacities in the left lung and small nodules in the right lung. She received additional antiviral treatment and was in stable condition until the last follow‐up. No surrounding persons or family members were infected. For the eight re‐positive patients, we compared the first time positive C t (cycle threshold) value upon hospitalization and second time positive C t value after discharge, the difference was not significant (30.91 ± 2.50 vs. 30.29 ± 1.70, p = .570). Laboratory examination showed that the values of C‐reactive protein in re‐positive patients were lower than the other 109 patients (p = .012).
Figure 1.
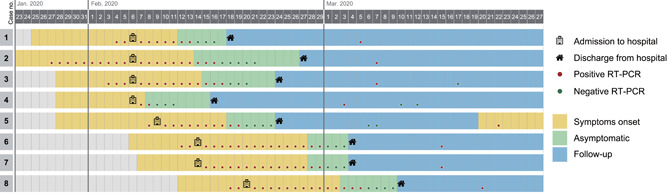
Timeplot of eight re‐positive patients from symptoms onset to discharge. During the follow‐up period, one patient demonstrated mild discomfort, the other seven patients were asymptomatic. RT‐PCR, reverse transcription‐polymerase chain reaction
At present, there are relatively few reports about the redetectable SARS‐CoV‐2 among rehabilitation patients. According to a previous report by Lan et al., 1 four recovered medical professionals demonstrated a positive result during repeated reverse transcription‐polymerase chain reaction (RT‐PCR) test. No typical symptoms or changes in CT images were observed. In our study, 6.8% of patients demonstrated re‐positive RT‐PCR test results 10–28 days after discharge. One patient had mild symptoms and new inflammatory exudative lesions by a follow‐up CT examination. However, no further transmission to surrounding persons had been observed. Although the initial C t value was not obviously different from the subsequent C t value among re‐positive patients, whether the virus load during the follow‐up period was lower or not need more prospective clinical research. In addition, false‐negative may be inevitable as different size and depth of taking samples can affect the accuracy of the oropharyngeal swab. In contrast, the positive rate of RT‐PCR tests through alveolar lavage fluid may be higher. However, this method is invasive and cannot be widely performed in clinical practice. In our opinion, both qualities of respiratory samples and the variability of technique sensitivity can be attributed to the influence factors of re‐positivity.
We noted that the values of C‐reactive protein in re‐positive patients were comparatively lower. Due to the limited sample size, if a relatively weaker inflammatory response might give rise to virus residual in the lungs is still unclear. In addition, redetection of viral RNA by PCR does not imply viral reactivation. Most patients will produce antibodies 10 days or later after infection. 4 Due to the gradual presence of antibody immunoglobulin G, 5 most re‐positive patients will not demonstrate a relapse of symptoms. Further virological and immunological studies related to re‐positive patients need to be conducted to explore the SARS‐CoV‐2 infection mechanism.
CONFLICT OF INTERESTS
The authors declare that there are no conflict of interests.
AUTHOR CONTRIBUTIONS
Concept and design were contributed by Junjie Hu, Shi Li, Yan Wu, and Fei Tian. Acquisition, analysis, or interpretation of data were contributed by Junjie Hu, Shi Li, Yan Wu, and Zhiguo Xiong. Drafting of the manuscript was contributed by Fei Tian and Junjie Hu. Statistical analysis was contributed by Fei Tian, Lichong Gong, and Yichen Yang. Administrative, technical, or material support was contributed by Junjie Hu and Fei Tian.
ACKNOWLEDGMENTS
The authors thank all patients included in this study. They appreciate all medical works and coordinators who are fighting COVID‐19 around the world. Their expertise, humanity, and devotion are important and respectable.
REFERENCES
- 1. Lan L, Xu D, Ye G, et al. Positive RT‐PCR test results in patients recovered from COVID‐19. JAMA. 2020;323:1502–1503. 10.1001/jama.2020.2783 [DOI] [PMC free article] [PubMed] [Google Scholar]
- 2. Xing Y, Mo P, Xiao Y, Zhao O, Zhang Y, Wang F. Post‐discharge surveillance and positive virus detection in two medical staff recovered from coronavirus disease 2019 (COVID‐19), China, January to February 2020. Euro Surveill. 2020;25(10):2000191. 10.2807/1560-7917.ES.2020.25.10.2000191 [DOI] [PMC free article] [PubMed] [Google Scholar]
- 3. National Health Commission of China . Guidance for diagnosis and treatment of novel coronavirus pneumonia. National Health Commission of China. 2020. http://www.nhc.gov.cn/yzygj/s7653p/202002/8334a8326dd94d329df351d7da8aefc2/files/b218cfeb1bc54639af227f922bf6b817.pdf
- 4. To KKW, Tsang OTY, Leung WS, et al. Temporal profiles of viral load in posterior oropharyngeal saliva samples and serum antibody responses during infection by SARS‐CoV‐2: an observational cohort study. Lancet Infect Dis. 2020;20:565–574. 10.1016/S1473-3099(20)30196-1 [DOI] [PMC free article] [PubMed] [Google Scholar]
- 5. Duan K, Liu B, Li C, et al. Effectiveness of convalescent plasma therapy in severe COVID‐19 patients. Proc Natl Acad Sci U S A. 2020;117:9490–9496. 10.1073/pnas.2004168117 [DOI] [PMC free article] [PubMed] [Google Scholar]