

Abstract
Background
Microbiology laboratory results are complex and cumbersome to review. We sought to develop a new review tool to improve the ease and accuracy of microbiology results review.
Methods
We observed and informally interviewed clinicians to determine areas in which existing microbiology review tools were lacking. We developed a new tool that reorganizes microbiology results by time and organism. We conducted a scenario-based usability evaluation to compare the new tool to existing legacy tools, using a balanced block design.
Results
The average time-on-task decreased from 45.3 min for the legacy tools to 27.1 min for the new tool (P < .0001). Total errors decreased from 41 with the legacy tools to 19 with the new tool (P = .0068). The average Single Ease Question score was 5.65 (out of 7) for the new tool, compared to 3.78 for the legacy tools (P < .0001). The new tool scored 88 (“Excellent”) on the System Usability Scale.
Conclusions
The new tool substantially improved efficiency, accuracy, and usability. It was subsequently integrated into the electronic health record and rolled out system-wide. This project provides an example of how clinical and informatics teams can innovative alongside a commercial Electronic Health Record (EHR).
Keywords: usability, microbiology, test results, infectious disease, user interface
Introduction
Microbiology laboratory data is essential to the diagnosis and treatment of infectious diseases. Accurate, timely, and complete microbiology results guide selection of antimicrobial therapy, enable detection of disease outbreaks, and can help prevent the development and spread of antibiotic-resistant microbes.1 Unlike most other clinical lab tests that return a single numeric quantity as the result and can be easily graphed and trended over time,2 microbiology laboratory tests are often a series of sequential actions, where a step taken during testing may be dependent upon the outcome of previous steps. Compared to typical clinical tests, the type and number of results reported with microbiology tests is unpredictable and often unknown at the start of testing. This makes management and categorization of microbiology results more complex than other laboratory results.3 Adding to the complexity, the reported results for a single sample usually include both quantitative and qualitative data: the source of the sample, names and quantity of organisms observed, method of organism identification, names of antibiotics tested for each organism, and both a categorical and quantitative susceptibility result for each antibiotic and organism pair. Thus, the high number of results, their interrelatedness, the variety of data types, and the variation in time to finalization (due to specific microbial characteristics in culture) pose special challenges in the reporting of microbiology lab results. Effectively managing these reporting difficulties becomes increasingly important as the quantity of tests, and the resultant hazard for information overload and error, increases.4
Because of its complexity, the task of reviewing microbiology data is time consuming and error prone,1,5,6 and we have routinely heard concerns from our hospital’s Infectious Disease (ID) clinicians about the cumbersome nature of current tools.7 Our EHR does not attempt to codify microbiology data at all, instead displaying it in textual form using a document paradigm. This prevents searching, grouping, and other useful functions, shifting most of the cognitive burden of summarization to the clinician.4 Although much work has been done in the area of infection control and results review, and advanced software exists for use by infection control practitioners such as Sentri7, TheraDoc, and Vigilanz, these tools are often not integrated in the EHR for routine use by doctors for the purposes of lab result review, and do not represent the reality of tools available at our institution. We hypothesized that relatively simple improvements in the presentation and organization of microbiology data could significantly improve ease of use, usability, accuracy, and efficiency of microbiology data review in our EHR. Despite its complexity, microbiology data does have an underlying hierarchical structure of specimens, organisms, tests, and susceptibilities. The typical document paradigm is a missed opportunity to leverage the underlying hierarchy of microbiology data, which, if preserved, can facilitate electronic summarization and decision support. In this manuscript, we describe and evaluate a new tool for reviewing microbiology data. We constructed the tool alongside our EHR and, after demonstrating its effectiveness, integrated it into the system. We believe this example of innovation in a commercial EHR has broad applicability.
Methods
Baseline Microbiology Results Display
Figure 1 is a screenshot from the Partners HealthCare System (PHS) Longitudinal Medical Record (LMR), an outpatient EHR system. The data come from an actual patient, with dates shifted and identifying information obscured. Each microbiology report is a text document, which must be viewed individually. To review the complete microbiological history of a patient with a complex infection history, a clinician might have to review hundreds of individual reports to identify key results.
Figure 1.

Microbiology notes as displayed by the LMR.
Intervention Microbiology Results Display
Figures 2 and 3 show the main views of the microbiology viewer (MV) application we developed. Figure 2 shows a tabular view that aggregates all microbiology and ID-related test results and supports searching, sorting, and filtering. These views were motivated by Miller and Baddeley’s theories of short-term and working memory, which explain that memory resources are limited and shared between storage tasks and processing tasks, so enabling users to offload any of those tasks to the system may make them more successful.8,9 Organizing information in one tabular view should free up memory resources for the user, improving usability. It should also decrease the amount of recall users must do to trend results over time, in accordance with Nielsen’s usability heuristics.10 The main finding (organism grown, test result, etc.) is shown directly in the tabular view, though users can also click each result to see a detailed report in the traditional format. These views are designed to help users quickly review microbiology data, spot trends, and identify key results. Users can also browse the results by organism (Figure 3), allowing for review of all organisms observed in a patient’s microbiology testing history.
Figure 2.
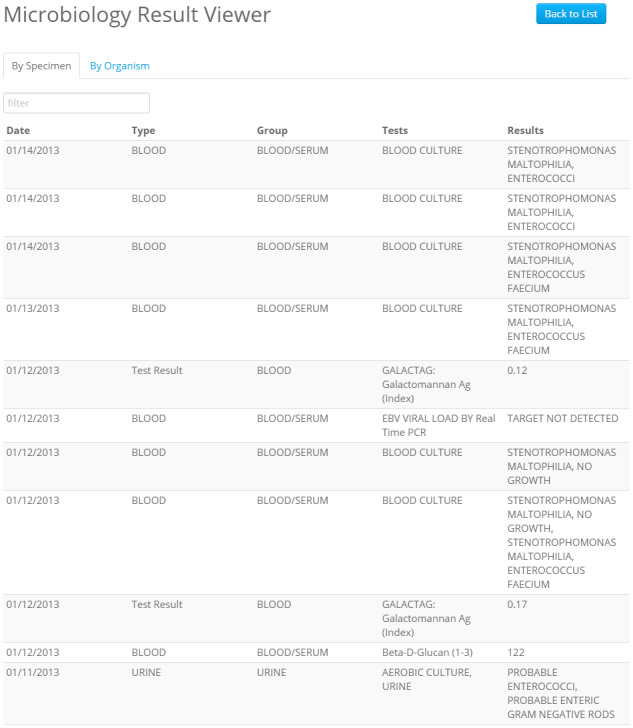
Microbiology laboratory results by test specimen, as displayed by the Micro Viewer. Results can be searched and sorted.
Figure 3.

Microbiology results summarized by organism, as displayed by the Micro Viewer.
The MV system was written using Java servlets, with the front end implemented using Bootstrap and jQuery. The tool was designed to be fast and responsive on computers and mobile devices. The tool uses web services to access microbiology and ID test results and integrates with the Partners enterprise master patient index to facilitate patient search and review of patient records by team and service areas. The tool is hosted behind the Partners firewall and uses the Lightweight Directory Access Protocol for authentication, ensuring that only authorized users can access clinical information.
We iteratively improved and refined the MV based on clinical use by 2 of the authors (GZ and DS), as well as feedback from ID fellows who accessed the tool during clinical rotations. After several rounds of iteration, when all known bugs had been eliminated and the tool seemed to be potentially useful, we completed a formal evaluation.
Evaluation
We conducted a scenario-based assessment to evaluate the usability, efficiency, and accuracy of the MV System. Because it is difficult to construct realistic microbiology data on test patients,11 we utilized the records of 8 deceased patients (with Institutional Review Board permission) who had recently been cared for as inpatients on the ID service at Brigham and Women's Hospital (BWH) to conduct usability testing. The patients were chosen by one of the authors (GZ) who is an ID physician. For each of the patients, we identified a set of realistic clinical questions that a treating provider might want to answer (described in Supplementary Appendix C). For example, one scenario involved an adult patient with refractory acute myelogenous leukemia and chronic neutropenia who was suspected to have an invasive fungal infection. The scenario asked the participant to find the peak (1,3)-β-d-Glucan (Fungitell®) assay result (a test which identifies a product produced by many pathogenic fungi in the blood) and to describe and give the dates of all positive blood culture results during a 4-month period.
We recruited 16 subjects in May and June of 2015 by emailing the ID attending physicians and fellows at BWH and PHS. Subjects were informed that participation was voluntary. After completion of the study, subjects were given a $50 gift card.
To enable fair comparison of the MV system and legacy tools, we used a block allocation design, shown in Table 1, which accounts for and mitigates learning effects (when participates learn to complete scenarios more quickly over time) and differences in scenario difficulty. Each subject completed all 8 scenarios, using the legacy tool of their choice for half of the scenarios and the MV for the other half. Within each of these scenario-and-tool blocks, the order of the scenarios was varied, so that half the subjects completed 4 of the scenarios during the first period, and the remaining half of the subjects completed the other 4 scenarios during the first period.
Table 1.
Balanced Block Design Controls for Effects of Tool and Learning Effects
| Block | Scenarios completed in Period 1 | Tool used in Period 1 | Scenarios completed in Period 2 | Tool used in Period 2 |
|---|---|---|---|---|
| 1 (Participants 1, 5, 9, 13) | 1, 3, 5, 7 | MV | 2, 4, 6, 8 | Legacy |
| 2 (Participants 2, 6, 10, 14) | 1, 3, 5, 7 | Legacy | 2, 4, 6, 8 | MV |
| 3 (Participants 3, 7, 11, 15) | 2, 4, 6, 8 | MV | 1, 3, 5, 7 | Legacy |
| 4 (Participants 4, 8, 12, 16) | 2, 4, 6, 8 | Legacy | 1, 3, 5, 7 | MV |
All usability sessions were recorded with Morae usability testing software (TechSmith, Lansing, MI). For each scenario, the length of time to complete the scenario (“time-on-task”) was recorded. A task was considered complete when the participant said they were done with the task, even if the participant’s answer was incorrect. Accuracy was determined by comparing each answer to a known correct answer. After each scenario, the participant was asked the Single Ease Question (SEQ), “Overall, how difficult or easy was the task to complete?” with allowed answers ranging from 1 (“Very Difficult”) to 7 (“Very Easy”).12 After the completion of all 8 scenarios, the participants also completed the System Usability Scale (SUS), a standard, reliable usability assessment with 10 questions.13 The project was reviewed and approved by the PHS Human Subjects Committee.
We used R (R Foundation for Statistical Computing, Vienna, Austria) to conduct the statistical analysis. We used linear regression to estimate the difference between MV and non-MV use, controlling for study period, and used generalized estimating equations to account for by-scenario repeated measures for those measurements which required it. The Morae session recordings were reviewed and coded by the usability expert (PN) and research assistant (SA), and key system features which appeared to drive observed differences in performance were identified.
Results
Participants
A total of 8 fellows and 8 attending physicians completed the study. One additional subject departed midway through testing and was excluded from the analysis as he had not completed any scenarios using the comparator tool. Thirteen of the subjects had never previously used the MV system, while 3 had at least some experience with it (though it was not released for routine use, it was accessible during the evaluation). Because the participants were ID trainees or clinicians at PHS, all had considerable experience (on average 8 years of experience) with the legacy tools for reviewing microbiology data.
Timing
The columns labeled “Average Time-On-Task” in Table 2 compare the average time-on-task for each of the 8 scenarios using the legacy tools to the average time-on-task using the MV. All 8 scenarios were completed faster on average using the MV than the legacy tools, with the largest gains seen for the longest and most complex scenarios. The improvement in time was statistically significant for 5 of the 8 scenarios. The average total time to complete the 8 scenarios using the legacy tools was 45.3 min, while the average time to complete them using the MV was 27.1 min (P < .0001).
Table 2.
Comparison Between the Legacy Tools and the MV are Shown for 3 Metrics: Time-on-task, Accuracy, and SEQ Score
| Average time-on-task (min) |
Average Accuracy (Out of 100%) |
Average SEQ Score (1 = Very Difficult, 7 = Very Easy) |
||||
|---|---|---|---|---|---|---|
| Task | Legacy tool | Micro viewer | Legacy tool (%) | Micro viewer (%) | Legacy tool | Micro viewer |
| Scenario 1 | 4.06 | 3.27 | 100 | 100 | 3.88 | 6.88*** |
| Scenario 2 | 8.08 | 5.12 | 100 | 100 | 4.50 | 4.63 |
| Scenario 3 | 8.05 | 4.39*** | 63 | 70 | 3.13 | 6.88*** |
| 3.25 | 5.63** | |||||
| Scenario 4 | 4.68 | 2.74** | 100 | 100 | 4.50 | 5.38 |
| Scenario 5 | 5.44 | 2.16*** | 94 | 97 | 3.38 | 6.38*** |
| Scenario 6 | 4.89 | 2.24*** | 75 | 97* | 3.86 | 5.13 |
| Scenario 7 | 6.10 | 4.97 | 63 | 92** | 2.75 | 4.88* |
| Scenario 8 | 3.96 | 2.24* | 71 | 79 | 4.75 | 5.13 |
| All Scenarios | 45.3 | 27.1*** | 82 | 91*** | 3.78 | 5.65*** |
For each metric, a pooled analysis across all scenarios is also shown in the last row. The SEQ score was measured in 2 parts for scenario 3, and these scores are shown separately.
Difference between tools is significantly non-zero at: *P < .05, **P < .01, ***P < .001.
Accuracy
The columns labeled “Average Accuracy” in Table 2 show the average accuracy for each scenario and tool. The 8 scenarios had a total of 29 clinical questions, 18 of which were answered correctly by all 16 participants in the study. One question was missed by all but one participant, likely because it was overly ambiguous: the question asked for a patient’s peak serum human herpesvirus-6 viral load, but most participants reported a higher value found in bronchoalveolar lavage specimen, which was impossible to distinguish from a serum sample in the MV and very difficult to distinguish in the legacy tools. Collectively, participants made 41 errors with the legacy tools and only 19 errors with the MV. On average, participants made the same number of errors or fewer in every scenario using the MV than they did using the legacy tools, although the effect of the tool was only statistically significant in 2 of the scenarios and in the pooled analysis combining all scenarios (P = .0068).
Ease of Use and Usability
The columns labeled “Average SEQ Score” in Table 2 show the average SEQ score reported by users for each scenario and tool. Scenario 3 was longer than the other scenarios, so participants were asked the SEQ separately for the first and second halves of the scenario. Higher scores indicate greater ease completing the task. The average ease score was 5.65 (out of 7) for the MV, compared to 3.78 for the legacy tool (P < .0001).
Supplementary Appendix A shows the average SUS score across all participants in the study. The total SUS score is a weighted sum of the scores for all questions on the 10-question assessment and provides a percentile rank of usability. The average SUS score across participants for the MV was 88, which is “Excellent”14 and compares very favorably to the average SUS score of 68 from a broad sample of (mostly nonclinical) applications.9
Design Features that Impacted Usability
Based on review of the Morae session recordings, a few design features were identified that may have impacted the usability results of each system. These features (described in Supplementary Appendix B) included: capability of a system to automatically parse and display results on the main page; ability to filter results using keywords; preview of full lab report when a result is clicked; and number of results displayed on the main page along with the method of navigating to view more results.
Discussion
Our results strongly suggest that the MV represents a substantial improvement compared to existing tools. The major differences between the MV and legacy tools were automatic summarization so that multiple results could be displayed on one page, and the ability to filter out results. Both features were designed to decrease the amount of cognitive load and recall required of users to find relevant results and trend results over time, which theory predicts should increase processing speed and decrease errors.8–10 Indeed, compared to legacy tools, users were more satisfied with the MV, completed clinical scenarios faster, and made fewer errors. In fact, response to the tool was so positive that many study subjects began using the tool clinically after participating in the study, even before we had released it to general availability, and it spread quickly through the ID and other internal medicine services at BWH. Based on the results of the study, PHS rebuilt the tool to meet enterprise standards and integrated it into the LMR and Epic (the current EHR at PHS) as an embedded web application. It is now frequently used throughout the organization. Although Epic has a different results review interface than LMR did, the MV continues to be very popular with users at our institution.
The design and results of our study also have an important implication for innovation in commercial EHRs. We built the initial MV entirely outside of our legacy EHR systems, using web services to fetch coded laboratory data from our clinical data repository, enable patient search, and support user authentication and access control. Our ability to do this work was enabled by Partners’ significant investment in service-oriented architecture15 and provides an example for how clinical and informatics teams can innovative alongside a commercial EHR. This is the same vision as recent efforts like Substitutable Medical Applications, Reusable Technologies (SMART)16 and Fast Healthcare Interoperability Resources (FHIR).17 Increasing adoption of these technologies and architectures will enable the creation of other applications similar to ours, which can be constructed without direct impact on the production EHR, tested, refined, and integrated back into the main EHR system. In future work, we hope to conduct a more detailed feature-by-feature evaluation of the tool, and to continue to enhance and study it.
Conclusion
Microbiology data is complex and cumbersome to review. Creating a system that automatically aggregates and organizes this data helped clinicians more efficiently and accurately analyze the data in a rigorous usability test. Based on the results, the tool was deployed widely and is now used frequently.
Funding
Development of the microbiology tool was supported by the Partners-Siemens Research Council (PSRC) an internal research funding program at Partners HealthCare. The PSRC was not involved in this evaluation, and the content of this paper is solely the responsibility of the authors and does not necessarily represent the official views of the PSRC.
Competing interest
None.
Contributors
AW had full access to all the data in the study and takes responsibility for the integrity of the data and accuracy of the data analysis. AW and GZ are responsible for study concept and design. KK, DM, DS, TH, FLM, GZ, and SA contributed to scenario development and validation. PN and TH conducted the usability evaluations. SA, AW, and PN performed the data analysis. SA and AA conducted beta testing. AW wrote the manuscript. All authors provided critical revisions of the manuscript for important intellectual content.
SUPPLEMENTARY MATERIAL
Supplementary material is available at Journal of the American Medical Informatics Association online.
Supplementary Material
ACKNOWLEDGMENTS
We appreciate the encouragement and feedback of Paul Sax, MD, clinical director of the BWH Division of Infectious Diseases, and the participation of the Partners HealthCare Clinical Data Repository team, who led development and implementation of the production version of the MV.
References
- 1. Rhoads DD, Sintchenko V, Rauch CA, Pantanowitz L. Clinical microbiology informatics. Clin Microbiol Rev 2014; 274: 1025–1047. [DOI] [PMC free article] [PubMed] [Google Scholar]
- 2. Sittig DF, Murphy DR, Smith MW, Russo E, Wright A, Singh H. Graphical display of diagnostic test results in electronic health records: a comparison of 8 systems. J Am Med Inform Assoc 2015; 224: 900–904. [DOI] [PMC free article] [PubMed] [Google Scholar]
- 3. Ackerman VP, Pritchard RC, Groot Obbink DJ, Bradbury R, Lee A. Reporting practices of microbiology laboratories. J Clin Pathol 1980; 339: 830–8355. [DOI] [PMC free article] [PubMed] [Google Scholar]
- 4. Feblowitz JC, Wright A, Singh H, Samal L, Sittig DF. Summarization of clinical information: a conceptual model. J Biomed Inform 2011; 444: 688–699. [DOI] [PubMed] [Google Scholar]
- 5. Wilkerson ML, Henricks WH, Castellani WJ, Whitsitt MS, Sinard JH. Management of laboratory data and information exchange in the electronic health record. Arch Pathol Lab Med 2015; 1393: 319–327. [DOI] [PubMed] [Google Scholar]
- 6. Willard KE, Connelly DP, Johnson JR. Radical improvements in the display of clinical microbiology results: a Web-based clinical information system. Am J Med 1996; 1015: 541–549. [DOI] [PubMed] [Google Scholar]
- 7. Sax PE. Solve this problem please — microbiology results in electronic medical records. NEJM Journal Watch: 2013. http://blogs.jwatch.org/hiv-id-observations/index.php/solve-this-problem-please-microbiology-results-in-electronic-medical-records/. (accessed 2018 March 8). [Google Scholar]
- 8. Baddeley A. Working memory: the interface between memory and cognition. J Cogn Neurosci 1992; 43: 281–288. [DOI] [PubMed] [Google Scholar]
- 9. Miller GA. The magical number seven, plus or minus two: some limits on our capacity for processing information. Psychol Rev 1956; 632: 81. [PubMed] [Google Scholar]
- 10. Nielsen J. 10 Usability Heuristics for User Interface Design Nielsen Norman Group; 1995. www.nngroup.com/articles/ten-usability-heuristics/ (accessed 2018 March 8). [Google Scholar]
- 11. Wright A, Aaron S, Sittig DF. Testing electronic health records in the “production” environment: an essential step in the journey to a safe and effective health care system. J Am Med Inform Assoc 2017;241:188–192. [DOI] [PMC free article] [PubMed] [Google Scholar]
- 12. Sauro J, Dumas J. Comparison of three one-question, post-task usability questionnaires. In Proceedings of the SIGCHI Conference on Human Factors in Computing Systems. ACM: Boston, MA; 2009: 1599–1608. [Google Scholar]
- 13. Lewis J, Sauro J. The factor structure of the system usability scale. In: Kurosu M. (eds) Human Centered Design. HCD 2009. Lecture Notes in Computer Science, vol 5619. Springer, Berlin, Heidelberg. [Google Scholar]
- 14. Bangor A, Kortum P, Miller J. Determining what individual SUS scores mean: adding an adjective rating scale. J Usability Stud 2009; 43: 114–123. [Google Scholar]
- 15. Glaser JP. Too far ahead of the IT curve? Harvard Bus Rev 2007; 85 (7–8): 29–33, 190; discussion 36–9. [PubMed] [Google Scholar]
- 16. Mandl KD, Mandel JC, Murphy SN et al. The SMART Platform: early experience enabling substitutable applications for electronic health records. J Am Med Inform Assoc 2012; 194: 597–603. [DOI] [PMC free article] [PubMed] [Google Scholar]
- 17. Health Level Seven International. Fast Healthcare Interoperability Resources. Health Level Seven International; 2016. http://hl7.org/fhir/ (accessed 2018 March 8). [DOI] [PMC free article] [PubMed] [Google Scholar]
Associated Data
This section collects any data citations, data availability statements, or supplementary materials included in this article.