

Abstract
Objectives:
To determine the association between childhood growth prior to the development of celiac disease (CD) and CD autoimmunity (CDA) identified by periodic serological screening.
Study design:
The Diabetes Autoimmunity Study in the Young cohort includes 1979 genetically at-risk children from Denver, Colorado, with annual growth measurements from age nine months until ten years. Between 1993 and February 2019, 120 children developed CDA defined by persistent positive tissue transglutaminase autoantibodies (TGA); among these, 71 met our criteria for CD based on histopathological findings or high TGA levels. Age- and sex-specific z-scores of weight, body mass index (BMI), and height prior to seroconversion were derived using US reference charts as standards. Joint modeling of serial growth measurements was used to estimate adjusted hazard ratios (aHRs) accounting for celiac-associated human leukocyte antigens, early-life feeding practices, and socio-demographics.
Results:
In the first 10 years of life, there were no significant associations between the child’s current weight, BMI and height and the risk of screening-detected CDA or CD, neither was the weight nor BMI velocity associated with CDA or CD as identified by screening (all aHRs approximated 1). Increased height velocity was associated with later CD, but not CDA, development (aHR per 0.01-z score/year, 1.28; 95% confidence interval [CI] 1.18–1.38 and 1.03; 0.97–1.09, respectively).
Conclusions:
In the first 10 years of life, from prospectively collected serial growth measurements, we found no evidence of impaired childhood growth before CD and CDA development as identified through early and periodic screening.
Keywords: Height, weight, body mass index, anthropometric measures
Introduction
Celiac disease (CD) is an autoimmune condition affecting 1% of children worldwide [1]. The human leukocyte antigen (HLA) locus is the major genetic determinant of CD; HLA-DQ2 and/or -DQ8 is considered necessary, but not sufficient, for disease development. In CD, gluten intake leads to small-intestinal villous atrophy. The flattening of small-intestinal mucosa in CD can lead to a variety of symptoms including malnutrition and impairment of growth, which has long been considered a cardinal sign of untreated CD in children [2]. However, over the past decades, the clinical presentation of CD has changed and today many children have few or no symptoms at disease onset, in particular when identified through targeted serological screening of the disease [3,4]. With increasingly milder presentations and identification through screening, less is known on how longitudinal growth may be affected or predict present-day screen-detected CD [5].
While growth has been linked to CD, only four studies have examined longitudinal data of childhood growth in CD. Three of these studies demonstrate that early growth faltering is associated with later CD and suggested that these differences may be antecedent to seroconversion [6-8]. However, these studies were mostly restricted to either clinically detected CD, prompted by symptoms or signs of the disease, or CD identified through single, cross-sectional antibody screening for which there may be varying periods of autoimmunity preceding the diagnosis. From these studies, it is therefore largely unknown how growth prior to seroconversion relates to CD development. The only study with periodic autoantibody screening found no association between growth and CD development, but in that study, the data was restricted to the first 4 years of life [9]. We will address these challenges through prospectively collected, long-term follow-up data on growth from a large cohort of children genetic ally at risk for CD who have undergone repeated serological screening. We aimed to test whether longitudinal growth prior to seroconversion would predict future screen-detected CD and CD autoimmunity (CDA), a pre-clinical manifestation of CD.
Methods
The Diabetes Autoimmunity Study in the Young (DAISY) is a prospective cohort study conducted in Denver, CO, which follows children genetically at-risk for type 1 diabetes and CD [10]. Children were screened to detect CD and CDA Annual growth measurements were conducted from age nine months until 10 years. Details on the formation of the DAISY cohort and its follow-up have previously been reported [11]. The Colorado Multiple Institutional Review Board approved all study protocols. Parental informed consent was obtained and assent was obtained from children aged 7 years and older.
Study sample
Starting in 1993, children were recruited from two groups: (i) general-population newborns that through mass screening were found to have CD-permissive HLA genotypes. Children were born in 1993–2009 at Saint Joseph Hospital, Denver; (ii) unaffected children with a first-degree relative with type 1 diabetes. These children were recruited irrespective of their HLA genotype. Of the 2547 DAISY participants, this study restricted participation to 1979 children who were screened for CD and had at least one record of paired height and weight measurements until age 10 years (Figure 1, Flowchart).
Figure 1.
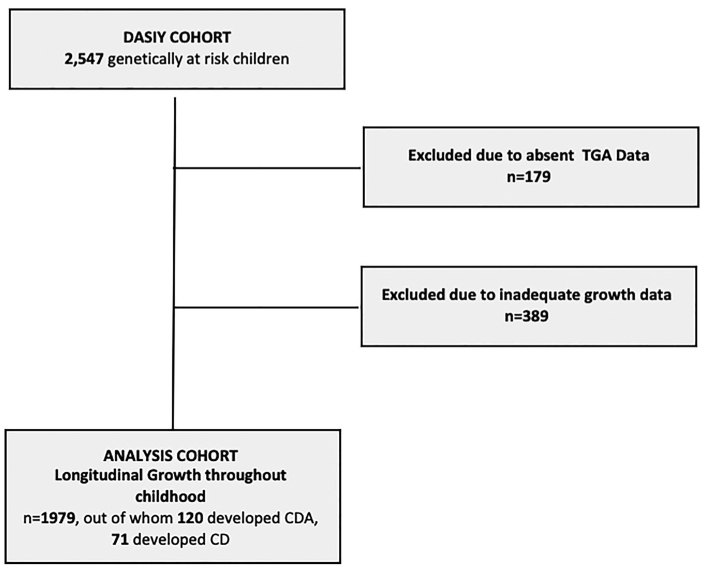
Flowchart of sample formation. Abbreviations: CDA: celiac disease autoimmunity; CD: celiac disease; DAISY: Diabetes Autoimmunity Study in the Young; TGA: tissue transglutaminase autoantibody. Genetically susceptible children refers to the presence of celiac-associated human leukocyte antigen (HLA) haplotypes or having a first-degree relative with type 1 diabetes. Among the 49 children who developed CDA, but not CD, 37 children had fluctuating or transient autoantibody levels, 10 children had persistently elevated TGA levels, and 2 children went on a gluten-free diet without a biopsy.
Outcomes: screen-detected celiac disease and celiac disease autoimmunity
As previously described [12], tissue transglutaminase autoantibodies (TGA) were used to screen for CD. Participants were tested at nine, 15 and 24 months of age, and annually thereafter. A positive test (TGA index >0.05) was repeated within three to six months. The primary outcome of this study was CDA defined as a positive TGA on two consecutive visits; CD was defined by small-intestinal biopsy showing crypt hyperplasia or villous atrophy (Marsh score ≥2) [13]. For the purpose of this study, we also defined CD by the presence of repeated TGA tests with an index of 0.5 (i.e., 10 times the upper limit of normal). A TGA index >0.5 has previously been shown to have a positive predictive value of 96% for biopsy-confirmed CD [14]. All children with CD also had CDA.
Direct measurements of childhood growth
Trained research staff measured growth at nine, 15 and 24 months of age, and annually thereafter. Weight was recorded to the nearest 0.1 kg. Recumbent length was recorded for infants and toddlers; height was obtained with a stadiometer once the child was able to cooperatively stand (recorded to the nearest 1 mm). From paired height and weight measurements, we derived the body mass index (BMI, the weight divided by the square of height in meters [kg/m2]). We calculated age- and sex-specific z-scores of height, weight and BMI using the Centers for Disease Control and Prevention growth charts as standards [15]. To reduce the impact of erroneously recorded data, seven paired growth measurements (0.7% of total growth measurements) were excluded based on published recommendations for biologically implausible values [16].
The onset of puberty (Tanner stage 2) and its further development (Tanner stage 3 and 4) varies considerably between individuals and has a strong impact on their growth velocity [17]. To rule out the impact on the results from differences in pubertal timing, this study only considered growth and CDA/CD development up to age 10 years. This was deemed as a conservative age cut-off for pre-pubertal growth based on data of self-assessed Tanner staging in a subset of DAISY participants (n = 629) aged 8 years and older (see Results) [17]. The age cut-off of 10 years was also motivated by the fact that, in genetically susceptible children, CD typically develops before that age [18].
Genotyping
As previously described [18], HLA DR, DQ genotyping was performed in DAISY to identify children with DR3-DQ2.5 and DR4-DQ8.1 (designated as DQ2 and DQ8, respectively) [19]. We categorized children into one of the following groups: DQ2/DQ2, DQ2/X, DQ2/DQ8, DQ8/DQ8, DQ8/X, and X/X, where X is neither DQ2.5 nor DQ8.
Other variables
Based on previous literature and available data [6,9,10], we pre-selected adjustment variables that may be associated with growth and CD development. Information on sex, birth-weight, gestational age, parent-reported race-ethnicity, maternal education level, and family history of CD were obtained from enrollment questionnaires. Structured quarterly interviews were conducted from age three months through 15 months of age to determine any breastfeeding duration and age of gluten introduction. Total caloric intake was calculated from validated semi-quantitative food-frequency questionnaires (FFQs) administered annually beginning at age 2 years. The FFQs reflected the child’s usual diet over the last year [20].
By study design, children in DAISY were screened for the onset of islet autoimmunity, a preclinical stage of type 1 diabetes. We considered islet autoimmunity as a potential confounder because it has been associated with both growth and CDA development [21,22], and its appearance may influence study retention and the ascertainment of growth measurements in DAISY. Covariates were categorized as shown in Table 1.
Table 1.
Study participant characteristics.
| Total (n = 1979) |
CDA (n = 120) |
CD (n = 71) |
|
|---|---|---|---|
| Median age (years(IQR))A | |||
| 1st Visit | 1.7 (0.8–3.0) | 0.80 (0.8–1.3) | 0.80 (0.8–1.3) |
| Female | 954B (48) | 71 (59) | 38 (53) |
| Family history of CD | 112 (6) | 23 (19) | 19 (27) |
| Ethnicity | |||
| Non-Hispanic White | 1467 (75) | 98 (82) | 58 (82) |
| Other | 497 (25) | 22 (18) | 13 (18) |
| T1D | 85 (4) | 7 (6) | 5 (7) |
| Islet Autoimmunity | 214 (11) | 20 (17) | 11 (15) |
| Gestational Age | |||
| Preterm (<37 weeks) | 411 (22) | 20 (17) | 18 (19) |
| Birthweight (kg(SD)) | 3.32+/−0.59 | 3.32+/−0.60 | 3.28+/−0.59 |
| HLAC | |||
| DQ2/DQ2 | 126 (6) | 15 (13) | 9 (13) |
| DQ2/X | 766 (39) | 75 (63) | 47 (66) |
| Other | 1086 (55) | 30 (25) | 15 (21) |
| Duration of breastfeeding months, median (IQR)D | 6 (2–11) | 6 (2–12) | 6 (3–13) |
| Maternal EducationE (>12 years) | 1509 (78) | 99 (84) | 58 (84) |
Abbreviations: CDA: celiac disease autoimmunity; CD: celiac disease; IQR: interquartile range; SD: standard deviation.
Growth data was only included until the age of last negative tissue transglutaminase autoantibody (TGA) test or until age ten.
Values represent number of children (column percent) unless otherwise noted.
X denotes not DQ2.
Breastfeeding duration includes exclusive and partial breastfeeding.
There were 1606 subjects in the adjusted analysis accounting for missing data.
One child lacked HLA data, 15 children had missing ethnicity data, 71 lacked data on breastfeeding duration, 54 children had missing data on maternal education, 156 lacked data on gestational age, and 78 lacked data on birthweight.
Statistical methods
Joint longitudinal exposure-survival models were employed to longitudinally examine the association of childhood growth with the risk of CDA and CD. Briefly, joint models account for potential correlation between the trajectory of longitudinal exposure measurements and the time-to-event data (i.e., a possible interrelationship between growth and CDA/CD development) [23,24]. In this approach, longitudinal and survival data are linked through shared random effects. Joint modeling has previously been used for analysis of DAISY data and has been described elsewhere in detail [11]. In this model, z-scores of height, weight and BMI were separately treated as time-varying exposures.
Based on the Akaike Information Criterion (AIC), we modeled childhood growth data using a linear mixed-effects model [25]. A piecewise exponential distribution with three internal knots was found to be the best fit for our time-to-event sub-model based on AIC. The longitudinal and survival sub-models were linked using a current-value association structure which allowed estimation of the hazard ratios (HRs) for CDA and CD at observed event times according to the z-score of weight, BMI, and height at those times [24]. We also estimated the association between growth velocity over time (per 0.01 z-score/year increase) and the subsequent risk of developing CDA and CD. Participants were followed until the appearance of CDA, defined by the timing of the first positive TGA test, or else until the time of the last negative TGA measurement by age 10 years. We used SAS JM Macro (V9.4, SAS Institute, Cary, NC) for statistical analyses.
Adjusted analyses
In the survival sub-model, we included as covariates the child’s sex, parent-reported race-ethnicity, HLA genotype, breastfeeding duration, maternal education level, and family history of CD. In the longitudinal sub-model, total caloric intake, timing of islet autoimmunity, gestational age, and birthweight were included as covariates.
Subanalyses
Based on previous DAISY findings on the age of gluten introduction [10], additional analyses were performed including this covariate in our adjusted model. We decided not to include this in our main adjustment model because that would greatly diminish our statistical power (complete data available for n = 985 children).
We also performed subanalyses restricted to 936 children enrolled before age 2.1 years and screened for TGA at least every 2.1 years. This was done to reduce misclassification and to limit the analysis to children with a more accurate estimation of time to seroconversion. This age cut-off of 2.1 years was selected to include the subset of later recruited DQ2/X general population children, but to exclude the first degree relatives of T1D patients recruited at an older age without earlier growth measurements.
Results
Out of the 1979 study participants, 954 (48%) were girls and 1467 (75%) were non-Hispanic white (Table 1). Over a total follow-up of 16,004 person-years, 120 children developed CDA, out of whom 71 also met criteria for CD. Median age of CDA/CD development was 5.2 years. In total, we had data on 10,748 recorded paired height and weight z-scores. Supplementary Figure 1 shows pre-diagnostic, age- and sex-specific z-scores of height, weight, and BMI in children with versus without later CDA/CD development. In the subset of our sample with self-assessed Tanner staging, the median age of pubertal onset was 10.5 years old for girls (interquartile range, 9.7–11.5 years) and 11.1 years old for boys (10.1–12.0 years).
Childhood growth prior to screen-detected celiac disease and celiac disease autoimmunity
In the first 10 years of life, z-scores of weight at observed event times (‘current value’) was not associated with screen-detected CDA and CD (HR 1.15 [95% CI 0.95–1.39]; 1.26 [0.97–1.62]; Figure 2); adjustment for potential confounders yielded largely unchanged results: for CDA, adjusted (a) HR 1.17 (95% CI 0.92–1.48); for CD, aHR 1.35 (95% CI 0.98–1.86). There was also no significant association of the current z-score of BMI with screen-detected CDA and CD (aHR 1.06 [95% CI 0.83–1.36] respectively 1.25 [95% CI 0.89–1.73]). The aHR for CDA according to current height was 1.19 (95% CI 0.93–1.51); the corresponding aHR for CD was 1.23 (95% CI 0.90–1.70).
Figure 2.

Adjusted hazard ratios for celiac disease (CD) and CD autoimmunity (CDA) according to current and change rate in z-scores of height, weight and body mass index. Abbreviations: aHR: adjusted hazard ratio; BMI: body mass index; CI: confidence interval; HR: hazard ratio. AUnadjusted HRs and corresponding 95% CIs are depicted in gray; adjusted (a) HRs with 95% CIs are depicted in black. BHR per increase in z-score at observed event times (‘current value’). CHR per 0.01-z-score/year increase in weight, BMI, and height, respectively.
Furthermore, neither annual velocity of weight and BMI were associated with the screen-detected CDA (aHR 1.01 [95% CI 0.96–1.03] respectively 1.00 [95% CI 0.98–1.03]) or CD (aHR 1.01 [95% CI 0.97–1.05] respectively 0.97 [95% CI 0.92–1.03]) (Figure 2). In the unadjusted model, height velocity was non-significantly associated with CD (per 0.01 z-score/year, HR 1.10; 95% CI 0.95–1.28). However, in the adjusted model, for every 0.01 z-score increase in height per year, there was a 28% increased hazard of subsequently developing CD (aHR 1.28; 95% CI 1.18–1.38).
Subanalyses
Adding age of gluten introduction to our main adjustment model, the association between the change in height and CD was largely unchanged (aHR 1.28, 95%CI 1.18–1.39, p-value <.001).
Compared with our main analyses reported above, we found largely an unchanged association between growth and CD development when limiting our analyses to the 936 children enrolled by 2.1 years old and screened for TGA at least every 2.1 years (data not shown).
Discussion
In this at-risk cohort, we used a unique data set of serial growth measurements from nine months through 10 years of age to examine if growth trajectories predict later CDA and CD as detected by periodic screening. Despite data from >10,000 paired height and weight measurements and >16,000 person-years of follow-up, we found no significant association between the child’s current weight, BMI and height and the risk of screening-detected CDA and CD; neither was the weight and BMI velocity associated with CDA and CD identified by screening. However, at odds with an intuitive interpretation, greater height velocity was after adjustment for pre-selected covariates positively associated with screen-detected CD, but not CDA development.
Most [6-8], but not all [9], previous longitudinal studies in this field have, in contrast to our findings, suggested that growth impairment may precede serological markers of CD (previous literature are summarized in Supplementary Table 1). While our study identified CD and CDA through periodic screening, previous studies have mostly considered growth prior to CD as detected clinically (prompted by symptoms or signs of the disease) or through a single time-point TGA measurement. Hence, it is conceivable that, compared to our study, previous works have identified children with an, on average, longer disease duration before diagnosis leading to an impact on growth. The Generation R study in Rotterdam, Netherlands, observed impaired growth of early childhood in those who were later found to have celiac disease autoimmunity [8]. However, this study did not screen children for TGA until 6 years of age, a time point at which many children in the DAISY study had already seroconverted. These growth differences, therefore, may be more of a reflection of untreated CD. A Norwegian study found a reduced annual height velocity in children later clinically diagnosed with celiac disease starting at 12 months of age [6]. This prompted the hypothesis that growth differences may be seen even prior to seroconversion. However, our study and the negative findings from the international, multicenter prospective cohort, The Environmental Determinants of Diabetes in the Young study, which is similar in design to DAISY, suggest that there overall do not seem to be growth differences prior to seroconversion. Consequently, the lack of a preceding growth impairment in this cohort undergoing frequent screening for CD may suggest that the previous observed association with poor growth relates to a prolonged paucisymptomatic period of undetected and thus untreated CDA. Other large, cross-sectional pediatric population studies have demonstrated that, on a population level, children with untreated, screening-identified CD were shorter and weighed less than their peers [26,27]. With cautious interpretation, this might suggest that early identification of CD through periodic screening may avoid the potential negative consequences on growth from later-diagnosed disease. However, it also must be considered that growth impairment could be independent of the time period of untreated CD and rather related to whether or not the child suffers from malabsorptive disease manifestations [5,28]. This study also highlights that the absence of growth impairment should not preclude screening for CDA in children at genetic risk of the disease.
We found greater height velocity to be associated with later development of CD. To our knowledge, a similar association has not previously been reported in CD. There may be several explanations to this finding, including that it may have transpired by chance from multiple comparisons. As in any observational study, we also cannot rule out that residual or unmeasured confounders, such as socioeconomic status and parental height, may have influenced our results. However, our findings also parallel previous results demonstrating that increased height velocity in childhood may be positively associated with the risk of developing type 1 diabetes [21,29], a disease that shares epidemiological and etiological traits with CD [22]. In regards to the risk for type 1 diabetes, it has been suggested that increased linear growth may be due to increased Insulin-like Growth Factor 1 (IGF1) which in turn may augment insulin secretion and pancreatic ß-cell demand. As IGF1 also changes the kinetics and growth of the small-intestinal mucosa [30], it is interesting to speculate whether such an effect may mediate an association between increased linear growth and celiac enteropathy. Importantly, the observed association between increased height velocity and CD development of our study was independent from the possible confounding effect of islet autoimmunity.
This study has several strengths, including its prospectively collected serial growth measurements from nine months through 10 years of age (total >10,000 paired height and weight records). Growth data were collected by trained research professionals, which, as compared to self-reports, reduces the risk of erroneously recorded data [31]. The early and frequent serological screening for CD should ensure a higher sensitivity for CD and earlier disease detection than previously used clinical case finding strategies [6,7]. This distinction is important as periodic CD screening minimizes the risk of reverse causality, i.e., growth impairment caused by the disease. The power of this study was increased by its frequent growth measurements [32] and long follow-up period, and it is one of few that has examined growth in later stages of childhood (by age 10 years) with the development of CDA or CD. The detailed data on potential confounders and predictors for CD, including celiac-associated HLA genotypes and early-life feeding practices, are additional strengths.
This study also has some limitations. First, we limited this study to pre-pubertal growth by age 10 years because information on pubertal timing and progression was only available on a subset of our study sample. It is therefore unknown if our findings also relate to growth and CD development after that age. While a robust set of covariates are included in the joint model, there were certain covariates, such as parental height, that were not available. Another potential limitation is that growth was typically measured once per year. We therefore cannot rule out that sudden changes in growth, such as a transient effects on weight, may be associated with the risk of CD or be preceded by impaired growth metrics not captured by this study. This, as well as possible errors in measuring and recording growth, may increase the risk of conducting a type 2 error (i.e., to erroneously accept a false null-hypothesis). On the other hand, few previous studies in this field have such detailed long-term follow-up data on growth as the current study, which greatly improved the power to observe a true difference in growth.
This study was restricted to children genetically at-risk for CD. Hence, it is therefore unknown how our findings relate to children from the general population. Finally, we could not evaluate whether our results may differ across clinical phenotypes of CD, specifically the presence of malabsorptive symptoms, which commonly has been suggested to mediate growth differences in children with clinically identified CD [28].
In conclusion, from prospectively collected serial growth measurements, we found no evidence of impaired childhood growth before CD/CDA development as identified through early and periodic screening. In light of previous studies, these findings indicate that growth impairment in CD is likely a consequence of, rather than an antecedent to the disease. Conversely, increased height velocity was associated with later CD, a novel finding that should be carefully corroborated by other studies before non-causal explanations are excluded.
Supplementary Material
Acknowledgements
Thanks to Dr. German Tapia, the Norwegian Institute of Public Health, for the construction of the forest plot to visualize our data.
Funding
M.J.R and J.M.N. were supported by the National Institutes of Health [grants R01-DK-032493, R01-DK-104351 and R01 DK050979]. K.M. was supported by grants from the Swedish state under the agreement between the Swedish government and the country councils, the ALF-agreement. M.G.S. was supported by the NIH training T32 DK067009 grant and supported by NIH/NCATS Colorado CTSI Grant Number UL1 TR002535. Contents are the authors’ sole responsibility and do not necessarily represent official NIH views.
Footnotes
Disclosure statement
No potential conflict of interest was reported by the author(s).
References
- [1].Singh P, Arora A, Strand TA, et al. Global prevalence of celiac disease: systematic review and meta-analysis. Clin Gastroentero Hepatol. 2018;16(6):823–836.e2. [DOI] [PubMed] [Google Scholar]
- [2].Leonard MM, Sapone A, Catassi C, et al. Celiac disease and non-celiac gluten sensitivity: a review. JAMA. 2017;318(7):647–656. [DOI] [PubMed] [Google Scholar]
- [3].Reilly NR, Fasano A, Green PH. Presentation of celiac disease. Gastrointest Endosc Clin N Am. 2012;22(4):613–621. [DOI] [PubMed] [Google Scholar]
- [4].Popp A, Maki M. Changing pattern of childhood celiac disease epidemiology: contributing factors. Front Pediatr. 2019;7:357. [DOI] [PMC free article] [PubMed] [Google Scholar]
- [5].Catassi C, Fasano A. Celiac disease as a cause of growth retardation in childhood. Curr Opin Pediatr. 2004;16(4):445–449. [DOI] [PubMed] [Google Scholar]
- [6].Kahrs CR, Magnus MC, Stigum H, et al. Early growth in children with coeliac disease: a cohort study. Arch Dis Child. 2017;102(11):1037–1043. [DOI] [PubMed] [Google Scholar]
- [7].Saari A, Harju S, Mäkitie O, et al. Systematic growth monitoring for the early detection of celiac disease in children. JAMA Pediatr 2015;169(3):e1525. [DOI] [PubMed] [Google Scholar]
- [8].Jansen MAE, Kiefte-de Jong JC, Gaillard R, et al. Growth trajectories and bone mineral density in anti-tissue transglutaminase antibody-positive children: the Generation R Study. Clin Gastroenterol Hepatol. 2015;13(5):913–920.e5. [DOI] [PubMed] [Google Scholar]
- [9].Agardh D, Lee H-S, Kurppa K, et al. Clinical features of celiac disease: a prospective birth cohort. Pediatrics. 2015;135(4):627–634. [DOI] [PMC free article] [PubMed] [Google Scholar]
- [10].Norris JM, Barriga K, Hoffenberg EJ, et al. Risk of celiac disease autoimmunity and timing of gluten introduction in the diet of infants at increased risk of disease. JAMA. 2005;293(19):2343–2351. [DOI] [PubMed] [Google Scholar]
- [11].Mårild K, Dong F, Lund-Blix NA, et al. Gluten intake and risk of celiac disease: long-term follow-up of an at-risk birth cohort. Am J Gastroenterol. 2019;114(8):1307–1314. [DOI] [PMC free article] [PubMed] [Google Scholar]
- [12].Li M, Yu L, Tiberti C, et al. A report on the international transglutaminase autoantibody workshop for celiac disease. Am J Gastroenterol. 2009;104(1):154–163. [DOI] [PMC free article] [PubMed] [Google Scholar]
- [13].Dickson BC, Streutker CJ, Chetty R. Coeliac disease: an update for pathologists. J Clin Pathol. 2006;59(10):1008–1016. [DOI] [PMC free article] [PubMed] [Google Scholar]
- [14].Liu E, Bao F, Barriga K, et al. Fluctuating transglutaminase autoantibodies are related to histologic features of celiac disease. Clin Gastroenterol Hepatol. 2003;1(5):356–362. [DOI] [PubMed] [Google Scholar]
- [15].Ziegler EE. 4.2 The CDC and Euro Growth Charts. World Rev Nutr Diet. 2015;113:295–307. [DOI] [PubMed] [Google Scholar]
- [16].National Center for Health Statistics. 2000. CDC growth charts: United States. 22 June 2019. Available from: http://www.cdc.gov/growthcharts/
- [17].Rasmussen AR, Wohlfahrt-Veje C, Tefre de Renzy-Martin K, et al. Validity of self-assessment of pubertal maturation. Pediatrics. 2015;135(1):86–93. [DOI] [PubMed] [Google Scholar]
- [18].Liu E, Dong F, Barón AE, et al. High Incidence of Celiac Disease in a Long-term Study of Adolescents With Susceptibility Genotypes. Gastroenterology. 2017;152(6):1329–1336e1. [DOI] [PMC free article] [PubMed] [Google Scholar]
- [19].Liu E, Lee H-S, Aronsson CA, TEDDY Study Group, et al. Risk of pediatric celiac disease according to HLA haplotype and country. N Engl J Med. 2014;371(1):42–49. [DOI] [PMC free article] [PubMed] [Google Scholar]
- [20].Parrish LA, Marshall JA, Krebs NF, et al. Validation of a food frequency questionnaire in preschool children. Epidemiology. 2003; 14(2):213–217. [DOI] [PubMed] [Google Scholar]
- [21].Lamb MM, Yin X, Zerbe GO, et al. Height growth velocity, islet autoimmunity and type 1 diabetes development: the diabetes autoimmunity study in the young. Diabetologia. 2009;52(10):2064–2071. [DOI] [PMC free article] [PubMed] [Google Scholar]
- [22].Hagopian W, Lee H-S, Liu E, et al. Co-occurrence of type 1 diabetes and celiac disease autoimmunity. Pediatrics. 2017;140(5):e20171305. [DOI] [PMC free article] [PubMed] [Google Scholar]
- [23].Asar Ö, Ritchie J, Kalra PA, et al. Joint modelling of repeated measurement and time-to-event data: an introductory tutorial. Int J Epidemiol. 2015;44(1):334–344. [DOI] [PubMed] [Google Scholar]
- [24].Sayers A, Heron J, Smith A, et al. Joint modelling compared with two stage methods for analysing longitudinal data and prospective outcomes: a simulation study of childhood growth and BP. Stat Methods Med Res. 2017;26(1):437–452. [DOI] [PMC free article] [PubMed] [Google Scholar]
- [25].Zhang D, Chen M-H, Ibrahim JG, et al. Assessing model fit in joint models of longitudinal and survival data with applications to cancer clinical trials. Stat Med. 2014;33(27):4715–4733. [DOI] [PMC free article] [PubMed] [Google Scholar]
- [26].van der Pals M, Myléus A, Norström F, et al. Body mass index is not a reliable tool in predicting celiac disease in children. BMC Pediatr. 2014;14:165. [DOI] [PMC free article] [PubMed] [Google Scholar]
- [27].Korponay-Szabó IR, Szabados K, Pusztai J, et al. Population screening for coeliac disease in primary care by district nurses using a rapid antibody test: diagnostic accuracy and feasibility study. BMJ. 2007;335(7632):1244–1247. [DOI] [PMC free article] [PubMed] [Google Scholar]
- [28].Nurminen S, Kivelä L, Taavela J, et al. Factors associated with growth disturbance at celiac disease diagnosis in children: a retrospective cohort study. BMC Gastroenterol. 2015;15(1):125. [DOI] [PMC free article] [PubMed] [Google Scholar]
- [29].Larsson HE, Hansson G, Carlsson A, et al. Children developing type 1 diabetes before 6 years of age have increased linear growth independent of HLA genotypes. Diabetologia. 2008;51(9):1623–1630. [DOI] [PubMed] [Google Scholar]
- [30].Dahly EM, Guo Z, Ney DM. IGF-I augments resection-induced mucosal hyperplasia by altering enterocyte kinetics. Am J Physiol Regul Integr Comp Physiol. 2003;285(4):R800–R808. [DOI] [PubMed] [Google Scholar]
- [31].Wright DR, Glanz K, Colburn T, et al. The accuracy of parent-reported height and weight for 6-12 year old U.S. children. BMC Pediatr. 2018;18(1):52. [DOI] [PMC free article] [PubMed] [Google Scholar]
- [32].Petras H. Longitudinal assessment design and statistical power for detecting an intervention impact. Prev Sci. 2016;17(7):819–829. [DOI] [PubMed] [Google Scholar]
Associated Data
This section collects any data citations, data availability statements, or supplementary materials included in this article.