

Abstract
Objective
The federal electronic health record (EHR) certification process was intended to ensure a baseline level of system quality and the ability to support meaningful use criteria. We sought to assess whether there was variation across EHR vendors in the degree to which hospitals using products from those vendors were able to achieve high levels of performance on meaningful use criteria.
Materials and Methods
We created a cross-sectional national hospital sample from the Office of the National Coordinator for Health Information Technology EHR Products Used for Meaningful Use Attestation public use file and the Centers for Medicare & Medicaid Services Medicare EHR Incentive Program Eligible Hospitals public use file. We used regression models to assess the relationship between vendor and hospital performance on 6 Stage 2 Meaningful Use criteria, controlling for hospital characteristics. We also calculated how much variation in performance is explained by vendor choice.
Results
We found significant associations between specific vendor and level of hospital performance for all 6 meaningful use criteria. Epic was associated with significantly higher performance on 5 of the 6 criteria; relationships for other vendors were mixed, with some associated with significantly worse performance on multiple criteria. EHR vendor choice accounted for between 7% and 34% of performance variation across the 6 criteria.
Discussion
A nontrivial proportion of variation in hospital meaningful use performance is explained by vendor choice, and certain vendors are more often associated with better meaningful use performance than others. Our results suggest that policy-makers should improve the certification process by including more “real-world” scenario testing and provider feedback or ratings to reduce this variation. Hospitals can use these results to guide interactions with vendors.
Conclusion
Vendor choice accounts for a meaningful proportion of variation in hospital meaningful use performance, and specific vendors are consistently associated with higher or lower performance across criteria.
Keywords: electronic health records, hospitals, EHR performance, meaningful use
BACKGROUND AND SIGNIFICANCE
The Medicare and Medicaid Electronic Health Record (EHR) Incentive Programs have sought to drive widespread EHR adoption among doctors and hospitals in order to realize quality and efficiency benefits.1,2 The programs were designed with 2 coordinated components: EHR meaningful use criteria to which providers and hospitals attest, and EHR certification criteria that vendors must meet to ensure that their products allow providers/hospitals to meet the meaningful use criteria. Prior research revealed that the majority of providers and hospitals have adopted a certified EHR and attested to meaningful use criteria.3,4 Less is known about variation across certified products in supporting providers’ ability to use EHRs.5
Certified EHRs likely differ in their support of provider EHR use. Prior studies have revealed variations in the quality of key capabilities of certified systems such as graphical display of test results6 and clinical decision support.7 In addition, vendors have pursued different approaches to usability and user-centered design.8,9 Vendors also make different decisions about system architecture, user interface design, and functionality, which carry important implications for how they are implemented and used. Vendors may devote more resources to certain types of functions at the expense of others. Finally, the certification process itself has been criticized for only requiring that vendors meet a constrained set of functions that are known to them in advance.10
As a result, there are growing calls11 for the federal government to increase the robustness of the certification process. There is also recognition of the need for providers to be aware of differences across vendors.12,13 Such awareness could inform purchasing decisions14 and increase the incentive for vendors to improve their products.15 Despite this need, no prior studies have examined the relationship between the certified EHR vendor a provider uses and the extent of EHR use, or how this may vary across domains of EHR use.
OBJECTIVE
In this study, we used recent national data on the certified EHR vendors hospitals had implemented and hospital performance on 6 meaningful use criteria to answer the following research questions: First, are certain EHR vendors more frequently found among top-performing hospitals as measured by performance on Stage 2 meaningful use criteria (ie, level of achievement above the minimum required threshold)? Second, is the relationship between EHR vendor and hospital performance consistent across criteria, or do vendors appear to specialize? Third, what proportion of variation in performance across hospitals is explained by vendor? Our results inform hospital and policy-maker understanding of the performance of certified vendors and highlight whether additional actions may be needed to improve certified EHR products.
MATERIALS AND METHODS
Data and sample
Our study used data from 3 sources. We used 2015 data from the Office of the National Coordinator for Health Information Technology’s (ONC) EHR Products Used for Meaningful Use Attestation public use file.16 The file is publicly available and reports which certified products are used by eligible hospitals and eligible providers for meaningful use attestation.5 These data also include detailed information on those EHR products from the ONC Certified Health IT Product List.17
Second, we used meaningful use attestation data from the Centers for Medicare & Medicaid Services (CMS) April 2016 Medicare Electronic Health Record Incentive Program Eligible Hospitals public use file18 to capture the level of achievement for each core and menu meaningful use criterion. This dataset includes all Stage 1 and 2 attestations starting in the first year of the program (2010). Finally, we used data from the 2014 American Hospital Association Annual Survey – IT Supplement and 2014 American Hospital Association Annual Survey19 to measure hospital characteristics.
We merged these 3 data sources based on hospital CMS certification number and used (1) attestation to Stage 2 meaningful use and (2) implementation of a 2014 (as compared to a 2011) certified EHR system as inclusion criteria in our study in order to evaluate the current set of EHR products. Because 2014 was the first year during which a hospital could attest to Stage 2 meaningful use with a 2014 certified EHR system, our data included at most one attestation per hospital. Our final analytic sample included a cross-section of 1436 unique hospitals in 2014. Supplementary Appendix Figure S1 depicts our sample selection method and Supplementary Appendix Table S1 reports sample characteristics.
Measures: meaningful use performance
We examined 6 Stage 2 meaningful use criteria that were selected as follows: We limited them to core criteria, since certain vendors may differentially invest in the quality of functionality to support menu criteria. Then, within the core criteria, we selected only those that were continuous and had empirical cross-hospital variation in performance. The 6 that we examined were all those that remained at the end of this process. However, they reflect a range of important clinical processes and were heterogeneous in the capabilities as well as users involved (eg, health information exchange, patient engagement, clinician engagement).20–23 We also confirmed that the selected criteria exhibited cross-hospital variation in performance levels. The 6 criteria were: (1) 60% of medication orders entered using computerized provider order entry (CPOE); (2) provide 50% of patients with the ability to view/download/transmit (VDT) their health information; (3) 5% of patients view/download/transmit their health information; (4) for 50% of patients received from another setting or care provider, medication reconciliation is performed; (5) for 50% of patient transitions to another setting or care provider, a summary of care record is provided; and (6) for 10% of patient transitions to another setting or care provider, a summary of care record is electronically transmitted. For each criterion, the measure of hospital performance was reported as a continuous percentage, with a minimum value of the Stage 2 meaningful use attestation threshold and a maximum value of 100%.
In addition to continuous measures of performance for each criterion, we sought to capture high-performing hospitals. Therefore, for each of the 6 criteria, we determined which hospitals were in the top quartile of performance. We also measured the total number of criteria for which each hospital was in the top quartile.
Measures: vendor
Each hospital was assigned the vendor(s) whose product(s) it used to attest to Stage 2 meaningful use. That is, if a hospital attested with both Cerner and MEDITECH, for example, we assigned both vendors to that hospital. Thirty-two percent of hospitals in our sample attested with more than one vendor.
We were concerned that using multiple vendors could make it more difficult to achieve higher levels of meaningful use performance, regardless of specific vendors. We therefore created a measure of within-hospital vendor “fragmentation.” For each hospital, we measured the share of EHR functions (defined as the 58 certification criteria included in the Certified Health IT Product List)17 provided by each vendor to support the hospital’s meaningful use attestation. We then calculated the sum of squared vendor shares for each hospital. This index would be equal to 1 for a hospital that used a single vendor for all EHR functions and would approach 0 for a hospital that used a separate vendor for each function. This measure is equivalent to the Herfindahl-Hirschman index that is commonly used to measure market concentration.24 We calculated this measure only for vendor fragmentation, rather than within-vendor product fragmentation, since many hospitals attest using multiple modular products from a single vendor that are designed to work in concert.
Measures: hospital characteristics
Our measures of hospital characteristics, which served as control variables, were: ownership (private nonprofit, private for-profit, or public nonfederal); size (number of beds); participation in payment reform models, including Accountable Care Organizations25 and/or Patient-Centered Medical Homes26; rural (“rural” or “micropolitan” area) or urban (“metropolitan” area) location; teaching status (Council of Teaching Hospital membership or not); critical access status (defined by CMS as hospitals that provide care services in certain rural areas); and participation in a Regional Health Information Organization.27 Hospital characteristics are reported in Supplementary Appendix Table S1.
Analytic Approach
Descriptive statistics
We calculated descriptive statistics to characterize our sample, with a focus on EHR vendor measures. Descriptive statistics included vendor market share for the vendors whose products were most commonly used to attest to Stage 2 meaningful use. Next, we calculated the proportion of hospitals using a complete EHR system (defined as attesting with a product certified as capable of meeting all meaningful use criteria) compared to those using a modular EHR system (defined as attesting with multiple products, each certified as capable of meeting some of the meaningful use criteria). We more closely examined the subset of hospitals attesting with modular EHR systems to identify the proportion using multiple products from a single vendor compared to products from more than one vendor. Finally, we measured variation in the vendor fragmentation index, as well as the mean and range of performance on the 6 chosen Stage 2 meaningful use criteria.
Relationship between EHR vendor and hospital meaningful use performance
To address our 3 research questions related to vendor quality based on hospital meaningful use performance, we employed both descriptive comparisons and multivariate regressions. Descriptively, we calculated the vendor composition (frequencies) for hospitals in the top quartile of performance for all 6 meaningful use criteria, as well as the vendor composition among hospitals in the top quartile of 5, 4, 3, 2, 1, and 0 criteria. Next, we calculated vendor frequencies among hospitals in the top performance quartile for each criterion individually.
We used multivariate regressions to control for observed hospital characteristics. Specifically, we regressed level of meaningful use performance on EHR vendor indicators (eg, Epic, Cerner) and hospital characteristics for each of the 6 criteria. The coefficient for each vendor indicator measures the average meaningful use performance level for that vendor’s adopting hospitals, conditional on observed hospital characteristics. By including the vendor fragmentation index, we adjust for the possibility that multivendor systems may perform differently, either negatively (eg, due to poor interoperability) or positively (eg, due to gains from specialization). We describe additional analyses to address potential selection bias in the “Robustness and causality” section.
To measure vendor contributions to meaningful use performance, we used the base regression results to calculate the partial R2 of our vendor measures. This statistic measures the proportion of variation in meaningful use performance explained by all of the vendor variables, conditional on observed hospital characteristics. To facilitate interpretation of the magnitude of these results, we calculated the same statistics for observed hospital characteristics.
Robustness and causality
The regression analyses address the potential for selection based on observed hospital characteristics. Vendor selection could, however, be associated with unobserved hospital differences – such as more resources, technological savvy, or organizational culture – and these differences may drive meaningful use performance. To address this concern, we first examined the correlation between observed hospital characteristics and vendor choice (Supplementary Appendix Table S2). We would, for example, expect critical access hospitals to be constrained in both financial resources and skilled IT workers. While we controlled for such observed characteristics in our regressions, a correlation between these characteristics and vendor choice would indicate that selection on hospital characteristics, observed or unobserved, is occurring. We found that among critical access hospitals, the distribution of vendor selection was similar to that in our sample.
While these results did not provide a strong indication of selection bias, we employed an instrumental variables technique to further address potential selection bias. This approach relies on a measure that is correlated with EHR vendor choice but is otherwise uncorrelated with meaningful use performance, to remove endogeneity bias from our results. Using vendor variation driven by our instrument – variation that should be uncorrelated with an individual hospital’s meaningful use performance – should remove any selection bias from our regression estimates.
We used geographically proximate hospitals’ vendor choices as an instrument for EHR vendor choice. Previous work has shown geographic variation in EHR vendor marketing,21 suggesting that a hospital’s location influences its vendor choice. Specifically, we used as our instrument the proportion of hospitals using each EHR vendor within a 15-to-50-mile radius of the focal hospital. This radius was chosen to capture regional market variations in EHR vendor marketing, but to exclude hospitals that directly compete and regularly share patients, which may have differential effects on vendor choice. We found that the instrument was a strong predictor of vendor choice and did not correlate with meaningful use performance, except through its impact on EHR vendor choice. We then re-estimated our 6 regression models using 2-stage residual inclusion. Results consistent with our main regressions would suggest that our hospital observable characteristics adjusted for selection bias from choice of EHR vendor.
RESULTS
Sample descriptive statistics
Table 1 presents descriptive statistics for our analytic sample. Epic had the largest market share (used by 27.4% of hospitals), followed by Cerner (25.1%), MEDITECH (19.6%), McKesson (9.8%), MEDHOST (7.6%), Healthland (4.9%), and Allscripts (4.2%). Modular EHRs were dominant (71.2% of hospitals) as compared to complete systems (28.8%). Among hospitals that used modular systems, just over half (54.8%) used only one vendor (ie, they used multiple different products that all came from the same vendor), with the remainder (45.2%) using multiple vendors. Consequently, vendor fragmentation within hospitals was extremely low, with a mean of 0.919 and range of 0.158 to 1 (where 1 is a single vendor). Table 1 also presents Stage 2 meaningful use performance levels. The highest average performance was for patients having the ability to view/download/transmit information (87.6%) and the lowest average performance was for patients actually engaging in VDT (15.1%).
Table 1.
Sample descriptive statistics
| Hospitals with at least 1 certified criteria coming from this vendor: | Freq. (%) |
|---|---|
| Epic | 393 (27.4) |
| Cerner | 360 (25.1) |
| MEDITECH | 282 (19.6) |
| McKesson | 141 (9.8) |
| MEDHOST | 109 (7.6) |
| Healthland | 71 (4.9) |
| Allscripts | 60 (4.2) |
| Other | 137 (9.5) |
| EHR system characteristics | |
| Complete EHR | 413 (28.8) |
| Modular EHR | 1023 (71.2) |
| Among modular EHRs: | |
| Only 1 vendor | 561 (54.84) |
| More than 1 vendor | 462 (45.16) |
| Measure of vendor fragmentation | Mean (range) |
| Herfindahl-Hirschman index | 0.92 (0.16–1.0) |
| Stage 2 meaningful use performance levels | |
| Medication CPOE | 84.6 (60.1–100%) |
| View/download/transmit available | 87.6 (50.1–100%) |
| View/download/transmit used | 15.1 (5.1–100%) |
| Medication reconciliation | 85.9 (50.4–100%) |
| Summary of care records provided | 78.4 (50.2–100%) |
| Summary of care records sent electronically | 36.1 (22.0–100%) |
Notes: N = 1436.
Relationship between EHR vendor and meaningful use performance
Descriptive statistics
Three hospitals were in the top performance quartile for all meaningful use criteria, and all used Epic (Figure 1). Of the 17 hospitals in the top performance quartile for 5 criteria, 15 used Epic, 1 used MEDITECH, and 1 used a smaller vendor. For the 68 hospitals in the top quartile for 4 criteria, 44 (64.7%) used Epic, 8 (11.8%) used Cerner, and 6 (8.8%) used MEDITECH. For the 355 hospitals that were not in the top quartile of any criteria, 102 (28.7%) used MEDITECH, 89 (25.1%) used McKesson, 72 (20.3%) used Cerner, 51 (14.4%) used MEDHOST, and 24 (6.8%) used Epic.
Figure 1.
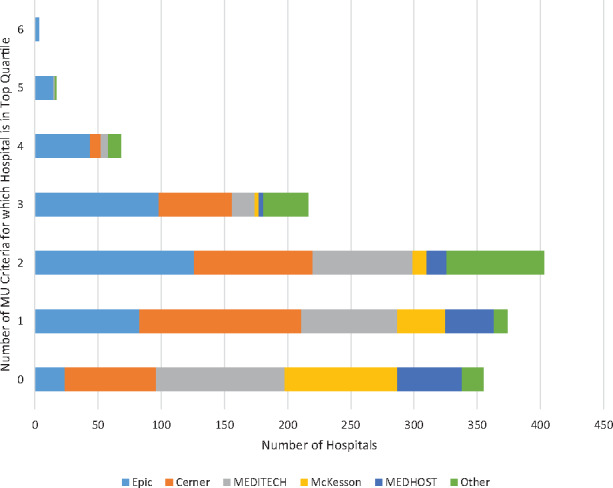
Meaningful use achievement across criteria: counts of hospitals in the top quartile for Stage 2 meaningful use criteria by vendor.
We next examined vendor composition for each criterion. Among hospitals in the top quartile for the medication CPOE criterion, Epic was the most frequently used, at 46.3% of hospitals (Figure 2). For the VDT availability and electronic summary of care record sent criteria, the most frequent vendor was again Epic (41.7% and 33.1% of hospitals in the top quartile, respectively). For hospitals in the top quartile for the VDT used by patients criterion, Epic was again the most frequently represented, at 63.6% of hospitals. Cerner was the most frequently used vendor for medication reconciliation (used by 41.1% of hospitals in the top quartile) and MEDITECH was the most frequently used vendor for the summary of care record criterion (used by 36.9% of hospitals in the top quartile).
Figure 2.
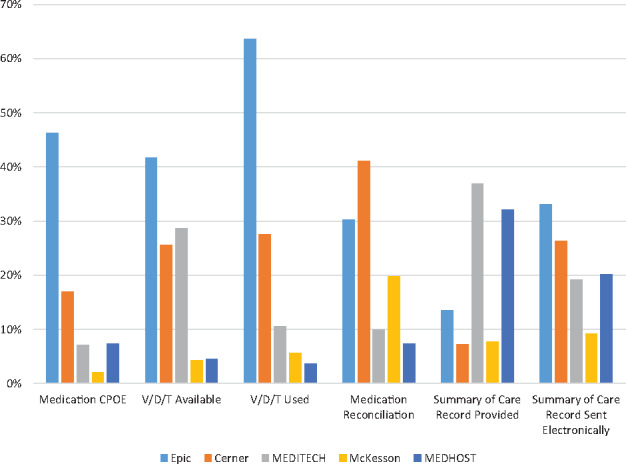
EHR vendors used by hospitals in the top quartile of Stage 2 meaningful use criteria by individual criterion.
Regression results
In our multivariate regressions, Epic was associated with significantly better performance on 5 of the 6 criteria (Table 2). In terms of magnitude, Epic was associated with between 3 and 25 percentage point higher performance: medication CPOE (r = 10.33; P < .01), VDT available (r = 8.34; P < .01), VDT used by patients (r = 24.62; P < .01), medication reconciliation (r = 3.09; P = .01), electronically sending summary of care records (r = 10.61; P < .01). Cerner was significantly positively associated with 3 criteria (medication CPOE [r = 4.02; P < .01], VDT used by patients [r = 14.70; P < .01], medication reconciliation [r = 4.39; P < .01]) and significantly negatively associated with summary of care record provided (r = −6.69; P < .01). MEDITECH was significantly positively associated with VDT used by patients (r = 10.58; P < .01) and negatively associated with medication reconciliation (r = −5.28; P < .01). McKesson was significantly positively associated with VDT used by patients (r = 7.43; P < .01) and significantly negatively associated with 4 criteria (VDT available [r = −10.29; P < .01], medication reconciliation [r = −3.40; P < .01], summary of care records provided [r = −7.58; P < .01], and electronically sending summary of care records [r = −5.75; P = .03]). Other vendors also showed variable relationships across criteria.
Table 2.
Relationship between EHR vendor and hospital performance on Stage 2 meaningful use criteria
| Meaningful Use Criterion | Medication CPOE | VDT available | VDT used | Medication reconciliation | Summary of care record provided | Summary of care record sent electronically |
|---|---|---|---|---|---|---|
| Criterion performance range | 60–100% | 50–100% | 5–100% | 50–100% | 50–100% | 10–100% |
| EHR vendor | Coefficient (interpreted as percentage point difference in criterion performance) | |||||
| Epic | 10.33*** | 8.34*** | 24.62*** | 3.09* | −0.15 | 10.61*** |
| Cerner | 4.02*** | 0.64 | 14.70*** | 4.39*** | −6.69*** | 2.89 |
| MEDITECH | −1.13 | −2.26 | 10.58*** | −5.28*** | 3.80* | 1.08 |
| McKesson | −2.39 | −10.19*** | 7.43*** | −4.00** | −7.58*** | −5.75* |
| MEDHOST | −0.41 | 2.18 | 6.85*** | −9.66*** | 3.48 | −1.53 |
| Healthland | 15.26*** | −7.86*** | 7.49*** | −10.98*** | 13.92*** | 14.12*** |
| Allscripts | 8.67*** | −0.65 | 5.574*** | −3.56* | 1.90 | −6.68* |
| Other vendor | 1.90 | −1.01 | 14.51*** | −5.05** | 6.00** | 3.86 |
| Hospital characteristicsa | Included | Included | Included | Included | Included | Included |
Notes: N = 1436. aControl variables include hospital ownership, size, payment reform participation, Regional Health Information Organization participation, and vendor fragmentation. See Supplementary Appendix Table S4 for full regression results.
Positive coefficients indicate percentage point higher performance on the meaningful use criterion for hospitals using an EHR from that vendor (holding all other variables constant), while negative coefficients indicate percentage point lower performance.
*Indicates P < .05, **P < .01, ***P < .001.
Variation attributable to vendor
EHR vendor explained 23.3% of the variation in hospital performance for medication CPOE, 17.4% for VDT available, 33.9% for VDT use, 17.1% for medication reconciliation, 15.4% for summary of care record provided, and 7.4% for electronic transmission of summary care records. Observed hospital characteristics explained a far smaller share of meaningful use variation. Hospital characteristics jointly explained between 2.6% of variation (for VDT used by patients) and 7.5% of variation (for VDT available for patients) (Figure 3).
Figure 3.
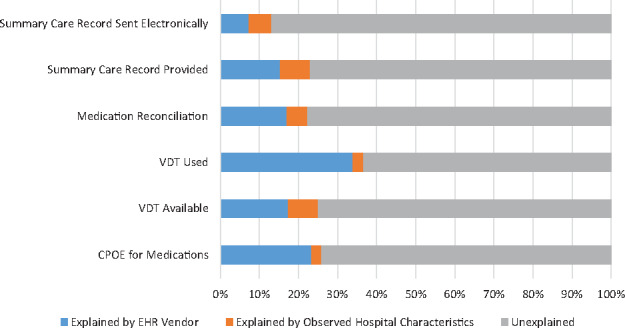
Proportion of meaningful use performance variation explained by vendor.
Robustness and causality
The results of our instrumental variable analyses were largely similar to our naïve estimates (Supplementary Appendix Table S3). Epic was still significantly positively associated with 3 criteria (medication CPOE, VDT available for patients, and VDT used by patients) instead of 5. Cerner was significantly positively associated with 1 criterion (VDT used by patients) instead of 3. Other vendors had mixed results similar to our naïve estimates. Taken together, this suggests that our results are robust to potential selection bias from EHR vendor choice.
DISCUSSION
In the first large-scale study to examine the relationship between EHR vendor and hospital meaningful use performance, we found that choice of vendor explains a nontrivial proportion of hospital performance variation. In addition, the specific vendor appears to matter, with some vendors associated with significantly better or worse performance across multiple criteria. This suggests that hospitals may need to take vendor choice into account if they seek higher achievement on meaningful use criteria and cannot rely solely on the EHR certification process to ensure that all systems are equally capable. Our results also suggest that policy-makers should consider strengthening the certification program to minimize such vendor-to-vendor differences or take steps to improve transparency about this variation.
Such variation might be acceptable if it appeared that certain vendors specialized in particular functions, such that they had very strong performance on 1 or 2 criteria and were undifferentiated on the other criteria. However, we did not find any vendors exhibiting this pattern. Instead, one vendor, Epic, was significantly positively associated with multiple criteria. Cerner was also positively associated with several criteria, but with negative performance on one criterion, and the remaining vendors reflected a mix. This suggests that vendors are making different design choices and also that some vendors are simply doing a better job than others at creating systems that enable hospitals to achieve high levels of performance on meaningful use criteria.
This conclusion is supported by small-scale studies that have examined variations in EHR vendor products. Prior work evaluating specific capabilities, such as clinical decision support, have found significant variation across EHR products, with some appearing more robust and full-featured and others lacking important functionalities.7 Usability may also be a barrier to high performance, as some EHR vendors have more developed user-centered design processes in place.9 Considering this heterogeneity in capabilities and design, it is less surprising that we found significant performance variation across vendors.
While vendor choice and hospital characteristics explain a nontrivial amount of performance variation, for none of our 6 meaningful use criteria did they explain a majority of the variation. There are undoubtedly many other variables that influence meaningful use performance, such as installation and workflow optimization, audit and feedback programs, and other financial incentives (eg, quality improvement, value-based care). Therefore, our results also reveal that there is much more to achieving high levels of technology-enabled care than simply choosing the best EHR.
Limitations
Our results should be interpreted with some important limitations in mind. The first is that our dataset only included hospitals that had attested to Stage 2 meaningful use as of April 2016. This limited our analysis to the subset of hospitals that were early attesters, and vendor choice may have differential effects for hospitals attesting later. Second, we examined 6 Stage 2 meaningful use criteria that represent valuable and diverse health care delivery processes and should support improved outcomes. While functions such as computerized provider order entry, medication reconciliation, and electronically sharing patient data have been shown to improve quality22 and reduce costs,23 there is no strong empirical evidence that directly relates Stage 2 criteria to outcomes. The final important limitation is that our analysis used cross-sectional data and our data included little detail on hospitals’ EHR implementation efforts or why they chose the vendors they did. In particular, while we included several measures that sought to control for hospital resources, it is possible that hospitals with greater financial means were more likely to purchase high-cost EHRs from specific vendors and separately chose to invest in high levels of meaningful use performance. Together, these hampered our ability to isolate vendor effects and make causal attributions. While we employed an instrumental variables approach to bolster causal inference and address possible endogeneity, the results should still be interpreted with caution.
Policy and practice implications
Our findings have important implications for both policy-makers and hospital leaders. While all hospitals in our sample met Stage 2 meaningful use requirements, there was significant variation in achievement across certified vendors. This suggests that the current EHR certification process does not achieve a key intended goal of giving providers confidence that they are buying a “good” EHR. This may be due to the fact that the certification process only tests a narrowly constrained set of “technical” meaningful use requirements and does so in a controlled laboratory setting. A recent federal ruling against a major EHR vendor highlighted this weakness, stating that “certification testing does not confirm that each criteria and standard is satisfied in full and under every conceivable scenario. Rather, testing takes a snapshot of a product’s capabilities by ensuring it can pass certain pre-disclosed test cases.”10 Taking a broader and more rigorous approach to certification, with an emphasis on usability, may do a better job of ensuring a high-quality product.28 Policy-makers should consider including more real-world trials to assess how EHRs perform in simulated clinical events that are not revealed to vendors beforehand.10 Finally, it may be the case that vendor services such as implementation guidance, training, and ongoing maintenance and upgrades play an important role in the level of EHR use. It is possible our results capture not only the impact of the software itself on meaningful use performance, but the quality of vendor support services. Policy-makers may therefore wish to explore a certification process that includes an assessment of the quality of these services that holistically evaluates software and vendor support services.
For hospital leaders, our study underscores the need to make careful choices when selecting an EHR vendor and offers some guidance on which products may be stronger. In addition, our results may help hospitals make the case to vendors to improve their products. Nonetheless, given that vendor choice explained no more than one-third of performance variation, it is important to recognize that success is not as simple as picking the “best” vendor. Previous studies have shown quality variation within vendors, indicating that the quality of a system implementation may be just as important as the software system itself.13,29 Additional evidence revealing that hospitals have achieved disparate quality results using similar software systems12,30,31 further suggests the importance of organizational factors such as implementation and vendor services, IT staffing and support, training programs, and commitment to optimizing EHR use, which are likely more important to achieving high levels of performance.32,33
CONCLUSION
Our study is the first to examine the relationship between hospital EHR vendor choice and hospital performance on 6 high-value Stage 2 meaningful use criteria. We found that vendor choice explains a nontrivial proportion of variation in hospital performance, and that certain vendors appear to be better than others (though none performed significantly better across all criteria). Our results suggest that policy-makers should pursue modifications to the EHR certification process to decrease such variation across EHR vendors and improve EHR systems.
Funding
None.
Competing Interests
None.
SUPPLEMENTARY MATERIAL
Supplementary material is available at Journal of the American Medical Informatics Association online.
Supplementary Material
ACKNOWLEDGMENTS
None.
References
- 1. Adler-Milstein J, Everson J, Lee S-YD. EHR adoption and hospital performance: time-related effects. Health Services Res. 2015;506:1751–71. [DOI] [PMC free article] [PubMed] [Google Scholar]
- 2. Savage EL, Fairbanks RJ, Ratwani RM. Are informed policies in place to promote safe and usable EHRs? A cross-industry comparison. J Am Med Inform Assoc. 2017;244:769–75. [DOI] [PMC free article] [PubMed] [Google Scholar]
- 3. Blumenthal D. Launching HITECH. N Engl J Med. 2010;3625:382–85. [DOI] [PubMed] [Google Scholar]
- 4. Adler-Milstein J, DesRoches CM, Kralovec P et al. , Electronic health record adoption in US hospitals: progress continues, but challenges persist. Health Aff (Millwood). 2015;3412:2174–80. [DOI] [PubMed] [Google Scholar]
- 5. Office of the National Coordinator for Health Information. ONC Health IT Certification Program. [2016]. www.healthit.gov/policy-researchers-implementers/about-onc-health-it-certification-program. Accessed August 2, 2016. [Google Scholar]
- 6. Sittig DF, Murphy DR, Smith MW et al. , Graphical display of diagnostic test results in electronic health records: a comparison of 8 systems. J Am Med Inform Assoc. 2015;224:900–04. [DOI] [PMC free article] [PubMed] [Google Scholar]
- 7. McCoy AB, Wright A, Sittig DF. Cross-vendor evaluation of key user-defined clinical decision support capabilities: a scenario-based assessment of certified electronic health records with guidelines for future development. J Am Med Inform Assoc. 2015;225:1081–88. [DOI] [PMC free article] [PubMed] [Google Scholar]
- 8. Ratwani RM, Benda NC, Hettinger AZ et al. , Electronic health record vendor adherence to usability certification requirements and testing standards. JAMA. 2015;31410:1070–71. [DOI] [PubMed] [Google Scholar]
- 9. Ratwani RM, Fairbanks RJ, Hettinger AZ et al. , Electronic health record usability: analysis of the user-centered design processes of eleven electronic health record vendors. J Am Med Inform Assoc. 2015;226:1179–82. [DOI] [PMC free article] [PubMed] [Google Scholar]
- 10. Sullivan T. eClinicalWorks to pay $155 million to settle suit alleging it faked meaningful use certification. Healthcare IT News. 2017. www.healthcareitnews.com/news/eclinicalworks-pay-155-million-settle-suit-alleging-it-faked-meaningful-use-certification. Accessed June 1, 2017. [Google Scholar]
- 11. Adler-Milstein J. Moving Past the EHR Interoperability Blame Game. NEJM Catalyst. 2017. http://catalyst.nejm.org/ehr-interoperability-blame-game/. Accessed July 20, 2017. [Google Scholar]
- 12. Han YY, Carcillo JA, Venkataraman ST et al. , Unexpected increased mortality after implementation of a commercially sold computerized physician order entry system. Pediatrics. 2005;1166:1506–12. [DOI] [PubMed] [Google Scholar]
- 13. Metzger J, Welebob E, Bates DW et al. , Mixed results in the safety performance of computerized physician order entry. Health Aff. 2010;294:655–63. [DOI] [PubMed] [Google Scholar]
- 14. Penrod LE. Electronic health record transition considerations. PM&R. 2017;95:S13–18. [DOI] [PubMed] [Google Scholar]
- 15. American Academy of Family Physicians. EHR Certification Methods Fail Physicians, Patients 2015. www.aafp.org/news/practice-professional-issues/20150127EHRcert.html. Accessed November 12, 2016. [Google Scholar]
- 16. Centers for Medicare & Medicaid Services. CMS Medicare and Medicaid EHR Incentive Program, Electronic Health Record Products Used for Attestation 2016. https://dashboard.healthit.gov/datadashboard/documentation/ehr-products-mu-attestation-data-documentation.php. Accessed August 2, 2016. [Google Scholar]
- 17. Office of the National Coordinator for Health Information Technology. EHR Products Used for Meaningful Use Attestation. http://dashboard.healthit.gov/datadashboard/documentation/ehr-products-mu-attestation-data-documentation.php. Accessed August 2, 2016. [Google Scholar]
- 18. Centers for Medicare & Medicaid Services. CMS Medicare EHR Incentive Program Eligible Professionals Public Use File 2015. www.cms.gov/Regulations-and-Guidance/Legislation/EHRIncentivePrograms/DataAndReports.html. Accessed August 2, 2016. [Google Scholar]
- 19. Everson J, Lee S-YD, Friedman CP. Reliability and validity of the American Hospital Association's national longitudinal survey of health information technology adoption. J Am Med Inform Assoc. 2014;21(e2):e257–63. [DOI] [PMC free article] [PubMed] [Google Scholar]
- 20. Adler-Milstein J, Jha AK. Health information exchange among US hospitals: who's in, who's out, and why? In Healthc (Amst). 2014;21:26–32. [DOI] [PubMed] [Google Scholar]
- 21. Everson J, Adler-Milstein J. Engagement in hospital health information exchange is associated with vendor marketplace dominance. Health Affairs. 2016;357:1286–93. [DOI] [PubMed] [Google Scholar]
- 22. Radley DC, Wasserman MR, Olsho LEW et al. , Reduction in medication errors in hospitals due to adoption of computerized provider order entry systems. J Am Med Inform Assoc. 2013;203:470–76. [DOI] [PMC free article] [PubMed] [Google Scholar]
- 23. Walker J, Pan E, Johnston D et al. , The value of health care information exchange and interoperability. Health Aff. 2005;24:W5-10-W5-18. [DOI] [PubMed] [Google Scholar]
- 24. Rhoades SA. Herfindahl-Hirschman index. Fed Res Bull. 1993;79:188. [Google Scholar]
- 25. Berwick DM. Launching accountable care organizations—the proposed rule for the Medicare Shared Savings Program. New Engl J Med. 2011;36416:e32. [DOI] [PubMed] [Google Scholar]
- 26. Patient-Centered Primary Care Collaborative. Patient-centered medical home. Senate Special Committee on Aging 2007. [Google Scholar]
- 27. Adler-Milstein J, et al. , The state of regional health information organizations: current activities and financing. Health Aff. 2008;271:w60–69. [DOI] [PubMed] [Google Scholar]
- 28. American Medical Association. Physicians outline improvements to EHR certification process. AMA Wire. 2015. [Google Scholar]
- 29. Chaparro JD, Classen DC, Danforth M et al. , National trends in safety performance of electronic health record systems in children's hospitals. J Am Med Inform Assoc. 2017;242:268–74. [DOI] [PMC free article] [PubMed] [Google Scholar]
- 30. Del Beccaro MA, Jeffries HE, Eisenberg MA et al. , Computerized provider order entry implementation: no association with increased mortality rates in an intensive care unit. Pediatrics. 2006;1181:290–95. [DOI] [PubMed] [Google Scholar]
- 31. Longhurst CA, Parast L, Sandborg CI et al. , Decrease in hospital-wide mortality rate after implementation of a commercially sold computerized physician order entry system. Pediatrics. 2010;1261:14–21. [DOI] [PubMed] [Google Scholar]
- 32. Cresswell KM, Bates DW, Sheikh A. Ten key considerations for the successful implementation and adoption of large-scale health information technology. J Am Med Inform Assoc. 2013;20(e1):e9–13. [DOI] [PMC free article] [PubMed] [Google Scholar]
- 33. Cresswell KM, Bates DW, Sheikh A. Ten key considerations for the successful optimization of large-scale health information technology. J Am Med Inform Assoc. 2017;21:182–87. [DOI] [PMC free article] [PubMed] [Google Scholar]
Associated Data
This section collects any data citations, data availability statements, or supplementary materials included in this article.