

Abstract
Objective
To describe the development, as part of the European Union MOSAIC (Models and Simulation Techniques for Discovering Diabetes Influence Factors) project, of a dashboard-based system for the management of type 2 diabetes and assess its impact on clinical practice.
Methods
The MOSAIC dashboard system is based on predictive modeling, longitudinal data analytics, and the reuse and integration of data from hospitals and public health repositories. Data are merged into an i2b2 data warehouse, which feeds a set of advanced temporal analytic models, including temporal abstractions, care-flow mining, drug exposure pattern detection, and risk-prediction models for type 2 diabetes complications. The dashboard has 2 components, designed for (1) clinical decision support during follow-up consultations and (2) outcome assessment on populations of interest. To assess the impact of the clinical decision support component, a pre-post study was conducted considering visit duration, number of screening examinations, and lifestyle interventions. A pilot sample of 700 Italian patients was investigated. Judgments on the outcome assessment component were obtained via focus groups with clinicians and health care managers.
Results
The use of the decision support component in clinical activities produced a reduction in visit duration (P ≪ .01) and an increase in the number of screening exams for complications (P < .01). We also observed a relevant, although nonstatistically significant, increase in the proportion of patients receiving lifestyle interventions (from 69% to 77%). Regarding the outcome assessment component, focus groups highlighted the system’s capability of identifying and understanding the characteristics of patient subgroups treated at the center.
Conclusion
Our study demonstrates that decision support tools based on the integration of multiple-source data and visual and predictive analytics do improve the management of a chronic disease such as type 2 diabetes by enacting a successful implementation of the learning health care system cycle.
Keywords: clinical decision support systems, data integration, temporal data analytics, type 2 diabetes
INTRODUCTION
The availability of powerful information technology (IT) infrastructures for clinical data management, multiple-source data integration, and on-the-fly analytics provides novel opportunities for designing decision support systems (DSS) tightly coupled with research platforms. In particular, new-generation DSS can rely on a technological layer that may be used to support both clinical decision-making and outcomes-based research, following a research paradigm described by Wagholikar et al.1 called the “sidecar” approach. In a nutshell, a well-designed data warehouse (DW) is used both as an instrument for querying and analyzing retrospective clinical data and to support precision medicine interventions by retrieving similar patients and highlighting their disease trajectories.
This approach appears especially suitable to dealing with chronic disease management, where data are collected over time. It is also useful to highlight a patient’s clinical situation at different temporal granularities, ranging from days to months and years.
In this context, diabetes mellitus (DM) is a paradigmatic case. DM, classified as type 1 (T1DM) and type 2 (T2DM), is a multifactorial chronic disease that became of worldwide concern because of its epidemic proportions and complex management. The latter requires a combination of drugs and lifestyle interventions and lifelong engagement by patients. DM is frequently associated with micro- and macrovascular complications, which directly or indirectly derive from the long-term damage caused by suboptimal treatment of the disease.
The design of effective DSS for supporting DM management has been widely studied in the literature since the early 1980s.2 Even if the potential of DSS in DM is widely recognized in the literature, the actual implementation of such systems faces technological and organizational barriers.
The increasing availability of electronic data from heterogeneous sources provides the opportunity to redesign visit-by-visit DSS for DM management in order to leverage data integration, predictive data mining, and visual analytics. Visit-by-visit DSSs1 aim to assist caregivers in defining therapeutic plans by analyzing clinical and home monitoring data.
In this paper, we describe the main architecture, the implementation, and a first evaluation (in terms of usability and impact on clinical activities) of the DSS that is currently used at the outpatient diabetes service of the Istituti Clinico Scientifici Maugeri Hospital of Pavia (ICSM). This DSS was specifically designed to support the management of T2DM by targeting 2 types of users: health care providers, who exploit individual patients’ data to define therapeutic interventions, and health care decision makers, including clinicians, managers, and policy makers, who analyze the data to identify important clinical phenomena occurring at the level of the entire cohort of treated patients.
The system has been implemented within the European Union MOSAIC (Models and Simulation Techniques for Discovering Diabetes Influence Factors) project, which is aimed at defining new models to predict T2DM and its complications from clinical data, and to use the data to support clinical decision-making.
BACKGROUND
Despite considerable efforts to design computer-based models to estimate long-term outcomes and identify the most efficient management strategies for T2DM,3 chronic outpatient DSS often produced inconsistent results on key aspects of diabetes care due to low use rate or to the organizational complexity of long-term disease management interventions.4 Available DSS for T2DM focus on different aspects: some of them aim to enhance personalized treatment and medication recommendations5–10; others target the improvement of glycemic control11–15; and still others focus on the management of specific complications, such as diabetic foot,16 retinopathy,17–19 nephropathy,20 or cardiovascular disease.21 In clinical settings, some DSS have been designed to be integrated into primary care.22–26 Other types of DSS promote shared care and collaborative decision-making across different clinical settings.27–33 Efforts have also been devoted to providing evidence-based care30 with a high level of personalization, with recommendations tailored to the patient’s clinical condition and behavior28,29 and to the clinical setting.31
In our work, we leveraged the longitudinal nature of clinical data, designing a DSS that is able to present events over time, as well as the patient’s evolving clinical state, through visual analytics.34 The DSS has been implemented following a dashboard paradigm. Dashboards implement a specific user interface approach and are defined as DSS capable of querying multiple databases to merge information and provide a visual summary of key performance indicators, in a “car dashboard” format.35–39
Our work is related to the experience reported by Ratwani and Fong,40 in which a system-level dashboard, summarizing data from multiple hospitals, and a set of hospital-level dashboards were developed. The dashboards allowed users to navigate and monitor the data through coordinated displays in different formats, and to quickly zoom in to specific variables of interest. Another related system is the one presented by Dixon et al.41: the authors implemented an integrated informatics approach to aggregate and display clinically relevant data able to identify medication adherence problems and facilitate patient-provider communication about strategies to improve medication use.
DESIGN AND IMPLEMENTATION OF THE MOSAIC SYSTEM
The MOSAIC project
MOSAIC is an EU-funded project of the Seventh Framework Programme, involving academic partners, companies, and hospitals from several European countries. The project is devoted to the development of innovative models to support prediction and diagnosis of T2DM and design a DSS for T2DM management, with a special focus on the risk assessment of related complications.
The implemented DSS focuses explicitly on studying the progression of diabetes through the analysis of available patient data. The study was carried out at ICSM, and included >1000 T2DM patients. Data were collected retrospectively over 10 years and prospectively for 6 months, from 2 sources: the ICSM electronic health record (EHR) and the local public health agency, Agenzia Tutela Salute (ATS). While the EHR contains clinical data collected at each control visit, usually every 3–6 months, ATS data contain administrative information about all hospitalizations, visits, and exams performed in other hospitals and labs in the country and reimbursed by the Italian national health care system.
Moreover, ATS records all the drugs prescribed by general practitioners and purchased by patients at pharmacies within its jurisdiction. This data stream includes Anatomical Therapeutic Classification codes to identify the drugs’ active ingredients, and Authorization to Market Introduction codes, assigned by the Italian Ministry of Health to identify pharmaceutical company, drug package features, etc. Each purchase reports exposure measures quantified through the Defined Daily Doses42 system, which offers an indication of the expected average daily dosage of the prescribed drug.
The integration of EHR and ATS data sources provides a longitudinal view of patients’ metabolic control, concurrent complications, and treatments.
System architecture and implementation
As already mentioned, our goal was to develop a system able to support retrospective data analysis and clinical decision support, following the “sidecar” paradigm.43
The architecture of the system, shown in Figure 1, is based on 3 main modules: data integration and warehousing, data querying and mining, and graphical user interface and data visualization through the MOSAIC dashboard.
Figure 1.
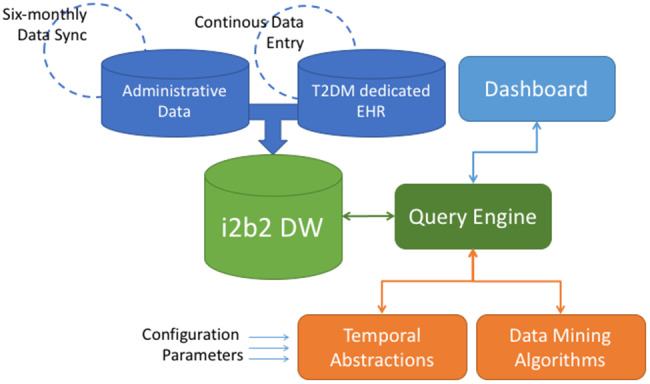
The Dashboard Service Oriented Architecture. The architecture components include: a) a data module, composed of the i2b2 DW, which collects data from Administrative Data stream (updated every six-months) and clinical data from the T2DM dedicated EHR (continuously updated during follow-ups); b) a logical module, which implements the analytics algorithms and models upon the gathered data. The Query Engine is the central service between users of the Dashboard and data stored in the i2b2 DW. The Temporal Abstraction and Data mining Algorithms modules, once tuned with appropriate configuration parameters, extract meaningful patterns from the data selected through the query engine; c) a graphical module, composed by all the visualization instruments that allow user interactions: data selection (from the i2b2 DW), information retrieval (from the logical module) and graphical presentation of results (in the Dashboard).
The system has been designed as a Service Oriented Architecture, where components from different modules access the whole functionality of the system through Web services.
These components are linked in an asynchronous way through a message-oriented architecture and interact with each other over the Internet using Simple Object Access Protocol messages. The data-mining module components were developed using R and Matlab, and they communicate with the other components exchanging data in JavaScript Object Notation format. The technologies exploited to develop the graphical user interface (GUI) are based on JavaScript, Hypertext Markup Language, and Cascading Style Sheets. Communication occurs through asynchronous JavaScript and Extensible Markup Language requests. The technology used to create all the charts in the GUI was provided by Google Charts.
a. Data integration and warehousing
The data integration and repository module relies on the i2b2 DW43 and is devoted to gathering, integrating, and storing data from heterogeneous sources.
Clinical data for each patient are extracted from the hospital EHR, while administrative data are collected from the ATS DW. Identity matching is provided by the national fiscal code. Clinical and administrative data are preprocessed and loaded into the i2b2 DW through suitable extraction, transformation, and loading procedures, performed with the Pentaho data integration tool.44
Data are described by an ad hoc model, which takes into account the temporal qualitative description of data. According to the i2b2 structure, each clinical event (follow-up visit, hospitalization, laboratory test, or drug prescription) is represented as an encounter (an encoded patient visit number) in the i2b2 DW, provided with a start and end time and connected to the specific concepts related to that event.
b. Data-mining and query module
The data-mining module implements the predictive models and longitudinal analytics algorithms developed during the project to retrieve meaningful patterns in patient follow-ups and determine the distribution of complications in specific groups. The data-mining algorithms and tools are invoked by the query engine, a Java back-end service that retrieves data from the DW, calls the appropriate data-mining algorithm, and sends results back to the GUI.
The following models are implemented and integrated into the system:
Temporal abstractions (TAs)45 to extract qualitative temporal patterns from time series data. TAs are extracted using the Java Time Series Abstractor (JTSA) tool.46 JTSA offers a library of algorithms that can be used for time series preprocessing and abstraction. Thanks to JTSA’s modular structure, algorithms can be combined to form a workflow that, once executed by the JTSA engine, extracts arbitrarily complex patterns from time series data. The JTSA framework is grounded in a comprehensive ontology that models temporal entities, data types, and TA algorithms.45
The care flow mining algorithm (CFM)47 leverages the temporal sequence of patients’ events to identify the most frequent clinical pathways across the studied population. The algorithm that was exploited for patient stratification and electronic phenotyping48 detects frequent patterns from process events (eg, hospitalizations, encounters) and can therefore identify the clinical pathways that patients experience during the whole process of care, automatically creating clusters of patients with similar care histories.
Drug exposure pattern detection algorithms. Data gathered from administrative sources are exploited to trace patients’ behavioral patterns of drug purchases. The indicator selected to summarize purchasing patterns is the Proportion of Days Covered.49,50 This quantity can be calculated both for single active principles and for groups of drugs on the basis of the data stored in the i2b2 DW. Drug consumption patterns are used as a proxy for the complexity of clinical conditions, as also suggested in previous studies.51,52
Risk-prediction models of the onset of T2DM-related complications. We developed and validated multivariate predictive models53 to estimate the risk of developing microvascular complications (retinopathy, neuropathy, and nephropathy) tailored to the ICSM hospital population. Regarding macrovascular events, we used a risk score based on a validated version of the Framingham risk score adapted to the Italian population.54
c. GUI and the MOSAIC dashboard
The GUI was designed to cover 2 different scenarios of use, the first aimed at supporting clinicians and health care practitioners in their day-to-day activities, and the second at facilitating periodic reviews of the ICSM Diabetology service data. For both scenarios, decision support is delivered by a dashboard that presents results through visual analytics solutions. The functionalities of these scenarios, which we refer to as the clinical decision support system (CDSS) scenario and the outcome assessment and research system (ORSS) scenario, are presented in the next 2 paragraphs. Design of the system followed a user-centered technique, involving users and stakeholders in an iterative approach.55,56
Clinical decision support system
The CDSS helps care providers to explore patients’ temporal data and assess the risk of developing complications or disease progression. The CDSS dashboard is divided into 3 main sections, which summarize (1) metabolic control, (2) frequent temporal patterns, and (3) drug purchase patterns.
(i) Metabolic control evaluation and complications risk assessment
This section of the CDSS dashboard is based on a “traffic light” metaphor to allow quick assessment of the control level of specific parameters (see Figure 2). These are HbA1c, blood pressure, self-reported diet, body mass index (BMI), and the results of risk calculators for both macro- (cardiovascular) and microvascular complications. Traffic light colors describe the variables at the last follow-up visit. Green indicates normal values, yellow indicates values close to an alarm threshold, and red indicates values higher than the alert threshold. Thresholds are variable-specific and were defined based on clinical knowledge. Arrows and equal symbols next to the traffic lights indicate trends (increasing, decreasing, or stable) between the last 2 visits. If a complication has already been diagnosed for a patient, a red traffic light is shown and the onset date is displayed (see, eg, retinopathy and neuropathy in Figure 2).
Figure 2.

The traffic lights section of the CDSS dashboard. HbA1c, blood pressure, self-reported diet, BMI, and the results of risk calculators are shown. Traffic light highlight the situation of each metabolic control variable at the last follow-up. Thresholds are variable-specific and are defined based on clinical knowledge. Arrows and equal symbols next to the traffic lights indicate trends (increasing, decreasing, or stable) between the last 2 visits. If a complication has already been diagnosed for the patient, the onset date is displayed. Clicking on the “View Details” hyperlink enables visualization of the complete time series of the variables.
(ii) TAs and visualization of long-term complication episodes
TAs are an effective and compact way to identify and highlight temporal patterns in data, ranging from simple mapping of variables into meaningful intervals (so-called state abstractions) to more complex behaviors including trends and multivariable episodes. The TAs57,58 applied by the MOSAIC Clinical Care dashboard include:
TAs for diet: intervals of “good” or “bad” diet (as assessed after interviews by caregivers in follow-up visits) show if the patient has been following a correct (good) or an incorrect (bad) diet regimen and for how long.
TAs for weight: (i) time intervals in which the patient’s weight shows an increasing, decreasing, or stationary trend and (ii) time-to-target intervals, defined as the time interval from the first out-of-target value to the moment a patient reaches a specific weight target (Figure 3). The target weight loss is patient-specific and has been set as 10% of the patient’s baseline weight.
Figure 3.

Hba1c time series and weight TAs, as calculated by the JTSA module. The scatter plot shows the Hb1Ac measures during follow-ups. The timeline plot shows weight temporal abstractions. The upper time line indicates basic TA, which reports the intervals where measures increase, decrease, or stay steady. The bottom one indicates the time-to-target TAs, which report whether the patient’s weight has decreased by 10% in 6 months.
(iii) Drug purchases
The CDSS dashboard (see Figure 4) depicts all the purchases made by a patient for each drug class. This allows assessment of the regularity of purchase and highlighting of possible treatment changes or dosage modifications (as in the case of metformin in Figure 4 [OK?], where a dose adjustment took place at the end of 2008). The box under each graph reports the results of comparisons between the patient’s purchase behavior and that of all the other patients in the population purchasing the same drugs. Such comparisons are performed on the proportion of days covered value for a patient against the population over the entire observation period through a Wilcoxon test. For each patient, and for each of the purchased drugs, the result reports whether the patient behavior was in line with the rest of the population or if he/she displays a trend of purchasing more or less of a specific drug (P < .05).
Figure 4.

Drug purchase graphs. The graphs show drug purchases during the disease evolution, quantified with the DDD associated with each active principle. Gray boxes indicate whether the patient purchased larger or smaller quantities of the drug (with the arrow pointing up or down) compared to other patients who are treated with the same drug, and whether this difference is significant.
Outcome assessment and research support system
The ORSS is designed to support clinicians and researchers in getting an overview of the outcomes of the current treatments on the population of T2DM patients treated at the center, thus facilitating decision-making at the organizational level, as well as performing outcomes research studies.
The first section of the ORSS dashboard (Figure 5) presents charts that show patient counts grouped by demographic and clinical variables. The developed CFM is integrated into the data-mining module of the ORSS and extracts the most frequent clinical pathways from process and clinical data collected in the i2b2 DW. Clicking on a chart section, the CFM algorithm extracts the frequent care flows associated with a group of patients selected on the basis of medication purchases, cardiovascular risk evolution, and disease complexity stages.
Figure 5.

Summary charts of the ORSS dashboard. Charts show patient counts grouped by demographic variables, BMI, risk indexes, and HbA1c at the last visit, and complications distribution. The user starts from this view to run the CFM algorithm. By clicking on a chart section, the CFM mining algorithm extracts the care flows associated with the selected population, and in the following step it is possible to select and extract patients with similar temporal clinical patterns.
The algorithm output is visualized as timelines. Subgroups with similar health care trajectories are segments of the studied cohort that can be considered “temporal phenotypes.”47Figure 6 shows the mined level of complexity care flows, representing disease complexity stages: stable: no complication; first level: occurrence of the first complication; second level: occurrence of multiple complications; third level: hospitalization due to previous complications.
Figure 6.

CFM and drill-down results. Timeline graphs show the most frequent temporal patterns of the population selected in the previous step. In this figure, the patients are clustered on the basis of their level of complexity, which illustrates sequence and duration of stay in the different levels of disease evolution, as defined by the MOSAIC project. Clicking on each bar, the subcohort following the selected path is chosen. The drill-down results show the complication distributions of the patients belonging to the subcohort and the distributions of the times of stay in the complexity level.
The last step of the process is triggered when the user selects a specific cohort from one of the visualized care flows. For example, the user can choose to investigate one of the subcohorts defined by mining on level of complexity. The last section of the use case shows the drill-down results as the distribution of complications for the selected group of patients. On this page, the user can also select a specific complication and retrieve a list of patients exhibiting it.
EVALUATION OF THE DASHBOARD SYSTEM
The evaluation study was carried out by assessing (1) the impact on clinical activities of the CDSS with a pre-post approach and (2) the opinions of experts in focus groups about the usefulness of ORSS in supporting the activities of health care managers.
The different strategies for CDSS and ORSS components are motivated by the different health care processes the 2 systems are involved in. While the CDSS dashboard is deployed in standard outpatient practice at ICSM, the ORSS dashboard is designed for health care managers and policy-makers. Profiles of the health care professionals who used and evaluated the system are summarized in Table 1. Clinicians and focus group participants involved in the evaluation did not participate in the design and development of the system. Moreover, the 2 modules were evaluated by distinct groups of users.
Table 1.
Profiles of the users of CDSS and ORSS tools
| Dashboard Component | Numbers and type of users | Age | Years of professional experience | Type of expertise | IT literacy (self-evaluation) |
|---|---|---|---|---|---|
| CDSS (pre-post study) | Male = 3; female = 6 | 41 ± 15 | 13 ± 12 | Medical doctor | High = 2; medium = 5; low = 2 |
| ORSS (qualitative, based on focus groups) | Male = 1; female = 6 | 42 ± 9 | 14 ± 10 | Medical doctor, health care manager | High = 3; medium = 3; low = 1 |
In order to assess the behaviors of end users when interacting with both components of the dashboard, we also collected the systems’ log files for all users who took part in the evaluation.
Evaluation of the CDSS
Nine clinicians were monitored for 6 months for evaluation of the CDSS. In the first 3 months (September 15 to December 1, 2015), 352 T2DM patients were visited without the CDSS dashboard; in the second phase (December 1, 2015 to March 30, 2016), 353 T2DM patients were visited using the CDSS dashboard. During each visit, clinicians filed a report including visit duration, actions performed during the visit (whether they referred the patient for further screening exams to assess T2DM complications and/or specialist visits), changes in treatment (medications, physical activity, and diet), and time to the next follow-up visit.
The evaluation results are shown in Table 2, in which the parameters measured with and without the system are compared using a chi-squared test. (To exclude potential confounders related to the day of the week and work shifts, a multivariate mixed effects model was run for each of the outcome measures. None of the potential confounders was found to be significant.)
Table 2.
Visit counts for each measure defined to evaluate clinical action when supported or not by the MOSAIC system
| Without the system (n = 352) | With the system (n = 353) | P-value (chi-squared test) | |
|---|---|---|---|
| Visit duration | |||
| ≤25 min | 201 | 298 | ≪.01 |
| >25 min | 151 | 55 | |
| Screening exams for complications prescribed | |||
| Yes | 137 | 189 | .00013 |
| No | 215 | 164 | |
| Further lab tests prescribed | |||
| Yes | 340 | 341 | 1 |
| No | 12 | 12 | |
| Specialist visits prescribed | |||
| Yes | 19 | 27 | .29 |
| No | 333 | 326 | |
| Therapy change | |||
| Yes | 160 | 167 | .675 |
| No | 192 | 186 | |
| Physical activity intervention | |||
| Yes | 244 | 273 | .052 |
| No | 108 | 80 | |
| Diet intervention | |||
| Yes | 325 | 318 | .358 |
| No | 27 | 35 | |
| Time to next follow-up | |||
| ≤6months | 172 | 151 | .089 |
| >6months | 173 | 199 | |
Each variable has a binary value; when the measures were continuous (eg, in visit and time to next follow-up duration) thresholds were defined on the basis of routine clinical practice, guidelines, or median values. The last column reports P-values obtained using a chi-squared test to compare proportions of “positive” outcomes in the 2 scenarios (with and without the system).
The results reported in Table 2 show that, when the CDSS was used, visits were significantly shorter (P ≪ .01). This suggests that the opportunity to have a snapshot of the current patient status and of the temporal evolution of the disease helps to reduce visit duration, while avoiding time-consuming consultations of the EHR, especially for patients whose histories include several follow-up visits.
After the introduction of the system, more visits included prescriptions of screening exams for complications (P < .01). This result confirms that the system allows prompt identification of groups of patients who need specific interventions to screen for and prevent the onset of complications. This finding, however, should be carefully assessed after considering the results of the screening exams, in order to identify possible false positives to quantify the real accuracy of the system.
Interventions on physical activity increased from 69% during visits without the system to 77% during visits with the system. Even if not statistically significant (P = .053), this result is relevant, as information on physical activity was not easily accessible before the introduction of the system. Thanks to the traffic light section in the CDSS, this information is now efficiently conveyed (Figure 2), and patients who need an intervention can be immediately identified by clinicians.
Finally, the log files report use of the CDSS system for 55 days, for a total of 305 sessions. Each session corresponds to one clinician using the system for daily visits. Access to the CDSS sections was uniformly distributed: 30% metabolic control, 38% frequent temporal patterns, and 32% drug purchase patterns. Table 3 shows the statistics regarding CDSS usage during follow-ups, in terms of number of sessions per day, number of patients for each session, and number of patients per day. The results are in line with the MOSAIC evaluation study protocol, with a mean of about 8 MOSAIC patients per day, and 1 or 2 patients visited during each session.
Table 3.
Distribution of sessions for CDSS use (number, number of patients per day and per session)
| Mean (sd) | Min | Max | |
|---|---|---|---|
| Number of sessions per day | 5.35 (2.79) | 1 | 14 |
| Number of patients per session | 1.56 (1.38) | 0 | 9 |
| Number of patients per day | 8.34 (4.59) | 1 | 28 |
ORSS assessment through a focus group
The ORSS was used to assess the entire ICSM cohort over time. Given that the system was designed for health care managers, we evaluated it through a focus group, which included a small number of qualified experts. We qualitatively assessed the results of their discussion. Two discussion sessions were held involving a focus group composed of 4 clinicians from the ICSM hospital and 3 health policy makers from the Pavia ATS (described in Table 1).
The results of the meetings are summarized in Table 4. In this table, we report the main points that were raised during the discussion and descriptions of the main findings related to each one.
Table 4.
ORSS discussions points
| Discussion point | System functionalities, examples of their use, and findings |
|---|---|
| Usefulness of the tool to inspect specific clinical questions | The drill-down functionality (Figure 6) allows identification of subjects not compliant with guidelines and inspection of their individual data using the CDSS. |
| Example: Analysis of patients who experienced a myocardial infarction (starting from their slice on the general charts page of the MOSAIC tool). Such patients should be treated with lipid-lowering drugs, but the analysis of the treatment histories revealed that some of them were not. | |
| Results: Thanks to this functionality, health care managers discussed reasons for noncompliance and planned an in-depth study of the issue, also leveraging the CDSS. | |
| Analysis of disease progression through care flows | The CFM functionality (Figure 6) allows identification of frequent clinical pathways and their temporal features in the population of patients treated at the hospital. |
| Example: Analysis of subjects who experienced progression at a similar level of complexity. First, users considered the question of what distinguished patients who remained stable from those who did not. Then they considered in more detail patients who reached the highest complexity level, to understand how much time passed between the second complication and hospitalization. | |
| Results: Thanks to this functionality, users can identify and understand the characteristics of subgroups of patients (temporal phenotypes) treated at the center. | |
| Comparison of the patient population at 2 different time points | The Summary Charts functionality (Figure 5) allows assessment of the patient population at different time points. |
| Example: A comparison of the patient population between the start and the end of the highlighted validation period showed: | |
| |
| Results: One hypothesis formulated by the experts to explain the increase of cardiovascular risk was that, when the CDSS was used, patients who seemed to have more severe conditions were prescribed additional exams that turned out to confirm an increased risk level. The second example can be a consequence of the significant increase in the number of physical activity interventions during the evaluation period. Both of these results are consistent with the CDSS outcomes data showing that patients were prescribed more screening exams and lifestyle interventions during system usage. |
The ORSS log files, collected during focus group meetings, allowed information to be acquired about the number of times users accessed the main menu options, and the use of filters selected for the analyses. Gender and cardiovascular risks were almost never used as filters, while age at diagnosis, BMI, and complications were used at equal rates. For the filter on age, the most selected ranges were 40–50 and 50–60 years; the categories of overweight and severe obesity were explored through the BMI filter, whereas macrovascular complications was the category most frequently inspected.
DISCUSSION
Modern health IT infrastructures based on data integration and analytics allow effective coupling of decision support with outcomes research. Integrated data repositories, designed for data mining and retrieval, are crucial instruments to effectively implement the learning health care system cycle, enabling the introduction of clinical data in outcomes research and, at the same time, the translation of research findings into care to better inform clinicians about patients’ behavior and guide their decision-making.59 Designing dashboard-based infrastructure is an important approach to fully exploit collected data, enabling fast visual analytics,60 which speeds up the decision-making process, in the context of both clinical care and retrospective data analysis. In our work, we applied these concepts in the context of T2DM management.
To the best of our knowledge, the MOSAIC system is one of the first examples of a tool that integrates results from research on previously collected data to support clinical decision-making during the care process. The models integrated into the system go beyond basic statistical analysis and include predictive models and advanced temporal data-mining solutions previously validated on routinely collected clinical and administrative data.
This paper illustrates the solutions developed for T2DM specialist care, which are only a part of the whole MOSAIC project. The developed system also includes a tool for predicting and preventing T2DM onset61,62 that was tested with health care professionals and in a primary care context. Within the MOSAIC project, we designed and implemented a DSS with 2 components, one to support visit-by-visit decision-making (CDSS), and one to support long-term DM center revision and potentially outcomes research (ORSS). The system allows specialist medical doctors and health care managers to fully exploit all the information coming from local health care agencies and primary care practices (ie, drug purchases, outpatient visits, screening exams) when making decisions, and sets the basis for creating a link between research, clinical practice, and administrative procedures.
The evaluation carried out in the clinical settings showed a significant decrease in the duration of visits, which has an impact on increasing the efficiency of the care process. Thus, the implemented system allows clinicians to focus their attention on the most critical aspects of each patient and to optimize visit duration on the basis of the complexity of the patient’s state. The system is able to highlight new information, thanks to the integration of different data sources, including clinical and administrative data. This integration has allowed clinicians to have access to information that is not available through the standard EHR (eg, data on drug purchases) and to visualize already available information in a more informative way (eg, traffic lights and time-oriented overviews of multiple clinical aspects).
In order to plan future versions of our system, we are currently taking into account the usability aspects. As a preliminary step, we have asked 4 users to assess all of the system functionalities, including CDSS and ORSS components of the dashboard, by completing the system usability scale63 and Attrakdiff questionnaires.64 Three users were already involved in the evaluation of the CDSS (2 medical doctors) and the ORSS (1 health care manager). The last participant (a graphic designer) was enrolled only for this test. Attrakdiff questionnaires scores were >3.5 for pragmatic quality, stimulation, and identification, and >3 for attractiveness, on a scale of 0 to 4.5, while the score of the system usability scale was 79.32, which equates to a percentile rank of 80%. This preliminary study confirms that the dashboard, although well designed, can be improved by implementing a more detailed human-computer interaction study. We are aware of other limitations of the present work. First, the system was evaluated to test its impact on the patient management process, but it was not possible to assess any clinical outcomes. This issue is related to the time span of T2DM evolution, which is longer than the available evaluation period. A dedicated prospective study to evaluate specific clinical outcomes is currently being designed.
Regarding the implementation of a similar system in other health care settings, it should be pointed out that some of its core features rely on an agreement among several health care institutions to share data on specific patients. Thus, this is a constraint that must be satisfied in order to exploit the system in a different setting. If data from administrative sources are not available, one option could be to include self-monitored information from patients, such as data collected through activity or medication tracking devices.
In terms of results generalization, it must be noted that the involved clinicians came from the same hospital and their number was limited. Moreover, the activity indicators were self-measured by clinicians without an independent assessment. Therefore, our quantitative evaluation must be seen as a proof-of-principle to demonstrate the potential of an advanced IT system based on heterogeneous data integration and advanced analytics.
Furthermore, it is worth noting that the tool was evaluated in the setting of a diabetes specialty clinic. This necessarily limits the generalizability of the findings to primary care, which would probably require revising the system design and the evaluation strategy.
Looking at future developments, the Lombardy region in Italy started a continuity of care program for highly complex chronic patients delivered by hospital providers. As the MOSAIC dashboard concepts and results closely match the aims of this program, the framework will be adequately modified and exploited to support this institutional intervention. The MOSAIC system will therefore be redesigned to manage other chronic diseases (eg, heart failure, pulmonary disease) and the dashboard will be improved in terms of visual analytics and information delivery.
Our experience shows that the developed framework represents a general model that can be successfully applied not only in T2DM management specialty clinics, but also to the majority of chronic diseases, since it is able to support all clinical decision-making processes, including diagnosis, therapy planning, and disease monitoring, and can be used in a coordinated fashion to improve the scientific discovery process.
COMPETING INTERESTS
RB is a shareholder of Biomeris srl, which designs software to support clinical research.
FUNDING
This work was supported by the European Union in the Seventh Framework Programme, grant number 600914.
CONTRIBUTORS
AD: developed the analytics models and participated in their integration into the system and evaluation under the supervision of LS, drafted the manuscript. LS: participated in the development of the analytics models and their integration into the system and evaluation, drafted and revised the manuscript. VTi: participated in the project software interface and architecture development; GC and MT: participated in data acquisition, model results interpretation, and clinical evaluation; AMM, VTr, and DS: participated in the project software design and architecture development; JP: participated in the design of the work, coordinated delivery of the system; MO: participated in the system usability validation strategy and implementation; GF and MTA: participated in conception and design of the system, developed the evaluation strategy; PC and LC: provided the data and the medical knowledge. LC revised the manuscript. RB: conceived of the system architecture design, participated in the project functional analysis and coordination. critically revised the manuscript and approved the version to be published.
ACKNOWLEDGMENTS
The study protocol was approved by the ICSM Ethics Committee (ID# 2100 CE). We acknowledge all MOSAIC partners for their help and support. We would like to thank Dr Alberto Riva for his precious help in editing the manuscript.
REFERENCES
- 1. Wagholikar KB, Mandel JC, Klann JG et al. , SMART-on-FHIR implemented over i2b2. J Am Med Inform Assoc. 2017;242:398–402. [DOI] [PMC free article] [PubMed] [Google Scholar]
- 2. Sim I, Gorman P, Greenes RA et al. , Clinical decision support systems for the practice of evidence-based medicine. J Am Med Inform Assoc. 2001;86:527–34. [DOI] [PMC free article] [PubMed] [Google Scholar]
- 3. Palmer AJ, Roze S, Valentine WJ et al. , The CORE Diabetes Model: Projecting long-term clinical outcomes, costs and cost-effectiveness of interventions in diabetes mellitus (types 1 and 2) to support clinical and reimbursement decision-making. Curr Med Res Opin. 2004;20(Suppl 1):S5–26. [DOI] [PubMed] [Google Scholar]
- 4. O’Connor PJ, Bodkin NL, Fradkin J et al. , Diabetes performance measures: current status and future directions. Diabetes Care. 2011;347:1651–59. [DOI] [PMC free article] [PubMed] [Google Scholar]
- 5. Donsa K, Beck P, Höll B et al. , Impact of errors in paper-based and computerized diabetes management with decision support for hospitalized patients with type 2 diabetes. A post-hoc analysis of a before and after study. Int J Med Inform. 2016;90:58–67. [DOI] [PubMed] [Google Scholar]
- 6. Sáenz A, Brito M, Morón I et al. , Development and validation of a computer application to aid the physician’s decision-making process at the start of and during treatment with insulin in type 2 diabetes: a randomized and controlled trial. J Diabetes Sci Technol. 2012;63:581–88. [DOI] [PMC free article] [PubMed] [Google Scholar]
- 7. Tan X, Zhang D, Yu S, Qin J. [Computer-assisted screening system for individualized treatment of type 2 diabetes mellitus]. Nan Fang Yi Ke Da Xue Xue Bao. 2010;309:2134–38. [PubMed] [Google Scholar]
- 8. Toussi M, Ebrahiminia V, Le Toumelin P, Cohen R, Venot A. An automated method for analyzing adherence to therapeutic guidelines: application in diabetes. Stud Health Technol Inform. 2008;136:339–44. [PubMed] [Google Scholar]
- 9. Liu H, Xie G, Mei J, Shen W, Sun W, Li X. An efficacy driven approach for medication recommendation in type 2 diabetes treatment using data mining techniques. Medinfo 2013 Proc 14th World Congr Med Heal Informatics. 2013;192(Pt 12):1071. [PubMed] [Google Scholar]
- 10. Ampudia-Blasco FJ, Benhamou PY, Charpentier G et al. , A decision support tool for appropriate glucose-lowering therapy in patients with type 2 diabetes. Diabetes Technol Ther. 2015;173:194–202. [DOI] [PMC free article] [PubMed] [Google Scholar]
- 11. Lim S, Kang SM, Shin H et al. , Improved glycemic control without hypoglycemia in elderly diabetic patients using the ubiquitous healthcare service, a new medical information system. Diabetes Care. 2011;342:308–13. [DOI] [PMC free article] [PubMed] [Google Scholar]
- 12. Lipton JA, Barendse RJ, Akkerhuis KM, Schinkel AFL, Simoons ML. Evaluation of a clinical decision support system for glucose control: impact of protocol modifications on compliance and achievement of glycemic targets. Crit Pathways Cardiol A J Evidence-Based Med. 2010;93:140–47. [DOI] [PubMed] [Google Scholar]
- 13. Neubauer KM, Mader JK, Höll B et al. , Standardized glycemic management with a computerized workflow and decision support system for hospitalized patients with type 2 diabetes on different wards. Diabetes Technol Ther. 2015;1710:685–92. [DOI] [PMC free article] [PubMed] [Google Scholar]
- 14. Rodbard D, Vigersky RA. Design of a decision support system to help clinicians manage glycemia in patients with type 2 diabetes mellitus. J Diabetes Sci Technol. 2011;52:402–11. [DOI] [PMC free article] [PubMed] [Google Scholar]
- 15. Augstein P, Vogt L, Kohnert K.-D, Heinke P, Salzsieder E. Translation of personalized decision support into routine diabetes care. J Diabetes Sci Technol. 2010;46:1532–39. [DOI] [PMC free article] [PubMed] [Google Scholar]
- 16. Peleg M, Wang D, Fodor A, Keren S, Karnieli E. Lessons learned from adapting a generic narrative diabetic-foot guideline to an institutional decision-support system. Stud Health Technol Inform. 2008;139:243–52. [PubMed] [Google Scholar]
- 17. Reza AW, Eswaran C. A decision support system for automatic screening of non-proliferative diabetic retinopathy. J Med Syst. 2011;351:17–24. [DOI] [PubMed] [Google Scholar]
- 18. Kumar SJJ, Madheswaran M. An improved medical decision support system to identify the diabetic retinopathy using fundus images. J Med Sys. 2012;366:3573–81. [DOI] [PubMed] [Google Scholar]
- 19. Mitsch C, Fehre K, Prager S, Scholda C. Clinical decision support for the classification of diabetic retinopathy: a comparison. Stud Health Technol Inform. 2016;223:17–24. [PubMed] [Google Scholar]
- 20. Cho BH, Yu H, Kim KW, Kim TH, Kim IY, Kim SI. Application of irregular and unbalanced data to predict diabetic nephropathy using visualization and feature selection methods. Artif Intell Med. 2008;421:37–53. [DOI] [PubMed] [Google Scholar]
- 21. Cleveringa FGW, Gorter KJ, van den Donk M, Rutten GEHM. Combined task delegation, computerized decision support, and feedback improve cardiovascular risk for type 2 diabetic patients: a cluster randomized trial in primary care. Diabetes Care. 2008;3112:22737–5. [DOI] [PMC free article] [PubMed] [Google Scholar]
- 22. Häussler B, Fischer GC, Meyer S, Sturm D. Risk assessment in diabetes management: how do general practitioners estimate risks due to diabetes? Qual Saf Health Care. 2007;163:208–12. [DOI] [PMC free article] [PubMed] [Google Scholar]
- 23. Barlow J, Krassas G. Improving management of type 2 diabetes: findings of the Type2Care clinical audit. Aust Fam Physician. 2013;421:57–60. [PubMed] [Google Scholar]
- 24. Ziemer DC, Tsui C, Caudle J, Barnes CS, Dames F, Phillips LS. An informatics-supported intervention improves diabetes control in a primary care setting. AMIA Annu Symp Proc. 2006;1160. [PMC free article] [PubMed] [Google Scholar]
- 25. Heselmans A, Van de Velde S, Ramaekers D, Vander Stichele R, Aertgeerts B. Feasibility and impact of an evidence-based electronic decision support system for diabetes care in family medicine: protocol for a cluster randomized controlled trial. Implement Sci. 2013;81:83. [DOI] [PMC free article] [PubMed] [Google Scholar]
- 26. Koopman RJ, Kochendorfer KM, Moore JL et al. , A diabetes dashboard and physician efficiency and accuracy in accessing data needed for high-quality diabetes care. Ann Fam Med. 2011;95:398–405. [DOI] [PMC free article] [PubMed] [Google Scholar]
- 27. Bødker K, Granlien MF. Computer support for shared care of diabetes: findings from a Danish case. Stud Health Technol Inform. 2008;136:389–94. [PubMed] [Google Scholar]
- 28. den Ouden H, Vos RC, Reidsma C, Rutten GE. Shared decision making in type 2 diabetes with a support decision tool that takes into account clinical factors, the intensity of treatment and patient preferences: design of a cluster randomised (OPTIMAL) trial. BMC Fam Pract. 2015;161:27. [DOI] [PMC free article] [PubMed] [Google Scholar]
- 29. Holbrook A, Thabane L, Keshavjee K et al. , Individualized electronic decision support and reminders to improve diabetes care in the community: COMPETE II randomized trial. CMAJ. 2009;181(1–2):37–44. [DOI] [PMC free article] [PubMed] [Google Scholar]
- 30. Liu H, Mei J, Xie G. Towards collaborative chronic care using a clinical guideline-based decision support system. Stud Health Technol Inform. 2012;180:492–96. [PubMed] [Google Scholar]
- 31. Welch G, Zagarins SE, Santiago-Kelly P et al. , An internet-based diabetes management platform improves team care and outcomes in an urban latino population. Diabetes Care. 2015;384:561–67. [DOI] [PMC free article] [PubMed] [Google Scholar]
- 32. O’Reilly D, Holbrook A, Blackhouse G, Troyan S, Goeree R. Cost-effectiveness of a shared computerized decision support system for diabetes linked to electronic medical records. J Am Med Inform Assoc. 2012;193:341–45. [DOI] [PMC free article] [PubMed] [Google Scholar]
- 33. Parker RF, Mohamed AZ, Hassoun SA, Miles S, Fernando DJ. The effect of using a shared electronic health record on quality of care in people with type 2 diabetes. J Diabetes Sci Technol. 2014;85:1064–65. [DOI] [PMC free article] [PubMed] [Google Scholar]
- 34. Caban JJ, Gotz D. Visual analytics in healthcare: opportunities and research challenges. J Am Med Inform Assoc. 2015;222:260–62. [DOI] [PMC free article] [PubMed] [Google Scholar]
- 35. Mick J. Data-driven decision making. J Nurs Adm. 2011;4110:391–93. [DOI] [PubMed] [Google Scholar]
- 36. Batley NJ, Osman HO, Kazzi AA, Musallam KM. Implementation of an emergency department computer system: design features that users value. J Emerg Med. 2011;416:693–700. [DOI] [PubMed] [Google Scholar]
- 37. Sprague AE, Dunn SI, Fell DB et al. , Measuring quality in maternal-newborn care: developing a clinical dashboard. J Obs Gynaecol Can. 2013;351:29–38. [DOI] [PubMed] [Google Scholar]
- 38. Wilbanks BA, Langford PA. A review of dashboards for data analytics in nursing. Comput Inform Nurs. 2014;3211:545–49. [DOI] [PubMed] [Google Scholar]
- 39. Hartzler AL, Izard JP, Dalkin BL, Mikles SP, Gore JL. Design and feasibility of integrating personalized PRO dashboards into prostate cancer care. J Am Med Inform Assoc. 2016;231:38–47. [DOI] [PMC free article] [PubMed] [Google Scholar]
- 40. Ratwani RM, Fong A. ‘Connecting the dots’: leveraging visual analytics to make sense of patient safety event reports. J Am Med Inform Assoc. 2015;222:312–17. [DOI] [PMC free article] [PubMed] [Google Scholar]
- 41. Dixon BE, Jabour AM, Phillips EO, Marrero DG. An informatics approach to medication adherence assessment and improvement using clinical, billing, and patient-entered data. J Am Med Inform Assoc. 2014;213:517–21. [DOI] [PMC free article] [PubMed] [Google Scholar]
- 42. Wertheimer AI. The defined daily dose system (DDD) for drug utilization review. Hosp Pharm. 1986;213:233–34, 239–41, 258. [PubMed] [Google Scholar]
- 43. Murphy SN, Weber G, Mendis M et al. , Serving the enterprise and beyond with informatics for integrating biology and the bedside (i2b2). J Am Med Inform Assoc. 2010;172:124–30. [DOI] [PMC free article] [PubMed] [Google Scholar]
- 44.Penthao. No Title. [Online]. www.pentaho.com/product/data-integration. Accessed November 13, 2017.
- 45. Shahar Y, Musen MA. Knowledge-based temporal abstraction in clinical domains. Artif Intell Med. 1996;83:267–98. [DOI] [PubMed] [Google Scholar]
- 46. Sacchi L, Capozzi D, Bellazzi R, Larizza C. JTSA: an open source framework for time series abstractions. Comput Methods Programs Biomed. 2015;1213:175–88. [DOI] [PubMed] [Google Scholar]
- 47. Dagliati A. Temporal electronic phenotyping by mining careflows of breast cancer patients. J Biomed Inf. 2017;66:136–47. [DOI] [PubMed] [Google Scholar]
- 48. Hripcsak G, Albers DJ. Next-generation phenotyping of electronic health records. J Am Med Inform Assoc. 2012;201:117–21. [DOI] [PMC free article] [PubMed] [Google Scholar]
- 49. Nau DP. Proportion of days covered (PDC) as a preferred method of measuring medication adherence. Pharm Qual Alliance. 2006;2012:1–3. [Google Scholar]
- 50. Bijlsma MJ, Janssen F, Hak E. Estimating time-varying drug adherence using electronic records: extending the proportion of days covered (PDC) method. Pharmacoepidemiol Drug Saf. 2016;253:325–32. [DOI] [PubMed] [Google Scholar]
- 51. Robusto F, Lepore V, D’Ettorre A et al. , The drug derived complexity index (DDCI) predicts mortality, unplanned hospitalization and hospital readmissions at the population level. PLoS One. 2016;112:e0149203. [DOI] [PMC free article] [PubMed] [Google Scholar]
- 52. De Berardis G, D’Ettorre A, Graziano G et al. , The burden of hospitalization related to diabetes mellitus: a population-based study. Nutr Metab Cardiovasc Dis. 2012;227:605–12. [DOI] [PubMed] [Google Scholar]
- 53. Dagliati A, Marini S, Sacchi L et al. , Machine learning methods to predict diabetes complications. J Diabetes Sci Technol. 2017. [DOI] [PMC free article] [PubMed] [Google Scholar]
- 54. Palmieri L, Panico S, Vanuzzo D et al. , Evaluation of the global cardiovascular absolute risk: the Progetto CUORE individual score. Ann Ist Super Sanita. 2004;404:393–99. [PubMed] [Google Scholar]
- 55. van Gemert-Pijnen JE, Nijland N, van Limburg M et al. , A holistic framework to improve the uptake and impact of eHealth technologies. J Med Internet Res. 2011;134:e111. [DOI] [PMC free article] [PubMed] [Google Scholar]
- 56. Fico G, Arredondo MT. Use of an holistic approach for effective adoption of user-centred-design techniques in diabetes disease management: experiences in user need elicitation. Conf Proc IEEE Eng Med Biol Soc. 2015;2015:2139–42. [DOI] [PubMed] [Google Scholar]
- 57. Sacchi L, Capozzi D, Bellazzi R, Larizza C. JTSA: an open source framework for time series abstractions. Comput Methods Programs Biomed. 2015;1213:175–88. [DOI] [PubMed] [Google Scholar]
- 58. Shahar Y. A framework for knowledge-based temporal abstraction. Artif Intell. 1997;90(1–2):79–133. [Google Scholar]
- 59. Tenenbaum JD, Avillach P, Benham-Hutchins M et al. , An informatics research agenda to support precision medicine: seven key areas. J Am Med Inform Assoc. 2016;234:791–95. [DOI] [PMC free article] [PubMed] [Google Scholar]
- 60. Bottomly D, McWeeney SK, Wilmot B. HitWalker2: visual analytics for precision medicine and beyond. Bioinformatics. 2016;328:1253–55. [DOI] [PMC free article] [PubMed] [Google Scholar]
- 61. Fabris C, Facchinetti A, Fico G et al. , Parsimonious description of glucose variability in type 2 diabetes by sparse principal component analysis. J Diabetes Sci Technol. 2016;101:119–24. [DOI] [PMC free article] [PubMed] [Google Scholar]
- 62. Martinez-Millana A, Fernandez-Llatas C, Sacchi L et al. , From data to the decision: a software architecture to integrate predictive modeling in clinical settings. Proceedings of the Annual International Conference of the IEEE Engineering in Medicine and Biology Society. 2015;2015:8161–64. [DOI] [PubMed] [Google Scholar]
- 63. Brooke J. SUS – A quick and dirty usability scale. Usability Eval Ind. 1996;189194:4–7. [Google Scholar]
- 64. Hassenzahl M, Wiklund-Engblom A, Bengs A, Hägglund S, Diefenbach S. Experience-oriented and product-oriented evaluation: psychological need fulfillment, positive affect, and product perception. Intl J Human-Computer Interact. 2015;31):530–44. [Google Scholar]