Abstract
Objective
The study sought to assess the feasibility of nationwide chronic disease surveillance using data aggregated through a multisite collaboration of customers of the same electronic health record (EHR) platform across the United States.
Materials and Methods
An independent confederation of customers of the same EHR platform proposed and guided the development of a program that leverages native EHR features to allow customers to securely contribute de-identified data regarding the prevalence of asthma and rate of asthma-associated emergency department visits to a vendor-managed repository. Data were stratified by state, age, sex, race, and ethnicity. Results were qualitatively compared with national survey-based estimates.
Results
The program accumulated information from 100 million health records from over 130 healthcare systems in the United States over its first 14 months. All states were represented, with a median coverage of 22.88% of an estimated state’s population (interquartile range, 12.05%-42.24%). The mean monthly prevalence of asthma was 5.27 ± 0.11%. The rate of asthma-associated emergency department visits was 1.39 ± 0.08%. Both measures mirrored national survey-based estimates.
Discussion
By organizing the program around native features of a shared EHR platform, we were able to rapidly accumulate population level measures from a sizeable cohort of health records, with representation from every state. The resulting data allowed estimates of asthma prevalence that were comparable to data from traditional epidemiologic surveys at both geographic and demographic levels.
Conclusions
Our initiative demonstrates the potential of intravendor customer collaboration and highlights an organizational approach that complements other data aggregation efforts seeking to achieve nationwide EHR-based chronic disease surveillance.
Keywords: Electronic health record, asthma, surveillance, chronic disease
INTRODUCTION
The Health Information Technology for Economic and Clinical Health Act of 2009 catalyzed the widespread adoption of electronic health records (EHRs) in the United States.1 As of 2015, 96% of nonfederal acute care hospitals and nearly 78% of office-based practices in the United States had adopted EHRs certified by the Office of the National Coordinator for Health Information Technology.2 These ever-expanding repositories of health data hold the potential for complementing traditional approaches to population health research and disease surveillance at a national level. The largest barrier to realizing this potential has been the lagging development of processes that would allow for the efficient, timely, and meaningful aggregation of data from disparate sources.3 Health information exchanges (HIEs) have continued to mature beyond their primary goal of serving individual stakeholders, but the development of public health surveillance programs has been hampered by technological and resource limitations at the local level and the absence of a coordinated strategy at the national level.4,5 Even with efforts by the Centers for Medicare and Medicaid Services to incentivize healthcare systems for meeting standards of public health data reporting,6,7 the goal of universal data exchange and aggregation for public health reporting, surveillance, and research purposes remains elusive to date.8,9
Despite ongoing challenges to meaningful data aggregation, at least two localized efforts in the United States have gained traction in achieving chronic disease surveillance with EHR generated data.10 NYC Macroscope is a surveillance system that can query more than 700 primary care provider practices using the same EHR platform, with cumulative coverage of approximately 1.5 million individuals in New York City.11,12 MDPHnet is a collaboration that allows officials to query data from more than 1 EHR platform across different health systems, covering more than 1 million individuals in the state of Massachusetts.13,14 Both programs reported reasonable success in achieving chronic disease prevalence estimates that mirrored the results of well-established local survey data and declared EHR-based disease surveillance feasible.12,14–16 While the cost of the development of either program was not explicitly stated, both programs required significant new partnerships, third party support and external funding to achieve their goals.11,13 Owing primarily to substantial financial and human capital constraints at the level of local health departments, the ability to successfully scale such approaches across the nation is in question.17
To facilitate the compilation and exchange of EHR data between multiple healthcare systems, an independent group of customers of the same EHR platform repurposed native EHR functions to develop a mechanism that allowed institutions to aggregate and submit de-identified patient data to a vendor-managed repository. The resulting collaborative, the Aggregate Data Program (ADP), eliminated the need for additional third-party hardware or software and greatly simplified participation in the ADP. Because all customers use the same base data model and the vendor provided the automated query for the data pull as part of its base code set, customers wanting to contribute data merely needed to sign an agreement allowing their de-identified population-level data to be automatically queried and aggregated.
The first product of the ADP collaboration is a dataset on asthma prevalence and asthma-associated emergency department (ED) utilization. Herein, we describe the structure and function of the program and the size and geographic extent of the population the program ultimately covered. In order to characterize the quality of the data produced, ADP data are qualitatively compared with traditional survey-based national estimates of asthma prevalence and rates of asthma-associated ED visits, with stratification along geographic and demographic subgroups for the former. We then discuss the distinguishing features, advantages, and limitations of this approach in comparison with other chronic disease surveillance efforts.
MATERIALS AND METHODS
Program governance and structure
Program governance is through the ADP Data Governing Council elected by and from participating organizations. Any U.S. healthcare organization using the Epic EHR (Epic Systems, Verona, WI) was eligible to contribute de-identified data to the ADP. Customers and institutions were not charged for participation and did not receive any financial incentives from the vendor to partake in the development of the program, nor was there an incentive from the vendor for institutions that contributed data. Organizations submitting data to the ADP registry benefited from potentially qualifying for Centers for Medicare and Medicaid Services incentives for specialized registry reporting and were allowed access to ADP data for research purposes. Any resulting studies and manuscripts (including this one) required unanimous approval by the independent members of the ADP Data Governing Council to confirm compliance with the program’s bylaws. The last major revision of this manuscript was submitted to the members of the Council, with no objections to its dissemination registered.
Data collection and aggregation mechanism
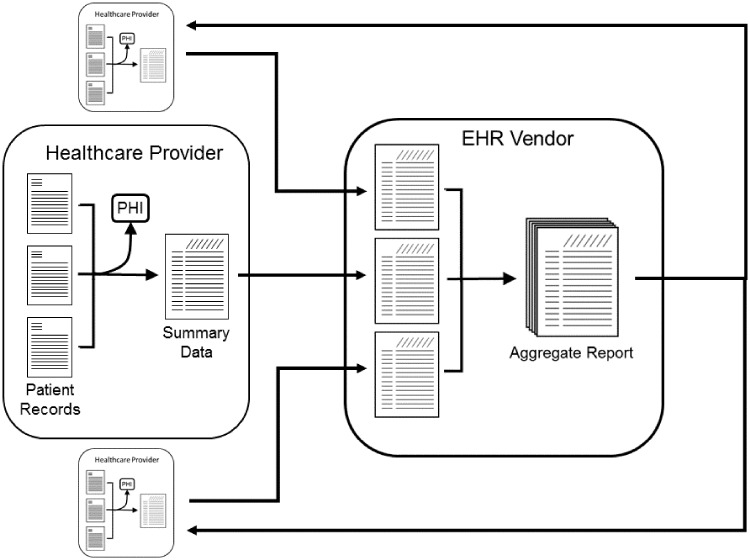
Existing query functionality of the EHR platform is used to generate de-identified population level data for a participating healthcare system, extracted from standard, common data fields. This data is then securely transmitted through a pre-existing EHR embedded, Health Insurance Portability and Accountability Act–compliant data transfer mechanism to a centralized, secure server administered by the vendor (Figure 1). Any summary level with fewer than 10 patients is not transmitted as a further privacy protection. Population level data from each participating healthcare system is then pooled into a single dataset without any record of the contributing organization's identity. Datasets were contributed monthly.
Figure 1.
Conceptual schematic of aggregated population data-sharing methodology. EHR: electronic health record; PHI: protected health information.
Definition of asthma in the ADP
The ADP dataset described here summarizes asthma prevalence and the rate of asthma-associated ED visits in participating organizations. The prevalence data counts active patients in participating organizations and the subset of those patients with asthma. A patient was considered active if they were not deceased and had an EHR encounter documented during the preceding 24 months. Patients were considered to have “treated” asthma if any of the following criteria were met during the preceding year: (1) an encounter or billing diagnosis of asthma, (2) an active asthma diagnosis on the patient's problem list, or (3) a health maintenance modifier (a property or tag attributed by a clinician) indicating a diagnosis of asthma. An asthma diagnosis was defined as any International Classification of Diseases diagnosis mapped in the EHR to the SNOMED-CT (Systematized Nomenclature of Medicine - Clinical Terms)18 concept for asthma or any of its child concepts. The ED data comprises counts of ED visits with a principal encounter diagnosis of asthma and of all ED visits, both for the preceding 12 months. Prevalence data were summarized by age, sex, race, ethnicity, and geographic location at the state level. The data presented here were collected between September 2016 and November 2017.
Comparison data
Traditional epidemiological survey data on asthma are presented for comparison. National data on the prevalence of asthma is publicly available from the National Health Interview Survey (NHIS) conducted by the National Center for Health Statistics of the Centers for Disease Control and Prevention (CDC).19 The comparative NHIS data available was for January through June of 2017. State level data was obtained from the Behavior Risk Factors Surveillance System (BRFSS).20 Data on ED visits was obtained from the National Hospital Ambulatory Medical Care Survey (NHAMCS).21 BRFSS reported data up to 2016 and NAHMCS reported data into 2015 at the time of the study. State population estimates are from the U.S. Census Bureau for July 2016.22
Asthma prevalence is measured in two ways for the CDC survey data presented here. “Current” asthma is counted when the following questions are both answered affirmatively: “Have you ever been told by a doctor or other health professional that you have asthma?” and “Do you still have asthma?” The second measure of asthma prevalence in CDC surveys is “active” asthma, which is counted when an affirmative answer is given to the question “During the past 12 months, have you had an episode of asthma or an asthma attack?”
Statistical approach
Descriptive statistics were used to illustrate ADP asthma prevalence measures over time, and within previously defined subgroups. When data from multiple months are combined, the reported mean is weighted by the active patient population for that period. As the data are not a well-defined random sample, statistical inference of confidence intervals was not conducted. Standard deviation of the monthly prevalence is reported with means as a measure of dispersion. The geographic coverage of the ADP dataset was estimated by dividing the active patient population for each state by the U.S. Census Bureau July 2016 estimate of that state’s population.22 To evaluate geographic variation, absolute differences between the ADP and 2016 BRFSS adult asthma prevalence estimates were compared at the state level. In a post hoc analysis, a scatter plot was constructed to demonstrate the relationship between the ADP and BRFSS differences and relative program penetration by state. The relationship was also illustrated by a locally estimated scatterplot smoother (loess) function that was overlaid on the same figure. All analyses for this study were conducted in R (version 3.5.1),23 and figures generated using the ggplot2 package.24
No Institutional Review Board approval was sought or obtained for this study and analysis because it involved only population level de-identified data. This study was approved by the independent ADP Data Governing Council made up of representatives of healthcare systems contributing data to the ADP. While input from Epic Systems staff was solicited to ensure an accurate representation of the ADP, neither Epic Systems nor its employees had a role in the approval of this study or the resulting manuscript.
RESULTS
Program scale
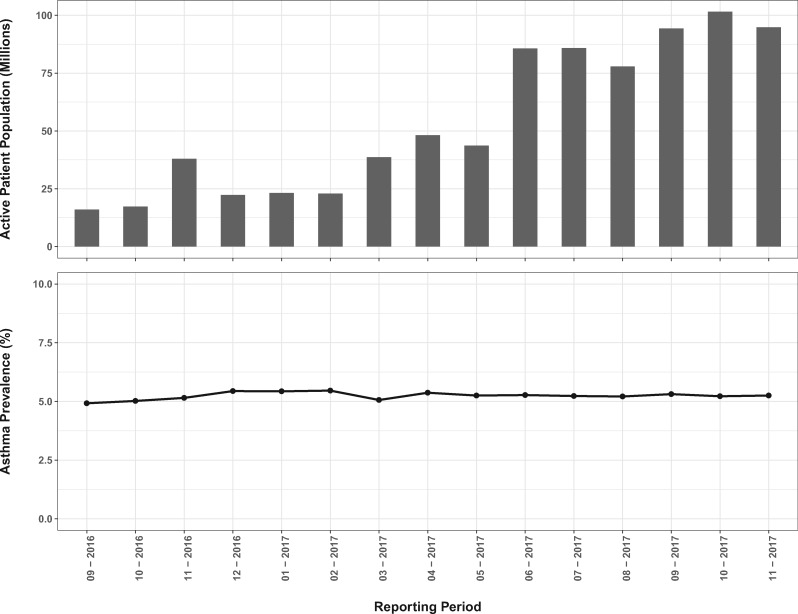
The absolute size of the number of patients in the ADP asthma dataset trended upward from its inception in September 2016, when the active patient population was lowest at just under 16 million (Figure 2). It passed 100 million in October of 2017. All fifty states were represented. California had the largest peak active patient count, 11.8 million, followed by Ohio at 8.7 million and Texas at 8.3 million. Rhode Island had the smallest peak active patient count of 4447.
Figure 2.
The total number of patient records aggregated in each month’s active patient population (top panel) and the prevalence of treated asthma in that population (bottom panel).
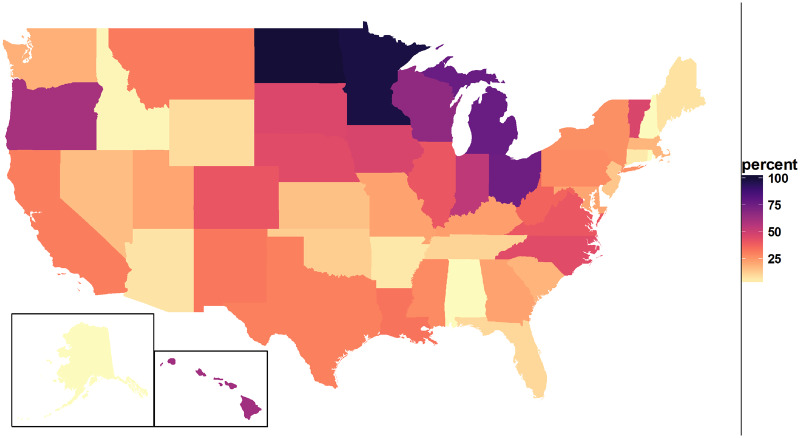
The geographic coverage of the ADP dataset is demonstrated in Figure 3. This proportion peaked for North Dakota at 100.8%, followed closely by Minnesota at 97.98%. The remaining states were distributed roughly uniformly between Rhode Island (0.42%) and Michigan (76.82%). The median represented proportion was 22.88% and interquartile range was 12.05%-42.24%.
Figure 3.
Proportion of number of health records in the Aggregate Data Program cohort to census based population estimates, by state.
Asthma prevalence
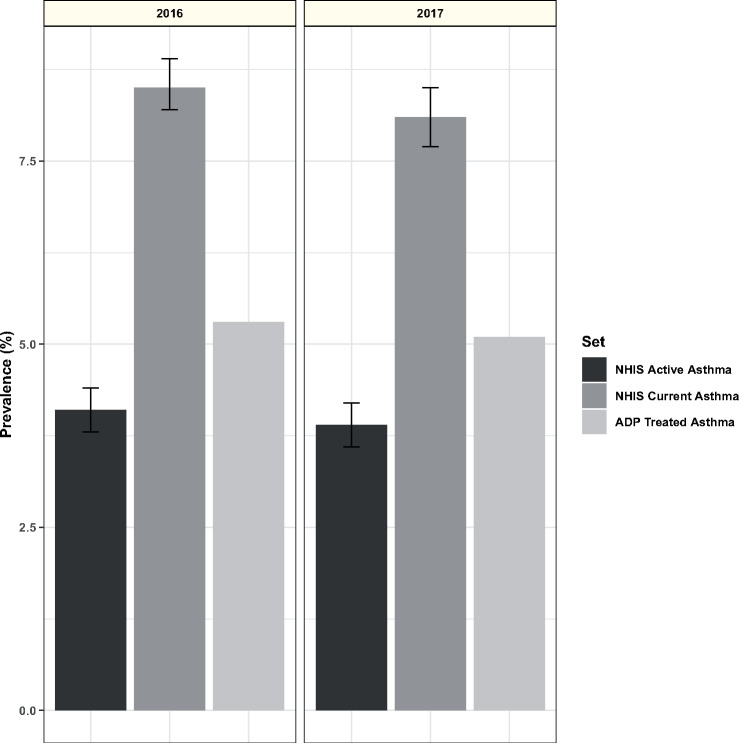
The mean monthly prevalence of treated asthma in the ADP dataset during 2017 was 5.27 ± 0.11%. This measurement was essentially stable as the program grew (Figure 2). The prevalence of treated asthma in the ADP dataset was compared with the NHIS Early Release of Selected Estimates for January through June 2017.19 During this period, the national estimate of current asthma prevalence was 8.10% (95% confidence interval, 7.68%-8.52%) and the national estimate of active asthma was 3.90% (95% confidence interval, 3.57%-4.18%), bracketing the ADP treated asthma prevalence (Figure 4).
Figure 4.
Aggregate Data Program (ADP) treated asthma prevalence and National Health Interview Survey (NHIS) active and current asthma prevalence estimates. Treated asthma prevalence is the mean of monthly values for December 2016 to November 2017. NHIS estimates are from the indicated year, with error bars showing 95% confidence interval of the estimate.
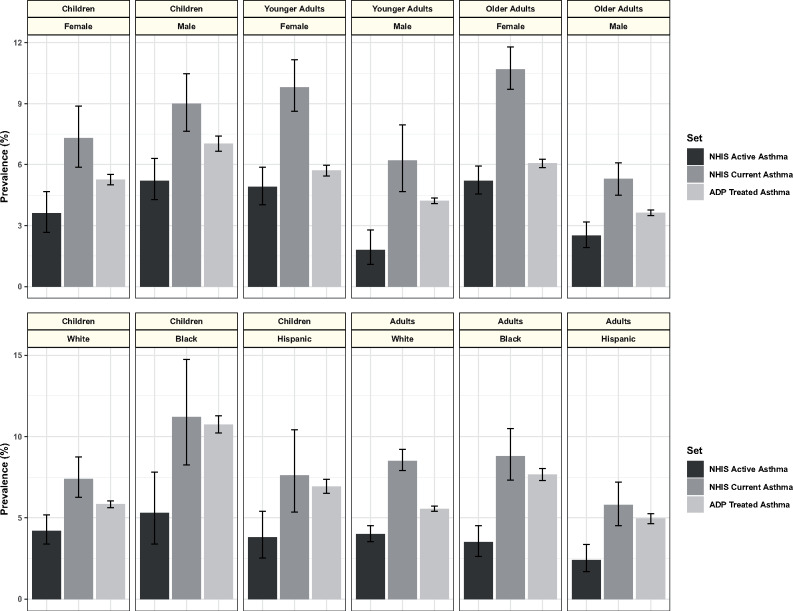
The comparative prevalence of ADP-measured treated asthma and NHIS active and current asthma was maintained across demographic subgroups (Figure 5). Current and active asthma prevalence estimates are included in the NHIS Early Release by sex, race, and ethnicity, and for age groups of <15 years of age (children), 15-34 years of age (young adults), and 35 years of age or older (older adults). The ADP also summarized data by age, sex, race, and ethnicity but used different age divisions. It reported summaries for ages of <12 years of age, 12-20 years of age, 20-39 years of age, 40-64 years of age, and >64 years of age. It also, separately, reported summaries for the categories “child” and “adult.” We show comparison of the NHIS age divisions with ADP data for <18 years of age (children), 20-39 years of age (younger adults), and >39 years of age (older adults). Similar comparison was also made with ADP data for children <12 years of age and <20 years of age, with no change in the qualitative relationship to the prevalence of current and active asthma (data not shown). While treated asthma prevalence was between active and current asthma prevalence for each group examined, the proximity of the measures varied. The prevalence of treated asthma and the prevalence of active asthma were closest for female older adults, while the prevalence of treated asthma and the prevalence of current asthma were closest for black children.
Figure 5.
Treated, current, and active asthma prevalence by age, sex, race, and ethnicity. Treated asthma prevalence is the mean of monthly values from the Aggregate Data Program (ADP) for December 2016 to November 2017, with error bars representing the standard deviation of the monthly values. Current asthma prevalence and active asthma prevalence are the National Health Interview Survey (NHIS) Early Release January to June 2017 estimates, with error bars showing the 95% confidence interval of the estimates. In the top panel, treated asthma prevalence is stratified by age, in which “children” are subjects that are <18 years of age, “younger adults” are 20-39 years of age and “older adults” are >39 years of age, while NHIS estimates are stratified as “children” for individuals under 15 of age, “younger adults” for 15-34 years of age, and “older adults” for those over 34 years of age. In the lower panel, treated asthma prevalence is stratified by age, including “children” when age is <18 years and “adults” when older, while NHIS estimates for “children” are defined as those >15 years of age and “adults” as those >15 years of age.
The mean difference between the ADP adult-treated asthma prevalence and the BRFSS adult current asthma prevalence was 4.57 ± 1.79%. The relationship between the magnitude of these differences and the maximal proportion of state representation in the ADP is demonstrated in Figure 6.
Figure 6.
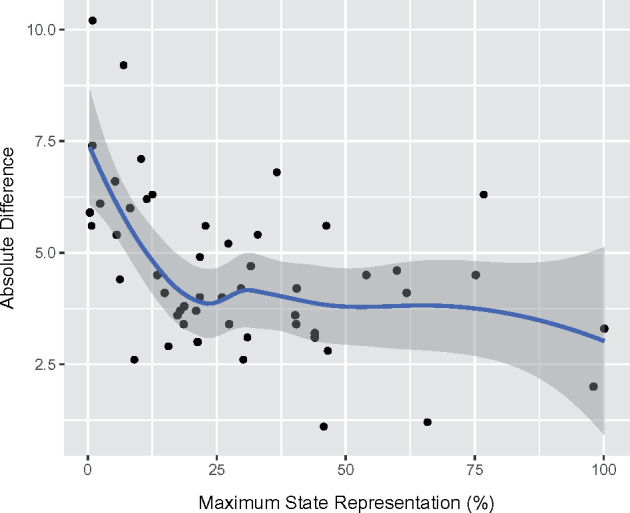
Relationship between absolute differences in Aggregate Data Program and 2016 Behavior Risk Factors Surveillance System adult asthma prevalence estimates by state and maximal Aggregate Data Program state representation (%). The solid line represents the relationship as generated by the locally estimated scatterplot smoother and the gray band represents the bootstrapped 95% confidence interval.
ED visits
The ADP rolling average of the rate of asthma-associated ED visits in 2017 was 1.39 ± 0.08%. By comparison, prior estimates from the NHAMCS dataset ranged between 1.3% and 1.4% (standard error = 0.1%) between 2010 and 2015.
DISCUSSION
We describe the application of an efficient and accessible mechanism for nationwide health data aggregation that leverages a shared data model and native features in a widely used commercial EHR. This approach lowers barriers to sharing de-identified data from multiple healthcare organizations, as demonstrated by its ability to accumulate information from over 100 million patient records over a relatively short period of time (13 months). While this dataset was not designed to be a representative national sample, the volume of health records accumulated allowed us to generate estimates of asthma prevalence and rates of asthma-associated ED utilization that mirror those produced by traditional survey-based methods. The efficiency, scope and quality achieved by this approach demonstrate the potential value of a confederated, customer driven, and EHR vendor-facilitated collaboration.
The relatively seamless and scalable nature of the ADP allowed the initiative to reach the national scale that it did (Figure 2). Each of the 50 states was represented, often with a significant portion of a state’s population potentially included (Figure 3). However, several states had minimal representation. In other states, the program counted more individuals than would have been expected. Most notably, North Dakota had >100% of the estimated population represented. Repeated counting of patients is likely to be the biggest culprit. This particular issue is highlighted by Kho et al,25 who demonstrated that de-duplicating records in a Chicago-based EHR-linkage tool reduced their estimates of asthma prevalence by 28%. As data are de-identified before submission in the ADP, we are not able to prevent repeat counting of any patient seen at more than 1 participating organization. Other efforts that leverage de-identified data for aggregation have grappled with similar trade-offs.11
The ADP produced asthma prevalence estimates that were consistent with well-established national and state-level surveys. The prevalence of treated asthma, as measured by the ADP, was consistently between the prevalence of active asthma and the prevalence of current asthma measured by traditional epidemiologic methods (Figures 4 and 5). However, the quantitative relationship between the ADP definition of treated asthma and the NHIS definitions of current and active asthma appeared to vary within both state and demographic subgroups. At the geographic level, the magnitude of the absolute difference between NHIS estimate of current asthma and ADP measure of treated asthma at the state level appeared to be related to the proportion of inhabitants that could have been represented by the ADP (Figure 6). The ADP estimates deviated more in states with lower representation, but the relationship appeared to stabilize once at least 25% of the population of a state was represented in the dataset. The latter can likely be attributed to sampling bias from less represented states. At the demographic level, the most prominent example of differences between our counts and established estimates is a greater proximity of the ADP treated asthma prevalence to NHIS estimates of current asthma prevalence, as opposed to the estimates of active asthma prevalence, in Black and Hispanic subgroups. We believe that this may be explained by 2 factors. First, the ADP measure may appear more inflated in minorities, as it reflects asthma-associated healthcare utilization, which is known to be significantly higher in this subgroup when compared with others.26 Second, we suspect that active asthma may be underreported by minorities, a hypothesis that is raised by documented differences in the perception of disease severity and reporting of asthma symptoms in Black patients when compared with Caucasions.27,28 In contrast, when the ADP estimate of ED utilization was compared with more objective data from the NHAMCS surveys, the correspondence was found to be excellent.
The success of the ADP was likely driven by its low barrier of entry, which should be viewed in the context of recent advancements in EHR-based population health surveillance achieved by the NYC Macroscope and MDPHnet programs. Both the MDPHnet and NYC Macroscope are externally funded collaborations between academic health care centers, public health officials and clinicians. MDPHnet leveraged 2 different open source third-party applications to allow centralized queries of several large practices across several different EHR platforms in the state of Massachusetts. This required the development of applications behind the firewalls at each healthcare system.13 NYC Macroscope incorporated different practices using the same EHR platform to develop a new virtual network (the “Hub”)29 that could query over 700 primary care providers across New York City. In contrast, the ADP required no new relationships and leveraged EHR-native tools for the querying and submission of de-identified data from any organization that uses the same EHR. Such an approach lowered technical barriers of entry into the program and, most concretely, avoided the need for additional third-party hardware or software behind an organization’s firewall. Unlike the MDPHnet and NYC Macroscope programs, no external funding was necessary for the development and maintenance of the ADP. In addition, ADP contributors, once agreeing to participate, had automated queries, aggregation and submission of their population level de-identified data at no additional cost. Conversely, the centralized designs of the NYC Macroscope and MDPHnet programs lent themselves to flexible and dynamic ad hoc querying, which the ADP structure did not allow. These limitations of the ADP are felt to be offset by the advantages of increased participation in data sharing. The rapid growth of the ADP program, from aggregate summaries representing 16 million active patients to 100 million in approximately 1 year, is a testament to the effectiveness of this approach.
Outside of programs crafted for the express purpose of achieving chronic disease surveillance, regional health information organizations (RHIOs) are perhaps best positioned to take advantage of their existing data aggregates to contribute to the same goal.10 The Indiana Health Information Exchange, one of the largest and most mature RHIOs in the country, has made significant progress in the general area of population health surveillance.30 Notable successes stemming from the Indiana Health Information Exchange include a relatively robust syndromic surveillance program31,32 and, more recently, the creation of a specialized traumatic brain injury, spinal cord injury, and stroke registry.33 To our knowledge, however, peer-reviewed reports of successful chronic disease surveillance programs specifically have yet to be published in the medical literature.34 Even if RHIOs are ultimately successful in achieving chronic disease surveillance at the local level, scalability across the nation might still be hindered by the need for multiple new collaboratives and the development of heterogenous interfaces at a time when the financial sustainability of HIEs cannot always be guaranteed.35 In contrast, initiatives like the ADP place the impetus on vendors to continue to develop within-platform standardization and data-sharing mechanisms as an organizational step toward more centralized interfaces for meaningful data exchange.
While our nationwide disease prevalence and ED utilization estimates mirrored those of national survey data, this success is likely attributable to the sheer scale of our cohort. Accordingly, there are significant limitations in our approach that would likely become more evident if applied to a smaller sample size. The lack of true random selection of contributed sites and patients, as well as the absence of demographic weighting, hinders data representativeness and generalizability.36 This selection bias invariably present in EHR-based studies is potentially magnified by our dependence on a single EHR platform, although the NYC Macroscope had the same limitation and was still able to produce valid estimates of regional disease prevalence.12 In addition, EHR estimates of disease prevalence can fluctuate depending on the look back period chosen. In our cohort, we incidentally used a 1-year look back period, which Rassen et al37 have demonstrated to produce a more stable and potentially representative estimate of disease prevalence than an all-time look back in their own simulation study. Importantly, the success of our pilot program relied on an easily identifiable clinical diagnosis with a relatively high prevalence. Rare disorders will not be well served by the suppression of sparse counts at the site level, and producing reasonable estimates of more complicated clinical phenotypes from disparate systems will likely prove more difficult.38 Finally, while we were able to uncover interesting trends in asthma-associated healthcare utilization in minority groups in this version of the ADP, we could not explore this relationship further due to the absence of additional potentially relevant characteristics inclusive of indicators of access to care as well as individual and area-based measures of socioeconomic status and geography (eg, rural vs urban distinction). Despite these limitations, we feel that our collaboration represents a step in the right direction and opens the door for the development and validation of new EHR-specific sampling and adjustment techniques that seek to better approximate regional and national representation.
Our results should not be viewed as an endorsement of any EHR platform over others. On the contrary, the ADP highlights the potential benefits and limitations of organizing public HIE across customers of a shared technology platform and its accompanying data model. The data elements aggregated in this study were standard demographic data (age, sex, state address, race or ethnicity) and United Medical Language System International Classification of Diseases diagnoses codes that are expected to be common in all Office of the National Coordinator–certified EHRs. Equivalent approaches to data aggregation could be applied to datasets from any group of independent healthcare systems along the same organizing principle, regardless of their reliance on propriety EHR data models or other open source standards such as the Observational Medical Outcomes Partnership (OMOP) data model and the Informatics for Integrating Biology and the Bedside (i2b2) data model.39,40 In the case of vendor-facilitated within-platform organization, coordination and data aggregation is fundamentally simpler when the underlying data to be aggregated across different systems relies on the same data model. Furthermore, efficiency can be achieved from exploiting existing relationships and reapplying existing technology. While healthcare organizations might only implement a data sharing system once, EHR vendors can develop expertise in this area that complements their existing mastery of their product, potentially reducing the marginal cost of each expansion of a data cooperative. Smaller organizations, lacking the size to support an independent data-sharing platform, could become involved via integration with their existing platforms. Finally, all parties involved have the potential to make use of the shared information, including the fulfillment of federal meaningful EHR use requirements. The resulting standardization of data structure and information exchange within individual EHR platforms presents an alluring organizational step toward the national goal of interoperability among different EHR platforms, healthcare systems, and HIE networks.
CONCLUSION
In conclusion, we describe the development and implementation of a confederated, customer driven and EHR vendor-facilitated data aggregation collaboration that complements other data aggregation efforts and brings national EHR-based chronic disease surveillance closer to reality. As a proof of concept, the program allowed the rapid aggregation of information from 100 million patient records across the U.S. and produced asthma prevalence and asthma-associated ED utilization rates that approximate traditional survey-based surveillance data at the national and state levels. Future implementations of this approach could expand the variables collected and involve an assessment of differential approaches to data sampling and weighting techniques to provide more representative and externally valid disease estimates.
AUTHOR CONTRIBUTIONS
All authors provided substantial contributions to the conception of the work, as well as the analysis and interpretation of data for the work. All authors were involved in drafting and approving the final manuscript and agree to be accountable for all aspects of the work.
ACKNOWLEDGMENTS
The authors wish to thank the Epic Systems Corporation staff who participated in the technical setup of the Aggregate Data Program (ADP), the members of the ADP Data Governing Council, and all the organizations who contributed data to the ADP. Without these collaborators, the ADP would not exist, and this work would not be possible.
CONFLICT OF INTEREST STATEMENT
None declared.
REFERENCES
- 1.H.R.1 - American Recovery and Reinvestment Act of 2009. https://www.congress.gov/bill/111th-congress/house-bill/1. Accessed August 9, 2018.
- 2. Henry JP, Pylypchuk Y, Searcy T, Patel V. Adoption of electronic health record systems among U.S. non-federal acute care hospitals: 2008-2015. 2016. https://www.cms.gov/Regulations-and-Guidance/Legislation/EHRIncentivePrograms/Certification.html. Accessed August 9, 2018.
- 3. Lenert L, Sundwall DN.. Public health surveillance and meaningful use regulations: a crisis of opportunity. Am J Public Health 2012; 102 (3): e1–7. [DOI] [PMC free article] [PubMed] [Google Scholar]
- 4. Khan S, Shea CM, Qudsi HK.. Barriers to local public health chronic disease surveillance through health information exchange: a capacity assessment of health departments in the health information network of south Texas. J Public Health Manag Pract 2017; 23 (3): e10–7. [DOI] [PubMed] [Google Scholar]
- 5. Shah GH, Vest JR, Lovelace K, McCullough JM.. Local health departments' partners and challenges in electronic exchange of health information. J Public Health Manag Pract 2016; 22 (Suppl 6): S44–50. [DOI] [PMC free article] [PubMed] [Google Scholar]
- 6. Blumenthal D, Tavenner M.. The “meaningful use” regulation for electronic health records. N Engl J Med 2010; 363 (6): 501–4. [DOI] [PubMed] [Google Scholar]
- 7.Medicare and Medicaid Programs; Electronic Health Record Incentive Program-Stage 3 and Modifications to Meaningful Use in 2015 Through 2017. 2015. https://www.federalregister.gov/documents/2015/10/16/2015-25595/medicare-and-medicaid-programs-electronic-health-record-incentive-program-stage-3-and-modifications Accessed August 9, 2018. [PubMed]
- 8. Kharrazi H, Gonzalez CP, Lowe KB, Huerta TR, Ford EW.. Forecasting the maturation of electronic health record functions among US hospitals: retrospective analysis and predictive model. J Med Internet Res 2018; 20 (8): e10458.. [DOI] [PMC free article] [PubMed] [Google Scholar]
- 9. D'Amore JD, Mandel JC, Kreda DA, et al. Are meaningful use stage 2 certified EHRs ready for interoperability? Findings from the SMART C-CDA collaborative. J Am Med Inform Assoc 2014; 21 (6): 1060–8. [DOI] [PMC free article] [PubMed] [Google Scholar]
- 10. Birkhead GS. Successes and continued challenges of electronic health records for chronic disease surveillance. Am J Public Health 2017; 107 (9): 1365–7. [DOI] [PMC free article] [PubMed] [Google Scholar]
- 11. Newton-Dame R, McVeigh KH, Schreibstein L, et al. Design of the New York City macroscope: innovations in population health surveillance using electronic health records. EGEMS (Wash DC) 2016; 4 (1): 1265. [DOI] [PMC free article] [PubMed] [Google Scholar]
- 12. Perlman SE, McVeigh KH, Thorpe LE, Jacobson L, Greene CM, Gwynn RC.. Innovations in population health surveillance: using electronic health records for chronic disease surveillance. Am J Public Health 2017; 107 (6): 853–7. [DOI] [PMC free article] [PubMed] [Google Scholar]
- 13. Vogel J, Brown JS, Land T, Platt R, Klompas M.. MDPHnet: secure, distributed sharing of electronic health record data for public health surveillance, evaluation, and planning. Am J Public Health 2014; 104 (12): 2265–70. [DOI] [PMC free article] [PubMed] [Google Scholar]
- 14. Klompas M, Cocoros NM, Menchaca JT, et al. State and local chronic disease surveillance using electronic health record systems. Am J Public Health 2017; 107 (9): 1406–12. [DOI] [PMC free article] [PubMed] [Google Scholar]
- 15. McVeigh KH, Lurie-Moroni E, Chan PY, et al. Generalizability of indicators from the New York city macroscope electronic health record surveillance system to systems based on other EHR platforms. EGEMS (Wash DC) 2017; 5 (1): 25.. [DOI] [PMC free article] [PubMed] [Google Scholar]
- 16. Romo ML, Chan PY, Lurie-Moroni E, et al. Characterizing adults receiving primary medical care in New York City: implications for using electronic health records for chronic disease surveillance. Prev Chronic Dis 2016; 13: E56. [DOI] [PMC free article] [PubMed] [Google Scholar]
- 17. Leider JP, Shah GH, Williams KS, Gupta A, Castrucci BC.. Data, staff, and money: leadership reflections on the future of public health informatics . J Public Health Manag Pract 2017; 23 (3): 302–10. [DOI] [PubMed] [Google Scholar]
- 18.SNOMED CT. 2018. https://www.nlm.nih.gov/healthit/snomedct/ Accessed July 9, 2018.
- 19.Centers for Disease Control and Prevention. National Health Interview Survey. 2018. https://www.cdc.gov/nchs/nhis/index.htm Accessed September 9, 2018.
- 20.Centers for Disease Control and Prevention. Behavioral Risk Factor Surveillance System. 2018. https://www.cdc.gov/brfss/index.html Accessed September 9, 2018.
- 21.Centers for Disease Control and Prevention. Ambulatory Health Care Data. 2018. https://www.cdc.gov/nchs/ahcd/index.htm Accessed September 9, 2018.
- 22.American Fact Finder. U.S. Census Bureau. 2017. https://factfinder.census.gov/faces/nav/jsf/pages/index.xhtml Accessed July 9, 2018.
- 23. R: A Language and Environment for Statistical Computing [Computer Program]. Vienna, Austria: R Foundation for Statistical Computing; 2013. [Google Scholar]
- 24. Wickham H. ggplot2: Elegant Graphics for Data Analysis. New York, NY: Springer-Verlag; 2016. [Google Scholar]
- 25. Kho AN, Cashy JP, Jackson KL, et al. Design and implementation of a privacy preserving electronic health record linkage tool in Chicago. J Am Med Inform Assoc 2015; 22 (5): 1072–80. [DOI] [PMC free article] [PubMed] [Google Scholar]
- 26. Crocker D, Brown C, Moolenaar R, et al. Racial and ethnic disparities in asthma medication usage and health-care utilization: data from the National Asthma Survey. Chest 2009; 136 (4): 1063–71. [DOI] [PubMed] [Google Scholar]
- 27. Rhee H, Belyea MJ, Elward KS.. Patterns of asthma control perception in adolescents: associations with psychosocial functioning. J Asthma 2008; 45 (7): 600–6. [DOI] [PMC free article] [PubMed] [Google Scholar]
- 28. Trochtenberg DS, BeLue R, Piphus S, Washington N.. Differing reports of asthma symptoms in African Americans and Caucasians. J Asthma 2008; 45 (2): 165–70. [DOI] [PMC free article] [PubMed] [Google Scholar]
- 29. Buck MD, Anane S, Taverna J, Amirfar S, Stubbs-Dame R, Singer J.. The Hub Population Health System: distributed ad hoc queries and alerts. J Am Med Inform Assoc 2012; 19 (e1): e46–50. [DOI] [PMC free article] [PubMed] [Google Scholar]
- 30. Biondich PG, Grannis SJ.. The Indiana network for patient care: an integrated clinical information system informed by over thirty years of experience. J Public Health Manage Pract 2004; 10 (Suppl): S81–S86. [PubMed] [Google Scholar]
- 31. Grannis SJ, Stevens KC, Merriwether R.. Leveraging health information exchange to support public health situational awareness: the Indiana experience. Online J Public Health Inform 2010; 2 (2): ojphi.v2i2.3213. [DOI] [PMC free article] [PubMed] [Google Scholar]
- 32. Grannis S, Wade M, Gibson J, Overhage JM.. The Indiana public health emergency surveillance system: ongoing progress, early findings, and future directions. AMIA Annu Symp Proc 2006; 2006: 304–8. [PMC free article] [PubMed] [Google Scholar]
- 33. Rahurkar S, McFarlane TD, Wang J, et al. Leveraging health information exchange to construct a registry for traumatic brain injury, spinal cord injury and stroke in Indiana. AMIA Annu Symp Proc 2017; 2017: 1440–9. [PMC free article] [PubMed] [Google Scholar]
- 34. Dixon BE, Gibson PJ, Comer KF, Rosenman MB.. Measuring population health using electronic health records: exploring biases and representativeness in a community health information exchange. Stud Health Technol Inform 2015; 216: 1009. [PubMed] [Google Scholar]
- 35. Adler-Milstein J, Bates DW, Jha AK.. Operational health information exchanges show substantial growth, but long-term funding remains a concern. Health Affairs 2013; 32 (8): 1486–92. [DOI] [PubMed] [Google Scholar]
- 36. Casey JA, Schwartz BS, Stewart WF, Adler NE.. Using electronic health records for population health research: a review of methods and applications. Annu Rev Public Health 2016; 37 (1): 61–81. [DOI] [PMC free article] [PubMed] [Google Scholar]
- 37. Rassen JA, Bartels DB, Schneeweiss S, Patrick AR, Murk W.. Measuring prevalence and incidence of chronic conditions in claims and electronic health record databases. Clin Epidemiol 2018; 11: 1–15. [DOI] [PMC free article] [PubMed] [Google Scholar]
- 38. Pathak J, Kho AN, Denny JC.. Electronic health records-driven phenotyping: challenges, recent advances, and perspectives. J Am Med Inform Assoc 2013; 20 (e2): e206–11. [DOI] [PMC free article] [PubMed] [Google Scholar]
- 39. Murphy SN, Weber G, Mendis M, et al. Serving the enterprise and beyond with informatics for integrating biology and the bedside (i2b2). J Am Med Inform Assoc 2010; 17 (2): 124–30. [DOI] [PMC free article] [PubMed] [Google Scholar]
- 40.Foundation for National Institutes of Health. Observational Medical Outcomes Partnership. https://www.ohdsi.org/data-standardization/the-common-data-model/ Accessed February 7, 2019.


