

Abstract
Background:
Previous studies examining the safety and efficacy of Q-value-guided laser-assisted in situ keratomileusis (LASIK) for treating myopia have yielded inconsistent results. We, therefore, performed a meta-analysis to clarify this issue
Methods:
Various databases were conducted up to November 21, 2018. All randomized controlled trials and cohorts that compared Q-value-guided LASIK with standard LASIK were selected. Mean differences (MDs) or odds ratios (ORs) with 95% confidence intervals (CIs) were calculated to evaluate the strength of the correlations. Additionally, different subgroup analyses and publication bias tests were performed. Data were extracted including the number of postoperative uncorrected visual acuity (UCVA) of 20/20 or better, postoperative UCVA, preoperative and postoperative Q-value, postoperative refractive spherical equivalent (SE), the number of postoperative SE within ±0.5D, higher order aberration (HOA), coma-like aberration and spherical-like aberration.
Results:
A total of seventeen studies with 2640 patients and 3,358 eyes were included. It has been shown that postoperative Q-value (MD = -0.42; 95% CI: -0.64, -0.21; P < .001), HOA (MD = -0.14; 95% CI: -0.23, -0.06; P = .001), spherical-like aberration (MD = -0.19; 95% CI: -0.32, -0.06; P = .004) rather than postoperative UCVA (MD = 0.04; 95% CI: 0.01, 0.07; P = .012) were significantly better in the Q-value-guided LASIK than standard LASIK. However, the pooled results revealed that no significant differences were found between the 2 paired groups of postoperative UCVA of 20/20 or better (OR = 1.09; 95% CI: 0.62, 1.92; P = .763), preoperative Q-value (MD = -0.00; 95% CI: -0.02, 0.02; P = .922), postoperative refractive SE (MD = 0.08; 95% CI: -0.09, 0.25; P = .336), coma-like aberration (horizontal: MD = -0.00; 95% CI: -0.03, 0.03; P = .966; vertical: MD = -0.01; 95% CI: -0.03, 0.01; P = .263) and postoperative SE within ±0.5 D (OR = 1.06; 95% CI: 0.48, 2.33; P = .886). Likewise, similar results were detected in some corresponding subgroups.
Conclusion:
Q-value-guided LASIK is a safe, effective and predictable surgical option for treating myopia, especially showing superiority over standard LASIK in postoperative Q-value, HOA and spherical-like aberration. However, more detailed studies are required to confirm our conclusions in advanced researches.
Keywords: laser in situ keratomileusis, myopia, Q-value, meta-analysis
1. Introduction
Myopia is a common eye disease which increasingly recognized as a significant cause of visual impairment and blindness globally. Recent evidences from epidemiological studies suggested a increasing prevalence of myopia, causing a profound economic cost to the society.[1] It has been reported that its prevalence among children and teenagers was as high as 50% in Taiwan,[2] 67.3% in Chinese mainland,[3] 70% in Singapore,[4] and even 96.5% in Korea.[5] It seriously affects the quality of vision of children and teenagers. Thus, there is an urgent need to develop effective treatment strategies for myopia.
Myopia is an ocular disease characterized by an abnormally elongated eyeball, which cannot be rescued by optical lenses or refractive surgeries. To date, laser in situ keratomileusis (LASIK) has been the standard refractive surgery for treating myopia owing to its safety and efficacy.[6] However, conventional LASIK has the potential increase in corneal higher order aberrations (HOA) caused by an oblate central corneal surface, which may cause postoperative halos, glare, and night vision difficulties. With the development of surgical instruments, the technique has gradually evolved accordingly. A better refractive outcome for improving vision quality has gradually being explored in clinical research. Recently, Q-value-guided LASIK is regarded as a relatively novel surgical option. It provides wavefront-guided corneal aspheric ablation to maintain preoperative and postoperative corneal shape, as evaluated by the Q-value. This device may be a promising tool to provide benefits in vision quality. Compared with conventional LASIK procedure, Q-value-guided LASIK also allows the surgeon to reduce the amount of tissue removal by approximately 30%.[7,8] However, there were conflicting reports about the postoperative visual recovery and corneal stability of Q-value-guided LASIK. Meta-analysis can get a relatively precise and accurate estimation through incorporating all available data using statistical tool. Thus, the meta-analysis was to explore the safety and efficacy of Q-value-guided LASIK for treating myopia.
2. Materials and methods
2.1. Ethics statement
The Preferred Reporting Items for Systematic Reviews and Meta-Analysis guidelines was used to perform the current meta-analysis.[9] No patient's privacy or clinical sample was involved in this study, hence the ethical approval was not required.
2.2. Identification and eligibility of relevant studies
Literature resources including PubMed, Cochrane Library, Embase, China Biology Medicine disc and China National Knowledge Infrastructure were searched for eligible literatures. The search terms were composed of myopia (eg, myopia, short-sight and nearsighted), LASIK (eg, LASIK and Keratomileusis, Laser In Situ). Last search of current investigation was updated on November 21, 2018. The language was limited to English and Chinese. We identified other relevant articles according to scan all retrieved articles and reviews. We treated them independently if the different groups were found in a reported article.
2.3. Inclusion and exclusion criteria
Studies followed the 2 criteria could be identified:
-
(1)
all randomized controlled trials (RCTs) and cohorts;
-
(2)
The studies provided available data;
As per the exclusion criteria:
-
(1)
the available data was absent;
-
(2)
similar or duplicate study (When the same or similar cohort was applied, the most complete information was included);
-
(3)
other types of articles including reviews or abstracts.
2.4. Data extraction
In the light of inclusion and exclusion criteria, we extracted the relevant information from each eligible publication. If disagreements were noticed, we are clearly open to discussion by each other (Zhang Kaiping and Fang Xiang), or reviewed by a third author (Chao Min). The information on first author, publication year, study country, follow-up, laser Instrument, the number of patients and eyes, age, preoperative spherical equivalent (SE) and study design was collected by 2 authors independently. We did not contact any authors of the original researches even though the essential information could not be available. Besides, country was divided into China and others. Number of eyes enrolled included ≧100 and < 100. Study design was stratified into 2 groups: RCT and cohort. The Newcastle-Ottawa Scale consisted of selection, comparability of the groups and ascertainment of exposure was introduced to evaluate the included publication's quality. The Newcastle-Ottawa Scale scores were 0 to 10 stars. If 1 included study obtained no less than 7 stars, it could be regarded as high-quality.[10]
2.5. Outcome measures
The outcome measures included the number of postoperative uncorrected visual acuity (UCVA) of 20/20 or better, postoperative UCVA, preoperative and postoperative Q-value, postoperative refractive SE, the number of postoperative SE within ±0.5 D, HOA, coma-like aberration and spherical-like aberration.
2.6. Statistical analysis
RevMan software (version 5.3; Cochrane Collaboration, Oxford, United Kingdom) and STATA (version 12.0; Stata Corporation, College Station, Texas) were introduced to analyze the data in current meta-analysis. Odds ratio (ORs) with 95% confidence interval (CIs) were calculated for the dichotomous outcomes. For the continuous measures, mean difference (MDs) with 95% CIs were used, and a P < .05 was considered to be statistically significant difference. The heterogeneity has been assessed via chi-square-based Q and extent of inconsistency (I2) test across studies (no heterogeneity I2 < 25%, moderate heterogeneity I2 = 25%-50%, extreme heterogeneity I2 > 50%).[11] In case of extreme heterogeneity (I2 > 50% or P < .01 for Q test), we used random-effects (DerSimonian and Laird method) model.[12] Otherwise, fixed-effects (Mantel-Haenszel method) model was introduced.[13]
Subgroup analyses were performed on study design (RCTs versus cohorts), country (China versus Others) and number of eyes enrolled (≥100 versus < 100). Additionally, 1-way sensitivity analyses individually removed publications in meta-analysis were conducted to assess results’ stability. Publication bias was estimated using Begg and Egger tests.[14]
3. Results
3.1. Characteristics of Eligible Studies
A total of 17 studies with 2640 patients and 3358 eyes satisfied the eligible studies.[15–31] Among them, Villa C et al study investigated 2 different case-control studies and we separated them independently into meta-analysis.[20] Therefore, the current meta-analysis was established based on 18 studies (Fig. 1). Of these studies, 6 RCTs and twelve cohorts were included. The number of eyes ranged from 48 to 755. The main characteristics of the included studies were shown in Table 1.
Figure 1.

Flow diagram of the study selection process in the meta-analysis.
Table 1.
Characteristics of studies included in the meta-analysis.
| Q-adjusted LASIK | Standard LASIK | |||||||||||
| Authors | Year | Country | Follow-up (mo) | Laser Instrument | Eyes/Patients(n) | Age (yrs) | Preoperative SE (D) | Eyes/Patients (n) | Age (yrs) | Preoperative SE (D) | Design | NOS |
| Li et al[15] | 2012 | China | 3 | Allegretto Wave Eye-Q 400 Hz (Wavelight AG, Germany) | 32/32 | 21 ± 2.50 | DS: -4.38 ± -0.58 DC: -0.82 ± -0.25 | 16/16 | 23 ± 3.1 | DS: -3.39 ± -0.82 DC: -0.61 ± -0.46 | Cohort | 6 |
| Zheng et al[16] | 2011 | China | >6 | Technolas 217-z100 excimer laser (Bausch and Lomb) | 132/66 | 18–43 | −2.25 | 100/50 | 18–39 | −2 | Cohort | 7 |
| Zhou et al[17] | 2010 | China | 1 | Allegretto Wave Eye-Q 400 Hz (Wavelight AG) | 27/27 | 22.6 (18–35) | −4.56 ± 1.69 | 27/27 | 22.6 (18–35) | −4.38 ± 1.80 | RCT | 7 |
| Xin et al[18] | 2010 | China | 36 | Technolas 217-z100 excimer laser (Bausch and Lomb) | 367/189 | NA | NA | 194/100 | NA | NA | RCT | 6 |
| Igarashi et al[19] | 2009 | Japan | 3 | Technolas 217-z100 excimer laser (Bausch and Lomb) | 28/15 | 36.4 ± 5.8 | −5.13 ± 1.23 | 33/18 | 32.9 ± 8.3 | −5.63 ± 0.88 | Cohort | 6 |
| Villa et al[20] | 2009 | Spain | 3 | Allegretto Wave Eye-Q 400 Hz (Wavelight AG, Germany) | 48/24 a 40/40b | 32.3a 31.3b | −3.4a –4b | 76/38a 40/40b | 35.2a 31.3b | −3.7a −4b | Cohort | 8 |
| Liu et al[21] | 2008 | China | >12 | Astrascan XL 200 Hz (LaserSigh) | 106/53 | 27.9 ± 4.86 | −6.57 ± 1.81 | 102/51 | 25.4 ± 5.85 | −5.99 ± 2.53 | RCT | 7 |
| Wei et al[22] | 2008 | China | 1 | NA | 276/139 | 20.49 ± 3.31 | −4.52 ± 1.77 | 479/241 | 22.79 ± 4.42 | −4.55 ± 1.91 | Cohort | 7 |
| Ma et al[23] | 2008 | China | >6 | Allegretto Wave Eye-Q 400 Hz (Wavelight AG, Germany) | 86/43 | NA | NA | 86/43 | NA | NA | Cohort | 8 |
| Zou et al[24] | 2008 | China | 3 | Technolas 217-z100 excimer laser (Bausch and Lomb) | 152/80 | 26.56 ± 4.97 | DS: −5.79 ± −2.18 DC: −0.79 ± −0.41 | 181/100 | 25.4 ± 5.17 | DS: −5.21 ± −1.41 DC: −0.60 ± −0.49 | RCT | 8 |
| Xu et al[25] | 2008 | China | 3 | Allegretto Wave Eye-Q 400 Hz (Wavelight AG, Germany) | 46/23 | 25.5 ± 6.02 | −5.48 ± 2.38 | 44/22 | 24.7 ± 5.86 | −5.62 ± 2.63 | Cohort | 7 |
| Zhou et al[26] | 2008 | China | 6 | Mel 80 (Carl Zeis, Germany) | 38/38 | 27.1 ± 4.8 | −3.46 ± 1.62 | 41/41 | 26.4 ± 6.1 | −3.59 ± 1.68 | Cohort | 6 |
| Cai et al[27] | 2008 | China | 1 | Astrascan XL 200 Hz (LaserSigh) | 64/32 | 24.3 ± 7.2 | DS: −3.24 ± 1.21 DC: −0.46 ± 0.29 | 64/32 | 25.1 ± 6.7 | DS: −3.13 ± 1.09 DC: −0.58 ± 0.31 | RCT | 6 |
| Huang et al[28] | 2008 | China | 3 | Technolas 217-z100 excimer laser (Bausch and Lomb) | 43/43 | 23 ± 4 | -4.83 ± 1.28 | 41/41 | 25 ± 4 | −5.01 ± 1.65 | RCT | 7 |
| Chen et al[29] | 2007 | China | 6 | Astrascan XL 200 Hz (LaserSigh) | 66/33 | 24.61 ± 5.92 | −5.18 ± 1.62 | 59/30 | 24.2 ± 6.46 | −5.26 ± 1.65 | Cohort | 8 |
| Liu et al[30] | 2007 | China | 1 | Technolas 217-z100 excimer laser (Bausch and Lomb) | 51/28 | 24.65 ± 0.91 | DS: −6.71 ± 0.91 DC: −0.68 ± 0.09 | 51/26 | 23.87 ± 1.05 | DS: −6.62 ± 0.21 DC: −0.64 ± 0.07 | Cohort | 8 |
| Shen et al[31] | 2005 | China | 6 | Allegretto Wave Eye-Q 400 Hz (Wavelight AG, Germany) | 64/32 | NA | −6.22 ± 2.22 | 58/29 | NA | −6.19 ± 2.17 | Cohort | 6 |
3.2. Meta-analysis results
3.2.1. Postoperative UCVA of 20/20 or Better
Eight studies reported the postoperative UCVA of 20/20 or better of Q-value-guided LASIK and standard LASIK for myopia. No heterogeneity was found (I2 = 0.0%), so fixed effects model was used to calculate the combined OR and 95% CI. As a result, the pooled result revealed that no significant difference was detected between the 2 paired groups (OR = 1.09; 95% CI: 0.62, 1.92; P = .763) (Fig. 2)
Figure 2.

Forest plot of postoperative UCVA of 20/20 or better between Q-value-guided LASIK and standard LASIK for myopia. LASIK = Laser in situ keratomileusis, UCVA = uncorrected visual acuity.
3.2.2. Postoperative UCVA.
Seven studies compared the postoperative UCVA between Q-value-guided LASIK and standard LASIK for myopia. Apparent heterogeneity was found (I2 = 76.9%), so random effects model was applied to calculate MD (95% CI). A statistically significant difference was found in postoperative UCVA (MD = 0.04; 95% CI: 0.01, 0.07; P = .012) (Fig. 3).
Figure 3.

Forest plot of postoperative UCVA between Q-value-guided LASIK and standard LASIK for myopia. LASIK = Laser in situ keratomileusis, UCVA = uncorrected visual acuity.
3.2.3. Preoperative and postoperative Q-value
There are eleven studies to detect the preoperative and postoperative Q-value between 2 paired groups. An evident heterogeneity was detected among the study results (I2 = 68% and 98.4%), so random effects model was applied to calculate the combined MD and 95% CI. No significant differences were found in preoperative Q-value (MD = -0.00; 95% CI: -0.02, 0.02; P = .922) (Fig. 4A). However, there was a statistically significant difference in postoperative Q values between 2 paired groups (MD = -0.42; 95% CI: -0.64, -0.21; P < .001) (Fig. 4B).
Figure 4.

Forest plot of preoperative and postoperative Q-value between Q-value-guided LASIK and standard LASIK for myopia. A: preoperative Q-value; B: postoperative Q-value. LASIK = Laser in situ keratomileusis.
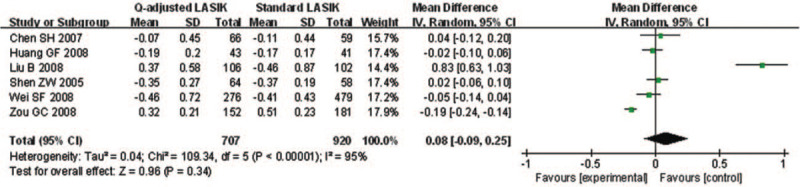
3.2.4. Postoperative refractive SE
Only 6 studies explored postoperative refractive SE of Q-value-guided LASIK and standard LASIK. Apparent heterogeneity was found (I2 = 95.4%), so random effects model was applied to calculate the combined MD and 95% CI. There was no significant difference between 2 paired groups (MD = 0.08; 95% CI: -0.09, 0.25; P = .336) (Fig. 5).
Figure 5.
Forest plot of postoperative refractive SE between Q-value-guided LASIK and standard LASIK for myopia. LASIK = Laser in situ keratomileusis, SE = spherical equivalent.
3.2.5. Postoperative SE within ±0.5 D of Target Refraction
Only 3 studies were involved to explore the number of postoperative SE within ±0.5 D. No heterogeneity was found (I2 = 0.0%), so fixed effects model was used to calculate the combined OR and 95% CI. The forest plot showed that no significant difference was found in postoperative SE within ±0.5 D (OR = 1.06; 95% CI: 0.48, 2.33; P = .886) (Fig. 6).
Figure 6.

Forest plot of postoperative SE within ±0.5 D of target refraction between Q-value-guided LASIK and standard LASIK for myopia. LASIK = Laser in situ keratomileusis, SE = spherical equivalent.
3.2.6. Postoperative aberration
Postoperative aberration included HOA, coma-like aberration and spherical-like aberration. Among them, coma-like aberration contained horizontal and vertical coma-like aberration. Ten and twelve studies explored HOA and spherical-like aberration, respectively. Apparent heterogeneity was found (I2 = 98.5% and 99.2%), so random effects model was applied to calculate the combined MD and 95% CI. Compared to the standard LASIK group, HOA (MD = -0.14; 95% CI: -0.23, -0.06; P = .001) (Fig. 7A) and spherical aberrations (MD = -0.19; 95% CI: -0.32, -0.06; P = .004) (Fig. 7B) increased more in the Q-value-guided LASIK group, and there were statistically differences. Additionally, there were 5 and 6 studies involved in horizontal and vertical coma-like aberration, respectively. No heterogeneity was found (I2 = 0.0% and 0.0%). Consequently, no significant differences were found in coma-like aberration between 2 paired groups (horizontal: MD = -0.00; 95% CI: -0.03, 0.03; P = .966; vertical: MD = -0.01; 95% CI: -0.03, 0.01; P = .263) (Fig. 7C-7D).
Figure 7.

Forest plot of different postoperative aberration between Q-value-guided LASIK and standard LASIK for myopia. A: HOA; B: spherical aberrations; C: horizontal coma-like aberration; D: vertical coma-like aberration. LASIK = Laser in situ keratomileusis.
3.2.7. Subgroup-analysis results
Subgroup analyses were performed according to the study design (RCTs versus cohorts), country (China versus Others) and number of eyes enrolled (≧100 versus < 100). As shown in Table 2, significant statistically difference were found in sub-analyses regarding postoperative Q-value (RCTs: MD = -0.48; 95% CI: -0.77, -0.18; P = .002; cohort: MD = -0.41; 95% CI: -0.68, -0.14; P = .003), HOA (RCTs: MD = -0.10; 95% CI: -0.17, -0.03; P = .006; cohort: MD = -.16; 95% CI: -0.26, -0.05; P = .004) and spherical-like aberration (cohort: MD = -0.16; 95% CI: -0.25, -0.07; P = .001). As for subgroup of country, similar results were found in postoperative Q-value (country: MD = -0.30; 95% CI: -0.51, -0.10; P = .003; other: MD = -0.75; 95% CI: -1.12, -0.38; P = .000), HOA (country: MD = -0.10; 95% CI: -0.14, -0.05; P = .000; other: MD = -0.22; 95% CI: -0.37, -0.07; P = .004) and spherical-like aberration (other: MD = -0.22; 95% CI: -0.43, -0.01; P = .039) (Table 3). Likewise, we also detected similar results via subgroup analysis on study eye sizes. Postoperative UCVA (≧100: MD = 0.05; 95% CI: 0.01, 0.08; P = .006), postoperative Q-value (≧100: MD = -0.46; 95% CI: -0.73, -0.18; P = .001), HOA (<100: MD = -0.12; 95% CI: -0.20, -0.05; P = .001) and spherical-like aberration (≧100: MD = -0.36; 95% CI: -0.64, -0.08; P = .011) in Q-value-guided LASIK group exhibited statistically significant differences compared to control (Table 4).
Table 2.
Subgroup analyses on study design.
| Study design (RCTs versus Cohorts) | Studies | Eyes | OR or MD (95%CI) | P | I2 |
| Postoperative UCVA of 20/20 or better | 8 | 1397 | OR 1.09 (0.62, 1.92) | .763 | 0.0% |
| RCT | 3 | 699 | OR 0.61 (0.08, 4.70) | .633 | 0.0% |
| Cohort | 5 | 698 | OR 1.15 (0.64, 2.06) | .647 | 0.0% |
| Postoperative UCVA | 7 | 1645 | MD 0.04 (0.01, 0.07) | .012 | 76.9% |
| RCT | 3 | 595 | MD 0.03 (−0.02, 0.08) | .180 | 56.2% |
| Cohort | 4 | 1050 | MD 0.04 (−0.00, 0.09) | .070 | 86.0% |
| Preoperative Q-value | 11 | 1605 | MD −0.00 (−0.02, 0.02) | .922 | 68.0% |
| RCT | 3 | 853 | MD −0.00 (−0.02, 0.01) | .668 | 0.0% |
| Cohort | 8 | 752 | MD 0.00 (−0.03, 0.03) | .935 | 75.0% |
| Postoperative Q-value | 11 | 1655 | MD −0.42 (−0.64, −0.21) | .000 | 98.4% |
| RCT | 3 | 853 | MD −0.48 (−0.77, −0.18) | .002 | 96.0% |
| Cohort | 8 | 802 | MD −0.41 (−0.68, −0.14) | .003 | 98.5% |
| Postoperative refractive SE | 6 | 1627 | MD 0.08 (−0.09, 0.25) | .336 | 95.4% |
| RCT | 3 | 1002 | MD 0.19 (−0.17, 0.54) | .299 | 98.0% |
| Cohort | 3 | 625 | MD −0.00 (−0.06, 0.05) | .897 | 0.0% |
| HOA | 10 | 1309 | MD −0.14 (−0.23, −0.06) | .001 | 98.5% |
| RCT | 4 | 827 | MD −0.10 (−0.17, −0.03) | .006 | 89.4% |
| Cohort | 6 | 482 | MD −0.16 (−0.26, −0.05) | .004 | 98.4% |
| Horizontal coma-like aberration | 5 | 404 | MD −0.00 (−0.03, 0.03) | .966 | 0.0% |
| RCT | 3 | 266 | MD 0.00 (−0.04, 0.05) | .816 | 0.0% |
| Cohort | 2 | 138 | MD −0.01 (−0.07, 0.05) | .688 | 0.0% |
| Vertical coma-like aberration | 6 | 455 | MD −0.01 (−0.03, 0.01) | .263 | 0.0% |
| RCT | 3 | 266 | MD −0.01 (−0.05, 0.03) | .577 | 0.0% |
| Cohort | 3 | 189 | MD −0.01 (−0.03, 0.01) | .331 | 0.0% |
| Spherical-like aberration | 12 | 1305 | MD −0.19 (−0.32, −0.06) | .004 | 99.2% |
| RCT | 4 | 599 | MD −0.24 (−0.69, 0.22) | .308 | 99.7% |
| Cohort | 8 | 706 | MD −0.16 (−0.25, −0.07) | .001 | 97.9% |
Table 3.
Subgroup analyses on country.
| Country (China versus Others) | Studies | Eyes | OR or MD (95%CI) | P | I2 |
| Preoperative Q-value | 11 | 1605 | MD −0.00 (−0.02, 0.02) | .922 | 68.0% |
| China | 8 | 1340 | MD −0.01 (−0.03, 0.01) | .398 | 74.7% |
| Others | 3 | 265 | MD 0.04 (0.00, 0.08) | .019 | 0.0% |
| Postoperative Q-value | 11 | 1655 | MD −0.42 (−0.64, −0.21) | .000 | 98.4% |
| China | 8 | 1390 | MD −0.30 (−0.51, −0.10) | .003 | 97.9% |
| Others | 3 | 265 | MD −0.75 (−1.12, −0.38) | .000 | 96.4% |
| HOA | 10 | 1309 | MD −0.14 (−0.23, −0.06) | .001 | 98.5% |
| China | 7 | 1044 | MD −0.10 (−0.14, −0.05) | .000 | 92.4% |
| Others | 3 | 265 | MD −0.22 (−0.37, −0.07) | .004 | 98.3% |
| Vertical coma-like aberration | 6 | 455 | MD −0.01 (−0.03, 0.01) | .263 | 0.0% |
| China | 5 | 404 | MD −0.01 (−0.05, 0.02) | .424 | 0.0% |
| Others | 1 | 51 | MD −0.01 (−0.03, 0.01) | .423 | / |
| Spherical-like aberration | 12 | 1305 | MD −0.19 (−0.32, −0.06) | .004 | 99.2% |
| China | 9 | 1040 | MD −0.18 (−0.37, 0.00) | .055 | 99.3% |
| Others | 3 | 265 | MD −0.22 (−0.43, −0.01) | .039 | 99.3% |
Table 4.
Subgroup analyses on study eye sizes.
| Eye sizes (≧100 versus < 100) | Studies | Eyes | OR or MD (95%CI) | P | I2 |
| Postoperative UCVA of 20/20 or better | 8 | 1397 | OR 1.09 (0.62, 1.92) | .763 | 0.0% |
| ≧100 | 4 | 1090 | OR 1.16 (0.55, 2.44) | .697 | 0.0% |
| <100 | 4 | 307 | OR 1.00 (0.42, 2.38) | .991 | 0.0% |
| Postoperative UCVA | 7 | 1645 | MD 0.04 (0.01, 0.07) | .012 | 76.9% |
| ≧100 | 5 | 1543 | MD 0.05 (0.01, 0.08) | .006 | 82.8% |
| <100 | 2 | 102 | MD −0.01 (−0.09, 0.07) | .839 | 0.0% |
| Preoperative Q-value | 11 | 1605 | MD −0.00 (−0.02, 0.02) | .922 | 68.0% |
| ≧100 | 6 | 1242 | MD −0.01 (−0.03, 0.02) | .678 | 82.9% |
| <100 | 5 | 363 | MD 0.01 (−0.02, 0.03) | .547 | 0.0% |
| Postoperative Q-value | 11 | 1655 | MD −0.42 (−0.64, −0.21) | .000 | 98.4% |
| ≧100 | 6 | 1292 | MD −0.46 (−0.73, −0.18) | .001 | 98.9% |
| <100 | 5 | 363 | MD −0.38 (−0.83, 0.06) | .093 | 97.9% |
| Postoperative refractive SE | 6 | 1627 | MD 0.08 (−0.09, 0.25) | .336 | 95.4% |
| ≧100 | 5 | 1543 | MD 0.11 (−0.11, 0.33) | .315 | 96.3% |
| <100 | 1 | 84 | MD −0.02 (−0.10, 0.06) | .621 | / |
| HOA | 10 | 1309 | MD −0.14 (−0.23, −0.06) | .001 | 98.5% |
| ≧100 | 3 | 813 | MD −0.18 (−0.40, 0.04) | .109 | 99.6% |
| <100 | 7 | 496 | MD −0.12 (−0.20, −0.05) | .001 | 94.6% |
| Horizontal coma-like aberration | 5 | 404 | MD −0.00 (−0.03, 0.03) | .966 | 0.0% |
| ≧100 | 1 | 128 | MD 0.00 (−0.05, 0.06) | .880 | / |
| <100 | 4 | 276 | MD −0.00 (−0.05, 0.04) | .851 | 0.0% |
| Vertical coma-like aberration | 6 | 455 | MD −0.01 (−0.03, 0.01) | .263 | 0.0% |
| ≧100 | 1 | 128 | MD −0.00 (−0.05, 0.04) | .814 | / |
| <100 | 5 | 327 | MD −0.01 (−0.04, 0.01) | .253 | 0.0% |
| Spherical-like aberration | 12 | 1305 | MD −0.19 (−0.32, −0.06) | .004 | 99.2% |
| ≧100 | 5 | 809 | MD −0.36 (−0.64, −0.08) | .011 | 99.6% |
| <100 | 7 | 496 | MD −0.08 (−0.20, 0.05) | .238 | 98.6% |
3.3. Sensitivity analysis and publication bias
Each study here was deleted at a time to assess the specific effect of the individual data on the pooled results, and one-way sensitivity analysis suggested the results were relatively stable. The Begg test (P = .06 to 1.000) and Egger test (P = .021 to .735) were applied to all of the outcome measures. No publication bias was found in all outcome measures rather than postoperative refractive SE (Egger: P = .021).
4. Discussion
Q-value-guided LASIK is new technology now approved for clinical use. However, there were controversial reports about its postoperative visual recovery and corneal stability. Meta-analysis could get a relatively precise estimation from different inconsistent studies. We tried to explore its safety and efficacy in current research. As a result, Q-value-guided LASIK is a safe, effective and predictable surgical options for treating myopia. Meanwhile, Q-value-guided LASIK shows obvious superiority in postoperative Q-value, HOA and spherical-like aberration. It could provide benefits for improvement of vision quality, and have a relatively smaller increase in the differential postoperative Q-value after surgery. Generally, the outer surface of the human cornea is physiologically conical rather than a sphere. A significant variation of physiologic asphericity is shown ranging from mild oblate to moderate prolate.[32] Therefore, it is necessary to introduce a shape factor to characterize the amount of asphericity of the cornea numerically, the so-called Q-factor. The Q value is negative for most eyes and not related to the degree of myopia.[33,34]Q value mathematically reflects corneal asphericity, which can be defined to variations in radius of curvature from apex to periphery. [35,36]
To date, LASIK is a common corneal surgery for myopia and astigmatism.[37] It makes the cornea undergo a anatomical change, from its initially prolate shape (Q < 0) with a steeper central area and flat peripheral area to an oblate shape (Q > 0) with a flat center and steep periphery.[38–40] LASIK can reduce refractive error and improve uncorrected visual acuity, but several problems still must be resolved regarding postoperative visual function and contrast sensitivity.[41] Increased higher-order optical aberrations after laser refractive surgery was found to be a potentially major factor in visual quality.[42] A further study is required to determine the exact Q-values after surgery. With the development and maturation of refractive surgery, relatively high surgical efficacy based on Q-value has been introduced for treating myopia. Q-value guided surgery aims to minimize changes of the corneal anterior surface asphericity in order to reduce corneal ablation depth, which impacts mostly on visual quality.[43–45] However, there were conflicting reports about the postoperative visual recovery and corneal stability of Q-value-guided LASIK. Thus, to explore its safety and efficacy, we performed the current meta-analysis to compare Q-value-guided LASIK with standard LASIK.
Due to significant heterogeneity of the current meta-analysis, careful interpretation and search for influencing factors were required. LASIK for the correction of myopia is primarily concerned with production of refractive changes by corneal flattening in relation to the amount of refractive error. The Technolas was gradually approved for clinical use in China. It features a new algorithm with preoperative assessment of the Q-value together with subjective refraction. In presented research, the included studies mainly focused on Chinese and English literatures, which may influence the ultimate results. Additionally, differences in the study design should be considered as potential sources of heterogeneity. Sample size also have an impact on heterogeneity. The differences in the baseline, such as age or gender, are likely to be significant factors contributing to the results.
Actually, there are several important limitations. Firstly, only published studies may not provide sufficient evidences. Secondly, only English and Chinese literatures were explored, which may influence the ultimate results. Meanwhile, the extreme heterogeneity suggested there are potential or undiscovered factors. The impact of those factors could not be formally explored through subgroup analysis. Whereas, in spite of aforementioned limitations, it also has been proven that Q-value-guided LASIK is a safe, effective and predictable surgical options for treating myopia.
Author contributions
Conceptualization: Kai-Ping Zhang.
Data curation: Kai-Ping Zhang.
Formal analysis: Kai-Ping Zhang, Xiang Fang.
Investigation: Xiang Fang, Yin Zhang.
Methodology: Xiang Fang, Yin Zhang.
Project administration: Kai-Ping Zhang, Min Chao.
Resources: Kai-Ping Zhang.
Software: Kai-Ping Zhang,
Supervision: Kai-Ping Zhang, Min Chao.
Validation: Kai-Ping Zhang, Yin Zhang, Min Chao.
Visualization: Min Chao.
Writing – original draft: Yin Zhang, Min Chao.
Writing – review & editing: Kai-Ping Zhang, Xiang Fang, Yin Zhang, Min Chao.
Footnotes
Abbreviations: CI = confidence interval, HOA = higher order aberration, I2 = extent of inconsistency, LASIK = laser in situ keratomileusis, MD = mean difference, NOS = Newcastle-Ottawa Scale, OR = odds ratio, RCT = randomized controlled trials, SE = spherical equivalent, UCVA = uncorrected visual acuity.
How to cite this article: Zhang KP, Fang X, Zhang Y, Chao M. Comparison of Q-value-guided laser-assisted in situ keratomileusis and standard laser in situ keratomileusis for myopia: a meta-analysis. Medicine. 2020;99:45(e21563).
The authors have no conflicts of interest to disclose.
The datasets generated during and/or analyzed during the current study are publicly available.
D = diopter, DC = diopter of cylindrical power, DS = diopter of spherical power, LASIK = Laser in situ keratomileusis, NA = Not available, NOS = Newcastle-Ottawa Scale, RCT = Randomized controlled trial, SE = Spherical equivalent.
a,b two different case-control studies.
CI = confidence interval, HOA = higher order aberration, I2 = extent of inconsistency, MD = mean difference, OR = odds ratio, RCT = randomized controlled trials, SE = spherical equivalent, UCVA = uncorrected visual acuity.
CI = confidence interval, HOA = higher order aberration, I2 = extent of inconsistency, MD = mean difference, OR = odds ratio, RCT = randomized controlled trials.
CI = confidence interval, HOA = higher order aberration I2 = extent of inconsistency, MD = mean difference, OR = odds ratio, RCT = randomized controlled trials, SE = spherical equivalent, UCVA = uncorrected visual acuity.
References
- [1].Nowroozzadeh MH. School-based myopia prevention effort. JAMA 2016;315:819–20. [DOI] [PubMed] [Google Scholar]
- [2].Lin LL, Shih YF, Hsiao CK, et al. Prevalence of myopia in Taiwanese schoolchildren: 1983 to 2000. Ann Acad Med Singap 2004;33:27–33. [PubMed] [Google Scholar]
- [3].Li SM, Liu LR, Li SY, et al. Anyang childhood eye study group. design, methodology and baseline data of a school-based cohort study in central china: the anyang childhood eye study. Ophthalmic Epidemiol 2013;20:348–59. [DOI] [PubMed] [Google Scholar]
- [4].Wu HM, Seet B, Yap EP, et al. Does education explain ethnic differences in myopia prevalence? Apopulation-based study of young adult males in Singapore. Optom Vis Sci 2001;78:234–9. [DOI] [PubMed] [Google Scholar]
- [5].Jung SK, Lee JH, Kakizaki H, et al. Prevalence of myopia and its association with body stature and educational level in 19-year-old male conscripts in Seoul, South Korea. Invest Ophthalmol Vis Sci 2012;53:5579–83. [DOI] [PubMed] [Google Scholar]
- [6].Lazaridis A, Droutsas K, Sekundo W, et al. Corneal clarity and visual outcomes after small-incision lenticule extraction and comparison to femtosecond laser-assisted in situ keratomileusis. J Ophthalmol 2017;2017:5646390. [DOI] [PMC free article] [PubMed] [Google Scholar]
- [7].Oshika T, Miyata K, Tokunaga T, et al. Higher order wavefront aberrations of cornea and magnitude of refractive correction in laser in situ keratomileusis. Ophthalmology 2002;109:1154–8. [DOI] [PubMed] [Google Scholar]
- [8].Zhou C, Jin M, Wang X, et al. Corneal wavefront-guided ablation with the Schwind ESIRIS laser for myopia. J Refract Surg 2007;23:573–80. [DOI] [PubMed] [Google Scholar]
- [9].Liberati A, Altman DG, Tetzlaff J, et al. The PRISMA statement for reporting systematic reviews and meta-analyses of studies that evaluatehealth care interventions: explanation and elaboration. J Clin Epidemiol 2009;62:e1–34. [DOI] [PubMed] [Google Scholar]
- [10].Stang A. Critical evaluation of the Newcastle-Ottawa scale for the assessment of the quality of nonrandomized studies in meta-analyses. Eur J Epidemiol 2010;25:603–5. [DOI] [PubMed] [Google Scholar]
- [11].Trikalinos TA, Salanti G, Zintzaras E, et al. Meta-analysis methods. Adv Genet 2008;60:311–34. [DOI] [PubMed] [Google Scholar]
- [12].Higgins JP, Thompson SG. Quantifying heterogeneity in a meta-analysis. Stat Med 2002;21:1539–58. [DOI] [PubMed] [Google Scholar]
- [13].DerSimonian R, Laird N. Meta-analysis in clinical trials. Control Clin Trials 1986;7:177–88. [DOI] [PubMed] [Google Scholar]
- [14].Begg CB, Berlin JA. Publication bias and dissemination of clinical research. J Natl Cancer Inst 1989;81:107–15. [DOI] [PubMed] [Google Scholar]
- [15].Li J, Shen ZW, Ye Y. Comparative research of Q-value guided LASIK and standard LASIK on visual quality. Rec Adv Ophthalmol 2012;32:52–5. [Google Scholar]
- [16].Zheng H, Song L. Visual quality of Q-value-guided LASIK in the treatment of high myopia. Eye Sci 2011;26:208–10. [DOI] [PubMed] [Google Scholar]
- [17].Zhou L, Deng YP. Change of corneal asphericity and spherical aberration after Q-value customized LASIK. Rec Adv Ophthalmol 2010;30:250–3. [Google Scholar]
- [18].Xin BL, Liu SB, Lie XL, et al. Clinical research on Q-value customized LASIK. Journal of ocular trauma and occupational eye disease 2010;32:273–5. [Google Scholar]
- [19].Igarashi A, Kamiya K, Komatsu M, et al. Aspheric laser in situ keratomileusis for the correction of myopia using the technolas 217z100: comparison of outcomes versus results from the conventional technique. Jpn J Ophthalmol 2009;53:458–63. [DOI] [PubMed] [Google Scholar]
- [20].Villa C, Jiménez JR, Anera RG, et al. Visual performance after LASIK for a Q-optimized and a standard ablation algorithm. Appl Opt 2009;48:5741–7. [DOI] [PubMed] [Google Scholar]
- [21].Liu B, Zhao R, Shao DW, et al. Q-value adjusted customized laser in situ keratomileusis for the correction of myopia. Int J Ophthalmol 2008;8:1629–31. [Google Scholar]
- [22].Wei SF, Gao JL, Zheng XL. A clinical analysis of short-term effect of Q-value guided LASIK for myopia. J Tradit Chin Ophthalmol 2008;18:335–7. [Google Scholar]
- [23].Ma YN, Li XB, Ma FH, et al. The effect of 84 Q-value adjusted customized laser in situ keratomileusis for myopia. Shandong Medical Journal 2008;48:49–50. [Google Scholar]
- [24].Zou GC, Ye JJ, Hua FF. The clinical effect of Q-value adjusted customized laser in situ keratomileusis for myopia. J Clin Ophthalmol 2008;16:358–9. [Google Scholar]
- [25].Xu K, Xiao YQ, Ye W. Contrast sensitivity and glare sensitivity after F-CAT LASIK. Chinese Journal of Optometry & Ophthalmology 2008;10:47–50. [Google Scholar]
- [26].Zhou J, Xia LK, Gao DW, et al. Clinical research on wave front-guided combing Q-value guided optimized aspheric transition zone LASIK. Int J Ophthalmol 2008;8:766–8. [Google Scholar]
- [27].Cai FR, Bai LN. Short-term outcome of aspheric ablation excimer laser corneal refractive surgery. Chin Ophthalmol Res 2008;26:617–20. [Google Scholar]
- [28].Huang GF, Yang B, Wang Z, et al. Clinical studies on Q-factor guided LASIK for the correction of myopic astigmatism. Chin J Ophthalmol 2008;44:820–4. [PubMed] [Google Scholar]
- [29].Chen SH, Li B, Wang QM. Clinical efficacy of the Q-value adjusted customized laser in situ keratomileusis for myopia correction. Chinese Journal of Optometry & Ophthalmology 2007;9:158–62. [Google Scholar]
- [30].Liu L, Su J, Li XY, et al. Clinical efficacy of the Q-value adjusted customized laser in situ keratomileusis (LASIK) and standard LASIK for myopia. Journal of ocular trauma and occupational eye disease 2007;29:846–8. [Google Scholar]
- [31].Shen ZW, Zhou HZ, Yin H, et al. Fine adjusted-customized ablation LASIK treatment for myopia. Int J Ophthalmol 2005;5:1194–7. [Google Scholar]
- [32].Koller T, Iseli HP, Hafezi F, et al. Q-factor customized ablation profile for the correction of myopic astigmatism. J Cataract Refract Surg 2006;32:584–9. [DOI] [PubMed] [Google Scholar]
- [33].Jing Q, Tang Y, Qian D, et al. Posterior Corneal characteristics of cataract patients with high myopia. PLoS One 2016;11:e0162012. [DOI] [PMC free article] [PubMed] [Google Scholar]
- [34].Shetty R, Francis M, Shroff R, et al. Corneal biomechanical changes and tissue remodeling after SMILE and LASIK. Invest Ophthalmol Vis Sci 2017;58:5703–12. [DOI] [PubMed] [Google Scholar]
- [35].Camps VJ, Piñero DP, Mateo V, et al. Clinical validation of adjusted corneal power in patients with previous myopic LASIK surgery. J Ophthalmol 2015;2015:824293. [DOI] [PMC free article] [PubMed] [Google Scholar]
- [36].Xiong Y, Li J, Wang N, et al. The analysis of corneal asphericity (Q value) and its related factors of 1,683 Chinese eyes older than 30 years. PLoS One 2017;12:e0176913. [DOI] [PMC free article] [PubMed] [Google Scholar]
- [37].Moshirfar M, Jehangir N, Fenzl CR, et al. LASIK enhancement: clinical and surgical management. J Refract Surg 2017;33:116–27. [DOI] [PubMed] [Google Scholar]
- [38].Chalita MR, Chavala S, Xu M, et al. Wavefront analysis in post-LASIK eyes and its correlation with visual symptoms, refraction, and topography. Ophthalmology 2004;111:447–53. [DOI] [PubMed] [Google Scholar]
- [39].Khairat YM, Mohamed YH, Moftah IA, et al. Evaluation of corneal changes after myopic LASIK using the Pentacam®. Clin Ophthalmol 2013;7:1771–6. [DOI] [PMC free article] [PubMed] [Google Scholar]
- [40].De Ortueta D, Arba Mosquera S, Baatz H. Comparison of standard and aberraton-neutral profiles for myopic LASIK with the SCHWIND ESIRIS platform. J Refract Surg 2009;25:339–49. [DOI] [PubMed] [Google Scholar]
- [41].Yamane N, Miyata K, Samejima T, et al. Ocular higher-order aberrations and contrast sensitivity after conventional laser in situ keratomileusis. Invest Ophthalmol Vis Sci 2004;45:3986–90. [DOI] [PubMed] [Google Scholar]
- [42].Mrochen M, Kaemmerer M, Mierdel P, et al. Increased higher-order optical aberrations after laser refractive surgery: a problem of subclinical decentration. J Cataract Refract Surg 2001;27:362–9. [DOI] [PubMed] [Google Scholar]
- [43].Damgaard IB, Ang M, Farook M, et al. Intraoperative patient experience and postoperative visual quality after SMILE and LASIK in a randomized, paired-eye. Controlled Study J Refract Surg 2018;34:92–9. [DOI] [PubMed] [Google Scholar]
- [44].Li M, Zhao J, Shen Y, et al. Comparison of dry eye and corneal sensitivity between small incision lenticule extraction and femtosecond LASIK for myopia. PLoS One 2013;8:e77797. [DOI] [PMC free article] [PubMed] [Google Scholar]
- [45].Brenner JE, Fadlallah A, Hatch KM, et al. Accuracy of visual estimation of LASIK flap thickness. J Refract Surg 2017;33:765–7. [DOI] [PubMed] [Google Scholar]