

Background:
Facelifts are frequently combined with fat injection to restore volume. However, the efficacy of simultaneous fat grafting has not been objectively evaluated in a large number of patients that includes a control group. This study was undertaken to fill this gap in our knowledge base.
Methods:
A retrospective comparative cohort study was undertaken among 100 patients who underwent a subsuperficial musculoaponeurotic system facelift with (n = 61) or without (n = 39) simultaneous malar fat injection. Rigorously standardized photographs were obtained 1, 3, and 6 months after surgery, including oblique photographs with the nasion aligned with the far inner canthus. Malar projection and area were measured with the assistance of a computer imaging software.
Results:
Fat injection produced a significant (P < 0.001) increase in right and left malar projection. The mean increase in projection was 3 mm, significantly greater than control patients, who also demonstrated a significant (P < 0.001) but more modest (<1 mm) increase. Malar projection was significantly correlated with the fat injection volume (P ≤ 0.001). The increase was sustained at follow-up times up to 6 months, and 1 year in a smaller patient cohort (n = 44), with no evidence of a decline or rebound. The calculated fat retention was 34%.
Conclusions:
Fat injection at the time of a facelift effectively adds malar volume, and this increase is sustained at time points up to 1 year after surgery, consistent with the cell survival theory.
INTRODUCTION
Traditional facelift methods typically involve tissue transposition, such as malar fat pad elevation1–7 or buccal fat pad transposition.8 However, these maneuvers have not been shown to effectively augment volume.9,10 Over the last 2 decades, the importance of restoring facial volume at the time of a facelift by lipofilling has been well-recognized by plastic surgeons.7,9–18 Indeed, any net increase is impossible without importing tissue.18 Fat injection has been shown to provide a net increase in volume,13,15,18 but its effect has not been quantitated in a large number of patients and compared with a control group to identify changes directly attributable to fat injection.18
One problem for investigators is the imaging method. Three-dimensional photography would seem to be the most appropriate for this purpose.5,19–23 However, volume changes are difficult to calculate using this method because of error inherent in registering images, which may exceed the magnitude of minor volume changes from fat injection.22 Malar projection has been measured by the author in a small number of patients (n = 5) using magnetic resonance imaging.13 Although accurate, this method is expensive and impractical for evaluating a large number of patients and controls.13,19,20
Malar projection measured on matched photographs facilitates photographic comparisons and measurements.9,10,18,24 This method allows comparison of a large number of patients treated with a facelift alone versus a facelift in combination with fat injection. By repeating measurements at subsequent time points, the longevity of injected fat may be evaluated. Longitudinal measurements are also helpful in determining the relative roles of fat cell survival versus replacement.
By measuring the area of the recipient site, and multiplying it by the change in depth, an approximation may be made regarding increment in volume.25 This calculation may be compared with the injection volume to determine fat retention.
PATIENTS AND METHODS
Patients
A retrospective cohort study was undertaken among 225 facelift patients treated between January 2009 and September 2019. These patients were also the subject of a recently published clinical study.18 An exemption from Institutional Review Board oversight was obtained from Advarra IRB (Columbia, Md.).
Surgery
All surgery was performed by the author at the Surgery Center of Leawood, Kansas, a state-licensed ambulatory surgery center. A total intravenous anesthetic was administered using a propofol infusion and a laryngeal mask airway. Starting in 2013, all patients were evaluated with ultrasound scans to check for deep venous thrombosis.26 Doppler ultrasound scans were scheduled before surgery, the day after surgery, and approximately 1 week after surgery. Anticoagulation was prescribed only for patients who developed a deep venous thrombosis. Sequential compression devices were discontinued in 2016 because of a lack of proven efficacy.26,27
All patients underwent a subsuperficial musculoaponeurotic system (sub-SMAS) facelift, with no temporal incision.18 The zygomatic28 and masseteric29 cutaneous retaining ligaments were released, and the SMAS flap was transposed superiorly and sutured to the deep temporalis fascia using 4-0 PDS sutures (Ethicon, Somerville, N.J.) (Vector 1). The lateral orbital thickening30 was preserved. A temporary “temple roll” of redundant skin was allowed to settle spontaneously.18 The platysma was plicated to the sternomastoid fascia laterally (Vector 2). A submental incision was used for liposuction and a corset platysmaplasty (Vector 3).31
Fat Injection
After the facelift and cervicoplasty were completed, fat was harvested, usually from the abdomen, using the Lipivage system (Genesis Biosystems, Lewisville, Tex.). The fat was immediately injected into the undissected subcutaneous tissue layer between the SMAS and the skin. Periorbital rejuvenation was accomplished by lipofilling, without redraping the orbicularis muscle. The cheek was injected in continuity with the nasojugal groove32 (tear trough33), using a single incision in the upper lateral cheek (Fig. 1) and a 9-cm type I Coleman injection cannula.
Fig. 1.
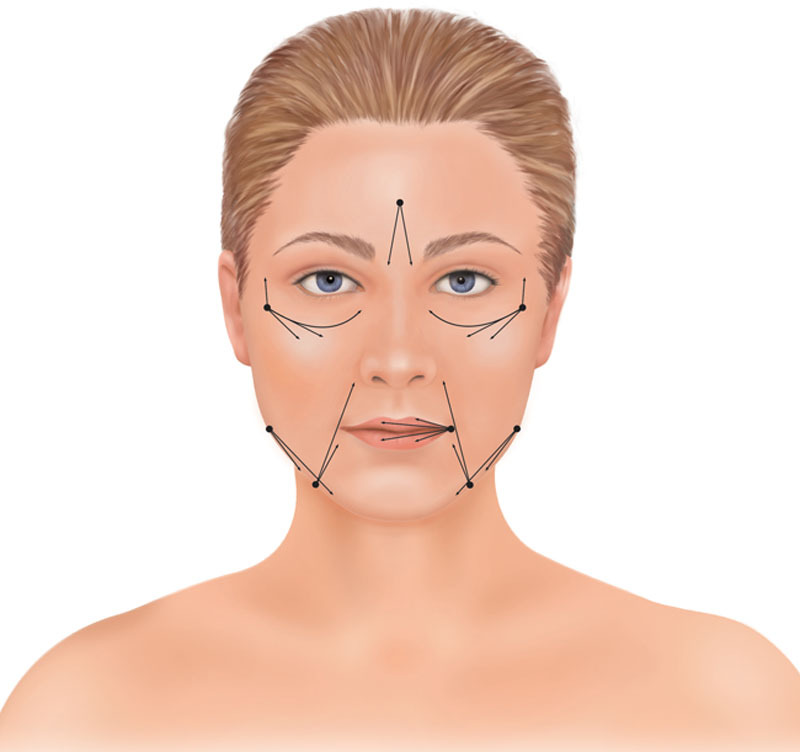
Illustration of fat injection sites. A 2-mm incision over the upper lateral cheek was used for gaining access to the cheek and tear trough recipient sites, taking care to inject inferior to the orbicularis retaining ligament. The cannula follows the curved trajectory of the nasojugal groove. Additional fat is injected using a straight trajectory subcutaneously to the upper cheek. In some patients, the temple is accessed using the same entry point for fat grafting. Other areas that are frequently treated include the nasolabial creases, labiomandibular creases, lips, glabella, and the prejowl depression. Reprinted from Plast Reconstr Surg 2011;127:2057–2065.
Other treatment areas included the lips, nasolabial creases, jawline, temples, and glabella (Fig. 1). Videos demonstrating the technique are published separately.18
Photographs
All photographs were taken by the author using the same Nikon digital camera and 60 mm lens (Nikon, Tokyo, Japan), blue background, lighting, and focal distance. Patients were photographed with a neutral, nonsmiling gaze (Figs. 2–5). Patients were instructed not to wear makeup at the time of their appointments. Jewelry was removed for photographs. Oblique photographs were taken with the far inner canthus aligned with the nasion to standardize the degree of rotation.34
Fig. 2.

Photographs of a 56-year-old woman (Case 1) before (A), 1 (B), 3 (C), and 6 months (D) after a facelift. She elected not to have simultaneous fat injection.
Fig. 5.

Photographs of a 55-year-old woman (Case 3) before (A), 1 month (B), 3 months (C), 6 months (D), 1 year (E), and 2 years (F) after a facelift, carbon dioxide laser skin resurfacing, and facial fat transfer, with injection of 7 ml of fat into each cheek. She underwent upper blepharoplasties 13 months after her original surgery.
No patient underwent injection of commercial filler or additional fat injection into the malar areas, or any other facial surgery, before the final photographs were taken, with the exception of 1 patient who underwent subsequent upper blepharoplasties, which were outside the study area (Fig. 5). Postoperative appointments were typically scheduled 1 month, 3 months, 6 months, and 1 year after surgery.
Measurements
The injection area was measured for each patient (Fig. 4). The injection boundaries were the inferior orbital rim superiorly, the nasal border of the nasojugal groove medially, the mid-cheek at the level of the zygomatic ligament inferiorly, and the lateral cheek, without extending over the zygomatic arch. A ruler was included in one of the images for calibration of photographs. The area measurement function of the Canfield 7.4.1 Mirror imaging system (Canfield Scientific, Fairfield, N.J.) was used to calculate areas (Fig. 4).
Fig. 4.

Frontal preoperative photograph of the 51-year-old woman depicted in Fig. 3 (Case 2), with a ruler shown for calibration. The hatched areas correspond to the areas treated with fat injection. The Canfield 7.4.1 Mirror imaging software was used to calculate area measurements.
Photographs were matched for size and orientation using the Canfield imaging software, correcting small differences in tilt and magnification. Fixed landmarks outside the surgical areas were used for matching, typically the inner canthus and the base of the columella. The point of maximum malar projection was measured (Figs. 2, 3, and 5).13
Fig. 3.

Photographs of a 51-year-old woman (Case 2) before (A), 1 (B), 3 (C), and 6 months (D) after a facelift, erbium-YAG laser skin resurfacing, and facial fat transfer, with injection of 4 ml of fat into each cheek.
Statistical Analysis
Statistical analyses were performed using SPSS for Mac version 26.0 (SPSS, Inc., Chicago, Ill.). Pearson correlation coefficients were used to compare 2 continuous variables. Independent t tests were used to compare means between 2 groups, and chi-square tests were used to compare frequencies for categorical variables. Repeated-measures analysis of variance was used to compare measures over time. A value of P < 0.01 was considered significant. Reliability between left and right measurements was assessed by computing Cronbach’s α.
An a priori power analysis35 was performed for the t tests. To achieve 80% power, with an alpha level of 0.05, sufficient to detect a large-sized treatment effect (d = 0.80)36 with a 2-sided test, a minimum of 26 patients would be needed in each group. An a priori power analysis35 was also performed for the repeated-measures analysis of variance. To achieve 80% power, with an alpha level of 0.05, sufficient to detect a medium-sized treatment effect (f = 0.25),36 and a correlation among repeated measures of 0.50, 24 patients would be needed.
RESULTS
Photographs at all 4 time points—preoperative, 1, 3, and 6 months—were available for 100 patients of the 225 total patients (inclusion rate, 44%). Sixty-one facelift patients received malar fat injection and 39 facelift patients did not (Table 1). The mean follow-up time for the 100 study patients was 30 months. Comparisons of the treatment and control groups revealed no significant difference in age, follow-up time, sex, smoking status, secondary surgery, body mass index, or frequency of combination procedures.
Table 1.
Patient Data*
| Characteristic | Fat Injection (%) | Control (%) | All Patients | P |
|---|---|---|---|---|
| No. of patients | 61 | 39 | 100 | |
| Age, y | ||||
| Mean | 59.4 | 58.0 | 58.9 | NS |
| Range | 43–79 | 41–74 | 41–79 | |
| Follow-up time, mo | ||||
| Mean | 26.9 | 34.4 | 29.8 | NS |
| Range | 6.0–125.2 | 6.0–127.7 | 6.0–127.7 | |
| Sex | ||||
| Female | 56 (92) | 32 (82) | 88 (88) | NS |
| Male | 5 (8) | 7 (20) | 12 (12) | |
| Smoking status | ||||
| Nonsmoker | 52 (85) | 33 (85) | 85 (85) | NS |
| Smoker | 9 (15) | 6 (15) | 15 (15) | |
| Previous facelift | ||||
| No | 48 (79) | 30 (77) | 78 (78) | NS |
| Yes | 13 (21) | 9 (23) | 22 (22) | |
| BMI, kg/m2 | ||||
| Mean | 24.1 | 25.3 | 24.5 | NS |
| Range | 15.6–38.6 | 18.2–37.6 | 15.6–38.6 | |
| Right cheek fat volume, ml | ||||
| Mean | 7.05 | — | — | — |
| Range | 2.0 – 13.0 | |||
| Left cheek fat volume, ml | ||||
| Mean | 7.02 | — | — | — |
| Range | 2.0–15.0 | |||
| Right malar area, cm2 | ||||
| Mean | 11.67 | — | — | — |
| Range | 8.85–13.68 | |||
| Left malar area, cm2 | ||||
| Mean | 11.88 | — | — | — |
| Range | 8.73–13.50 | |||
| Combined with breast surgery | ||||
| No | 57 (93) | 35 (90) | 92 (92) | NS |
| Yes | 4 (7) | 4 (10) | 8 (8) | |
| Combined with body surgery | ||||
| No | 47 (77) | 32 (82) | 79 (79) | NS |
| Yes | 14 (23) | 7 (18) | 21 (21) |
Independent t-tests were used to compare means between the fat injection and control groups. Chi-square tests were used to compare frequencies between the fat injection and control groups.
BMI, body mass index; NS, not significant.
One woman developed a subclinical deep venous thrombosis, detected on a Doppler ultrasound scan the day after surgery. A distal thrombosis of the right posterior tibial vein was treated with rivaroxaban 15 mg bid for 3 weeks and then 20 mg daily for 3 months. The thrombosis resolved in 6 weeks, as documented on follow-up scans. No complications occurred related to the fat injections. There was no significant difference in complication rates comparing patients treated with and without fat injection (Table 2).
Table 2.
Complications
| Facelift+ Fat Injection (%) | Facelift (%) | All Procedures (%) | P | |
|---|---|---|---|---|
| No. of patients | 61 | 39 | 100 | |
| Complications | ||||
| No | 41 (67.2) | 31 (79.5) | 72 (72.0) | NS |
| Yes | 20 (32.8) | 8 (20.5) | 28 (28.0)* | |
| Deep venous thrombosis | 1 | 0 | 1 | |
| Neuropraxia | ||||
| Frontal | 2 | 1 | 3 | |
| Buccal | 2 | 1 | 3 | |
| Zygomatic | 1 | 0 | 1 | |
| Scar deformity | ||||
| Facelift | 2 | 1 | 3 | |
| Forehead lift | 1 | 0 | 1 | |
| Persistent skin laxity | ||||
| Face | 6 | 2 | 8 | |
| Eyelids | 1 | 0 | 1 | |
| Seroma | 2 | 1 | 3 | |
| Hematoma | 2 | 1 | 3 | |
| Malar edema | 2 | 1 | 3 | |
| Persistent neck pleat | 2 | 1 | 3 | |
| Delayed wound healing | 0 | 1 | 1 | |
| Infection | 0 | 0 | 0 | |
| Total complications | 24 | 10 | 34 |
Six patients had 2 complications each. Therefore, the total number of complications exceeds the number of patients who had complications.
NS, not significant.
In patients treated with malar fat injection, the right mean malar projection increased 0.31 cm 1 month after surgery. Left malar projection increased 0.29 cm on average (both P < 0.001) (Figs. 6 and 7). There was no significant difference comparing measurements at 1 month, 3 months, and 6 months on either side (Table 3). Cronbach’s α testing of left and right reliability found levels greater than 0.70 for the preoperative and all follow-up appointments. A significant correlation was demonstrated between fat injection volumes and increase in malar projection at 6 months (right, r = 0.41, P = 0.001; left, r = 0.60, P < 0.001) (Figs. 8 and 9). Malar projection increased 0.09 cm on average on both sides 1 month after surgery in control patients (P < 0.001). Postoperative measurements in control patients were not significantly different comparing values at 1, 3, and 6 months.
Fig. 6.

Mean right malar projection versus time. Fat injection patients are represented in red, and control patients in blue. Data are presented as estimated marginal means with 95% confidence intervals.
Fig. 7.

Mean left malar projection versus time. Fat injection patients are represented in red, and control patients in blue. Data are presented as estimated marginal means with 95% confidence intervals.
Table 3.
Malar Projection Measurement Data*
| Parameter | Preoperative | 1 mo | 3 mos | 6 mos | P |
|---|---|---|---|---|---|
| Control patients (n = 39): | |||||
| Right malar projection (cm) | |||||
| Mean | 2.70 | 2.79 | 2.79 | 2.76 | <0.001 |
| SD | 0.25 | 0.27 | 0.28 | 0.26 | |
| Range | 2.18–3.21 | 2.20–3.38 | 2.28–3.31 | 2.25–3.31 | |
| Left malar projection (cm) | |||||
| Mean | 2.56 | 2.65 | 2.62 | 2.63 | 0.002 |
| SD | 0.29 | 0.31 | 0.29 | 0.32 | |
| Range | 2.01–3.11 | 2.09–3.46 | 2.03–3.23 | 2.02–3.29 | |
| Fat injection patients (n = 61): | |||||
| Right malar projection (cm) | |||||
| Mean | 2.70 | 3.01 | 3.00 | 3.00 | <0.001 |
| SD | 0.27 | 0.27 | 0.27 | 0.24 | |
| Range | 1.98–3.43 | 2.38–3.72 | 2.31–3.66 | 2.49–3.60 | |
| Left malar projection (cm) | |||||
| Mean | 2.55 | 2.84 | 2.84 | 2.84 | <0.001 |
| SD | 0.26 | 0.27 | 0.26 | 0.26 | |
| Range | 1.99–3.26 | 2.22–3.59 | 2.26–3.45 | 2.14–3.45 |
Repeated-measures analyses of variance were computed to test for mean differences between time points separately for the treatment and control groups.
The P values refer to the comparisons between the preoperative measurements and all other time points. All preoperative measurements were significantly different from all postoperative measurements. No postoperative measurements were significantly different from each other.
Fig. 8.

Increase in right malar projection versus malar fat injection volume. A significant (P = 0.001) correlation is demonstrated.
Fig. 9.

Increase in left malar projection versus malar fat injection volume. A significant (P < 0.001) correlation is demonstrated.
A subset of 44 patients with additional photographs and measurements available 1 year after surgery was also evaluated, consisting of 28 treatment patients (Fig. 5) and 16 control patients. No significant differences were detected comparing left and right malar projection measurements at 6 months and 1 year, for both treatment and control patients. The 1-year values remained significantly greater than the preoperative values (all P values < 0.01, except left control, P = 0.02).
Fat retention was calculated in patients who received malar fat injection. The mean increase in malar projection at 6 months was 0.30 cm on the right side and 0.29 cm on the left. The 0.09 cm increase in control patients suggests that malar fat elevation accounts for approximately one-third of this increase in projection. Malar treatment areas averaged 11.7 and 11.9 cm2, respectively. The calculated volume increases were therefore 2.46 cm3 for the right cheek (0.21 cm × 11.7 cm2) and 2.38 cm3 (0.20 cm × 11.9 cm2) for the left cheek. The mean fat injection volumes were 7.05 ml on the right side and 7.02 ml on the left side. The calculated fat retention was therefore 34.9% for the right cheek and 33.9% for the left cheek.
DISCUSSION
Assessment of facial aesthetic outcomes is largely subjective.14,22 A recent systematic review of fat grafting combined with facelift surgery37 identified only 5 studies that included objective measurements.13,19,20,22,23 Four of these studies included fewer than 10 patients.13,19,22,23
Three-dimensional photography using the Canfield Vectra 3D camera provides color-coded renderings, with blue showing the areas of volume enhancement and red showing volume reduction.5,22 This technology would seem to be ideal for objectively assessing facial volume changes. However, there are limitations. Mailey et al22 found this measuring tool was “not user-friendly,” making it difficult to obtain consistent, reproducible results. Any slight variation in registering the superimposed images introduces error.9,19,20,22,38 Frequently, landmarks that are not expected to change in volume after surgery appear blue or red (eg, the chin or forehead).19 3D measurements are very time-consuming; achieving good registration for a single patient takes 1 hour.22 Mailey et al22 concluded that this device was not sufficiently accurate for routine comparisons of small changes in facial volume. A neutral facial expression is essential when using any measurement system, whether 2D or 3D.38 A slight smile or frown can completely overwhelm the magnitude of the filler’s effect.38
Error is compounded when measurements are multiplied, as occurs in 3 dimensions. Measurement of malar projection reduces the potential for error by using a single measurement. Only standard 2D photography is required, avoiding an excessive time commitment on the part of the surgeon or patient, and improving compliance and inclusion rates. The time spent matching photographs and making the malar projection measurements at all time points is about 10 minutes for both sides per patient.
The distance from the photographer to the patient is likely to vary slightly between photographs. The Canfield system corrects these small differences by matching the image size. For example, if a preoperative image is slightly smaller because the photographer is standing farther away from the patient, it will be magnified to match the corresponding postoperative image. The vertical level used to measure malar projection may vary. In this study, the same plane was used to make the measurements, avoiding error created by measuring malar projection at different vertical levels.
In the present study, fat was injected into the superficial malar compartment. The orbicularis retaining ligament assists by acting as a superior barrier. Fat was injected simultaneously into the tear trough, which is situated along the medial one-third of the periorbital hollow, just below the orbital rim.39
In 2007, Rohrich and Pessa40 described the subcutaneous compartments of the face. Recent cadaveric studies add to our knowledge of facial fat compartments and their response to fillers.41–43 Schenck et al41 reported that injection of filler into the superficial medial cheek fat compartment, corresponding to the malar fat pad,44 increased projection without inferior displacement of filler. The tear trough did not stain with dye, indicating that this structure does not correspond to a subcutaneous fat compartment, but is situated between the superficial nasolabial and medial cheek fat compartments.41 Cotofana et al42 documented a very high (r = 0.992) correlation between the injected volume of filler and the change in surface projection of the sub–orbicularis oculi fat compartments, contained by the orbicularis retaining ligament superiorly and the zygomaticocutaneous ligament inferiorly. In contrast, injection of filler into the deep medial cheek fat compartment had a much lower correlation coefficient (r = 0.745). The authors conclude that deep injection of filler is least efficient because overlying structures mask the augmentation effect.42
In calculating volume increases, this study considers the projection of the injected area to be increased uniformly. Interestingly, Schreiber et al43 reported a nearly linear increase in projection after the first 2 ml of filler are injected into the lateral sub–orbicularis oculi fat compartment.45 As additional filler is injected into this space, almost all of the volume increment is directed anteriorly, contained by the floor and walls of the fat compartment.
In performing a sub-SMAS facelift, the author preserves an undissected tissue plane between the skin and the SMAS.18 There is no separation of vectors for the skin and SMAS; the tissue planes move vertically as one unit. This recipient site is well-suited for fat injection. If the surgeon dissects in this plane, there is less opportunity for fat survival, which depends on well-vascularized recipient tissue for viability.11,46–48 Another advantage of an injection plane superficial to the SMAS is that the fat is not compressed by a tightened fascial plane.10,18
A superficial injection plane fits with the known pathology of facial aging. The sub-SMAS retaining ligaments are not attenuated.18 The zygomatic and masseteric ligaments deep to the SMAS are sturdy structures, sometimes making an audible snap when released.18 Their more superficial branches, which are fine terminal extensions that arborize superficial to the SMAS,49 have weakened, allowing (along with fat atrophy50,51) tissue relaxation and descent.52 The lax, deflated tissues respond well to radial (ie, outward) expansion, which takes up the slack, contributing to the lift effect of the facelift.15,18
The author prefers to harvest the fat after the facelift and inject immediately so as to reduce ischemia time for the transferred adipocytes. The facial tissues have already been elevated, making fat placement more accurate. Because this is the last procedure for most patients, the patient’s head may be elevated quickly in the recovery room, reducing swelling. The mean total facial fat volume injected in this study, including other areas of the face, was 38 ml (range, 15–66 ml), similar to other series.22,37
When injecting the fat from a lateral cheek incision, as opposed to injecting from below, it is easy to stay parallel to the orbicularis retaining ligament and not risk penetrating it. Fat must not be injected into the lower eyelid. It is essential to avoid an unwelcome oval bulge or “sausage” appearance.39 By injecting small volumes (<1 ml) evenly along the tear trough and more liberally over the cheek, this problem may be avoided. Because there is very little subcutaneous tissue superficial to the orbicularis oculi,39 fat injection in this area is submuscular, not subcutaneous.18 Fat harvesting and injection is accomplished in less than 30 mins, avoiding excessive operating times for the combined procedure.18 Traditional microinjection16,48 requires hundreds of strokes of the cannula, increasing tissue trauma, swelling, and operating time. Shear stress53 is minimized by using a cannula with a sufficiently large internal diameter (1.2 mm), and by limiting the injection rate to approximately 1 ml/s.
Because the recipient site is located superficially and circumscribed by fascial septa,40 linear increases in projection are directly related to filler volume.42,43 Comparisons of fat injection volume and malar projection showed a significant correlation (P ≤ 0.001). A notable finding was that control patients, who were not treated with fat injection, also demonstrated a significant (P < 0.01) increase in malar projection, albeit a modest one (<1 mm). This benefit, which persisted 6 months and 1 year after surgery, is likely caused by elevation of the malar fat pad. The fact that the regression lines do not start at zero is consistent with a malar fat pad elevation effect. The few data points that show a decrease are likely caused by reading error, produced by slight differences in head rotation (Figs. 8 and 9).
The 2 theories of fat retention are either fat cell survival or fat cell replacement.54,55 Most surgeons subscribe to the fat cell survival theory, as originally proposed by Peer56 and endeavor to optimize the conditions for fat cell viability by using atraumatic technique.54 However, several recent investigators report a late decrease (3–10 months after injection) in malar projection followed by a “rebound,”19,20,23 which might suggest fat cell replacement. By contrast, the findings of the present study, and a previous study using magnetic resonance imaging,13 support the fat cell survival theory. There was no evidence of a decrease in malar projection at 3 months, 6 months, 1 year, or even later time points (Fig. 5). According to the fat cell replacement theory, the injected adipocytes die within a few days of injection.54,57,58 New adipocytes are created from adipose-derived precursor cells that are less susceptible to hypoxia. These “replacement” cells start forming within 1 week of fat transfer,54,57,58 and the process is completed in 3 months.58 Consequently, the volume loss should occur early, coincident with the loss of the transferred adipocytes, not several months later. No known physiological explanation accounts for a protracted lag time (ie, >6 months)19,20,23 before volume restoration by adipogenesis.
Although some investigators have reported increased fat retention with separation of the stromal vascular fraction,19–21 any advantage remains inconclusive.20,24 Several studies find no reliable evidence of a superior fat-harvesting method59–63 or fat donor site.60–63
Limitations of the Study
The study findings pertain only to a sub-SMAS facelift and superficial fat injection. No information is available regarding volume changes that may take place over 1 year after surgery. Any measurement method is affected by difficulty in exactly aligning images, introducing error. An in-line filtration device was used to separate fat. Volumes may not be exactly comparable with fat separated by centrifugation.
Strengths of the Study
Rigorous photographic standardization and objective measurements provide quantitative data in a large number of patients, with a control group. The study was adequately powered to detect a treatment effect. All patients were treated using the same facelift and fat injection method, reducing the influence of confounding variables.
CONCLUSIONS
Fat injection at the time of a facelift adds malar volume. The calculated fat retention is 34%. The increase is sustained at postoperative time points 6 months and beyond, supporting the fat cell survival theory.
ACKNOWLEDGMENTS
The author thanks Jane Zagorski, PhD, for statistical analyses, Christina Staab, RT, for data collection, and Gwendolyn Godfrey for illustrations.
Footnotes
Published online 22 October 2020.
Disclosure: Dr. Swanson receives royalties from Springer Nature (Cham, Switzerland).
REFERENCES
- 1.De Cordier BC, de la Torre JI, Al-Hakeem MS, et al. Rejuvenation of the midface by elevating the malar fat pad: review of technique, cases, and complications. Plast Reconstr Surg. 2002;110:1526–1537.discussion 1537. [DOI] [PubMed] [Google Scholar]
- 2.Stuzin JM. Restoring facial shape in face lifting: the role of skeletal support in facial analysis and midface soft-tissue repositioning. Plast Reconstr Surg. 2007;119:362–376; discussion 377. [DOI] [PubMed] [Google Scholar]
- 3.Warren RJ, Aston SJ, Mendelson BC. Face lift. Plast Reconstr Surg. 2011;128:747e–764e. [DOI] [PubMed] [Google Scholar]
- 4.Narasimhan K, Stuzin JM, Rohrich RJ. Five-step neck lift: integrating anatomy with clinical practice to optimize results. Plast Reconstr Surg. 2013;132:339–350. [DOI] [PubMed] [Google Scholar]
- 5.Jacono AA, Malone MH, Talei B. Three-dimensional analysis of long-term midface volume change after vertical vector deep-plane rhytidectomy. Aesthet Surg J. 2015;35:491–503. [DOI] [PubMed] [Google Scholar]
- 6.Derby BM, Codner MA. Evidence-based medicine: face lift. Plast Reconstr Surg. 2017;139:151e–167e. [DOI] [PubMed] [Google Scholar]
- 7.Wan D, Dayan E, Rohrich RJ. Safety and adjuncts in face lifting. Plast Reconstr Surg. 2019;144:471e–484e. [DOI] [PubMed] [Google Scholar]
- 8.Bitik O. Sub-SMAS transposition of the buccal fat pad. Aesthet Surg J. 2020;40:NP114–NP122. [DOI] [PubMed] [Google Scholar]
- 9.Swanson E. Does a deep-plane facelift restore malar volume without simultaneous fat injection? Aesthet Surg J. 2016;36:NP30–NP31. [DOI] [PubMed] [Google Scholar]
- 10.Swanson E. Does sub-SMAS buccal fat pad transposition augment malar volume in facelift patients? Aesthet Surg J. 2020;40:NP416–NP418. [DOI] [PubMed] [Google Scholar]
- 11.Guerrerosantos J. Simultaneous rhytidoplasty and lipoinjection: a comprehensive aesthetic surgical strategy. Plast Reconstr Surg. 1998;102:191–199. [DOI] [PubMed] [Google Scholar]
- 12.Trepsat F. Volumetric face lifting. Plast Reconstr Surg. 2001;108:1358–70; discussion 1371. [DOI] [PubMed] [Google Scholar]
- 13.Swanson E. Malar augmentation assessed by magnetic resonance imaging in patients after face lift and fat injection. Plast Reconstr Surg. 2011;127:2057–2065. [DOI] [PubMed] [Google Scholar]
- 14.Swanson E. Objective assessment of change in apparent age after facial rejuvenation surgery. J Plast Reconstr Aesthet Surg. 2011;64:1124–1131. [DOI] [PubMed] [Google Scholar]
- 15.Rohrich RJ, Ghavami A, Constantine FC, et al. Lift-and-fill face lift: integrating the fat compartments. Plast Reconstr Surg. 2014;133:756e–767e. [DOI] [PubMed] [Google Scholar]
- 16.Marten TJ, Elyassnia D. Fat grafting in facial rejuvenation. Clin Plast Surg. 2015;42:219–252. [DOI] [PubMed] [Google Scholar]
- 17.Sinno S, Mehta K, Reavey PL, et al. Current trends in facial rejuvenation: an assessment of ASPS Members’ use of fat grafting during face lifting. Plast Reconstr Surg. 2015;136:20e–30e. [DOI] [PubMed] [Google Scholar]
- 18.Swanson E. Clinical evaluation of 225 Sub-SMAS facelifts with no temporal incision. Plast Reconstr Surg Glob Open. 2020;8:e2640. [DOI] [PMC free article] [PubMed] [Google Scholar]
- 19.Gerth DJ, King B, Rabach L, et al. Long-term volumetric retention of autologous fat grafting processed with closed-membrane filtration. Aesthet Surg J. 2014;34:985–994. [DOI] [PubMed] [Google Scholar]
- 20.Sasaki GH. The safety and efficacy of cell-assisted fat grafting to traditional fat grafting in the anterior mid-face: an indirect assessment by 3D imaging. Aesthetic Plast Surg. 2015;39:833–846. [DOI] [PubMed] [Google Scholar]
- 21.Schendel SA. Enriched autologous facial fat grafts in aesthetic surgery: 3D volumetric results. Aesthet Surg J. 2015;35:913–919. [DOI] [PubMed] [Google Scholar]
- 22.Mailey B, Baker JL, Hosseini A, et al. Evaluation of facial volume changes after rejuvenation surgery using a 3-dimensional camera. Aesthet Surg J. 2016;36:379–387. [DOI] [PubMed] [Google Scholar]
- 23.Cohen SR, Hewett S, Ross L, et al. Progressive improvement in midfacial volume 18 to 24 months after simultaneous fat grafting and facelift: an insight to fat graft remodeling. Aesthet Surg J. 2020;40:235–242. [DOI] [PubMed] [Google Scholar]
- 24.Swanson E. Does separating the stromal vascular fraction improve facial fat retention? Plast Reconstr Surg. 2016;137:637e–639e. [DOI] [PubMed] [Google Scholar]
- 25.Swanson E. Prospective controlled study of buttock fat transfer using ultrasound and photographic measurements. Plast Reconstr Surg Glob Open. 2016;4:e697. [DOI] [PMC free article] [PubMed] [Google Scholar]
- 26.Swanson E. Prospective study of doppler ultrasound surveillance for deep venous thromboses in 1000 plastic surgery outpatients. Plast Reconstr Surg. 2020;145:85–96. [DOI] [PubMed] [Google Scholar]
- 27.Swanson E. The effect of sequential compression devices on fibrinolysis in plastic surgery outpatients: a randomized trial. Plast Reconstr Surg. 2020;145:392–401. [DOI] [PubMed] [Google Scholar]
- 28.Furnas DW. The retaining ligaments of the cheek. Plast Reconstr Surg. 1989;83:11–16. [DOI] [PubMed] [Google Scholar]
- 29.Stuzin JM, Baker TJ, Gordon HL. The relationship of the superficial and deep facial fascias: relevance to rhytidectomy and aging. Plast Reconstr Surg. 1992;89:441–9; discussion 450. [PubMed] [Google Scholar]
- 30.Muzaffar AR, Mendelson BC, Adams WP., Jr. Surgical anatomy of the ligamentous attachments of the lower lid and lateral canthus. Plast Reconstr Surg. 2002;110:873–84; discussion 897. [DOI] [PubMed] [Google Scholar]
- 31.Feldman JJ. Corset platysmaplasty. Plast Reconstr Surg. 1990;85:333–343. [DOI] [PubMed] [Google Scholar]
- 32.Loeb R. Fat pad sliding and fat grafting for leveling lid depressions. Clin Plast Surg. 1981;8:757–776. [PubMed] [Google Scholar]
- 33.Flowers RF. Tear trough implants for correction of tear trough deformity. Clin Plast Surg. 1993;20:403–415. [PubMed] [Google Scholar]
- 34.DiBernardo BE, Adams RL, Krause J, et al. Photographic standards in plastic surgery. Plast Reconstr Surg. 1998;102:559–568. [DOI] [PubMed] [Google Scholar]
- 35.Faul F, Erdfelder E, Lang AG, et al. G*Power 3: a flexible statistical power analysis program for the social, behavioral, and biomedical sciences. Behav Res Methods. 2007;39:175–191. [DOI] [PubMed] [Google Scholar]
- 36.Cohen J. Analysis of variance. In: Statistical Power Analysis for the Behavioral Sciences. 1988:2nd ed. Hillsdale, NJ: Lawrence Erlbaum; 273–406. [Google Scholar]
- 37.Molina-Burbano F, Smith JM, Ingargiola J, et al. Fat grafting to improve results of facelift: systematic review of safety and effectiveness of current treatment paradigms. Aesthet Surg J. 2020:sjaa002. [DOI] [PubMed] [Google Scholar]
- 38.Rawlani R, Qureshi H, Rawlani V, et al. Volumetric changes of the mid and lower face with animation and the standardization of three-dimensional facial imaging. Plast Reconstr Surg. 2019;143:76–85. [DOI] [PubMed] [Google Scholar]
- 39.Hirmand H. Anatomy and nonsurgical correction of the tear trough deformity. Plast Reconstr Surg. 2010;125:699–708. [DOI] [PubMed] [Google Scholar]
- 40.Rohrich RJ, Pessa JE. The fat compartments of the face: anatomy and clinical implications for cosmetic surgery. Plast Reconstr Surg. 2007;119:2219–2227; discussion 2228–2231. [DOI] [PubMed] [Google Scholar]
- 41.Schenck TL, Koban KC, Schlattau A, et al. The functional anatomy of the superficial fat compartments of the face: a detailed imaging study. Plast Reconstr Surg. 2018;141:1351–1359. [DOI] [PubMed] [Google Scholar]
- 42.Cotofana S, Koban KC, Konstantin F, et al. The surface-volume coefficient of the superficial and deep facial fat compartments: a cadaveric three-dimensional volumetric analysis. Plast Reconstr Surg. 2019;143:1605–1613. [DOI] [PubMed] [Google Scholar]
- 43.Schreiber JE, Stern CS, Jelks EB, et al. Three-dimensional topographic surface changes in response to volumization of the lateral suborbicularis oculi fat compartment. Plast Reconstr Surg. 2020;145:653–659. [DOI] [PubMed] [Google Scholar]
- 44.Owsley JQ. Lifting the malar fat pad for correction of prominent nasolabial folds. Plast Reconstr Surg. 1993;91:463–474; discussion 475. [PubMed] [Google Scholar]
- 45.Rohrich RJ, Arbique GM, Wong C, et al. The anatomy of suborbicularis fat: implications for periorbital rejuvenation. Plast Reconstr Surg. 2009;124:946–951. [DOI] [PubMed] [Google Scholar]
- 46.Carpaneda CA, Ribeiro MT. Study of the histologic alterations and viability of the adipose graft in humans. Aesthetic Plast Surg. 1993;17:43–47. [DOI] [PubMed] [Google Scholar]
- 47.Carpaneda CA, Ribeiro MT. Percentage of graft viability versus injected volume in adipose autotransplants. Aesthetic Plast Surg. 1994;18:17–19. [DOI] [PubMed] [Google Scholar]
- 48.Coleman SR. Structural Fat Grafting. 2004:St. Louis: Quality Medical Publishing; 59. [Google Scholar]
- 49.Yousif NJ, Mendelson BC. Anatomy of the midface. Clin Plast Surg. 1995;22:227–240. [PubMed] [Google Scholar]
- 50.Lambros V. Observations on periorbital and midface aging. Plast Reconstr Surg. 2007;120:1367–1376; discussion 1377. [DOI] [PubMed] [Google Scholar]
- 51.Lambros V. Facial aging: a 54-year, three-dimensional population study. Plast Reconstr Surg. 2020;145:921–928. [DOI] [PubMed] [Google Scholar]
- 52.Yousif NJ, Matloub M D And H, Summers AN. The midface sling: a new technique to rejuvenate the midface. Plast Reconstr Surg. 2002;110:1541–53; discussion 1554. [DOI] [PubMed] [Google Scholar]
- 53.Lee JH, Kirkham JC, McCormack MC, et al. The effect of pressure and shear on autologous fat grafting. Plast Reconstr Surg. 2013;131:1125–1136. [DOI] [PubMed] [Google Scholar]
- 54.Eto H, Kato H, Suga H, et al. The fate of adipocytes after nonvascularized fat grafting: evidence of early death and replacement of adipocytes. Plast Reconstr Surg. 2012;129:1081–1092. [DOI] [PubMed] [Google Scholar]
- 55.Pu LL. Mechanisms of fat graft survival. Ann Plast Surg. 2016;77(Suppl 1):S84–S86. [DOI] [PubMed] [Google Scholar]
- 56.Peer LA. Loss of weight and volume in human fat grafts with postulation of a “Cell Survival Theory”. Plast Reconstr Surg. 1950;5:217–230. [Google Scholar]
- 57.Suga H, Eto H, Aoi N, et al. Adipose tissue remodeling under ischemia: death of adipocytes and activation of stem/progenitor cells. Plast Reconstr Surg. 2010;126:1911–1923. [DOI] [PubMed] [Google Scholar]
- 58.Yoshimura K, Eto H, Kato H, et al. In vivo manipulation of stem cells for adipose tissue repair/reconstruction. Regen Med. 2011;6(6 Suppl):33–41. [DOI] [PubMed] [Google Scholar]
- 59.Smith P, Adams WP, Jr, Lipschitz AH, et al. Autologous human fat grafting: effect of harvesting and preparation techniques on adipocyte graft survival. Plast Reconstr Surg. 2006;117:1836–1844. [DOI] [PubMed] [Google Scholar]
- 60.Rohrich RJ, Sorokin ES, Brown SA. In search of improved fat transfer viability: a quantitative analysis of the role of centrifugation and harvest site. Plast Reconstr Surg. 2004;113:391–5; discussion 396. [DOI] [PubMed] [Google Scholar]
- 61.Strong AL, Cederna PS, Rubin JP, et al. The current state of fat grafting: a review of harvesting, processing, and injection techniques. Plast Reconstr Surg. 2015;136:897–912. [DOI] [PMC free article] [PubMed] [Google Scholar]
- 62.Shim YH, Zhang RH. Literature review to optimize the autologous fat transplantation procedure and recent technologies to improve graft viability and overall outcome: a systematic and retrospective analytic approach. Aesthetic Plast Surg. 2017;41:815–831. [DOI] [PubMed] [Google Scholar]
- 63.Gir P, Brown SA, Oni G, et al. Fat grafting: evidence-based review on autologous fat harvesting, processing, reinjection, and storage. Plast Reconstr Surg. 2012;130:249–258. [DOI] [PubMed] [Google Scholar]