

Abstract
High plasma lactate is emerging as a critical regulator in development and progression of many human malignancies. Small RNAs derived from cleavage of mature tRNAs have been implicated in many cellular stresses, but the detailed mechanisms that respond to lactic acid (LA; acidic lactate) are not well defined. Here, using an Epstein-Barr virus (EBV)-immortalized B lymphoblastic cell line (LCL) as a model, we report that LA induces cleavage of mature tRNA at the anticodon loop, particularly production of three 5′-tRNA halves (5′-HisGUG, 5′-ValAAC, and 5′-GlyGCC), along with increased expression of RNA polymerase III and angiogenin (ANG). Of these, only the 5′-HisGUG half binds to the chromatin regulator argonaute-2 (AGO2) instead of the AGO1 protein for stability. Notably, the levels of ANG and 5′-HisGUG half expression in peripheral blood mononuclear cells from B cell lymphoma patients are tightly correlated with lactate dehydrogenase (LDH; a lactate indicator) in plasma. Silencing production of the 5′-HisGUG half by small interfering RNA or inhibition of ANG significantly reduces colony formation and growth of LA-induced tumor cells in vitro and in vivo using a murine xenograft model. Overall, our findings identify a novel molecular therapeutic target for the diagnosis and treatment of B cell lymphoma.
Keywords: lactate, tRNA half, cell proliferation, B-lymphoma
Graphical Abstract
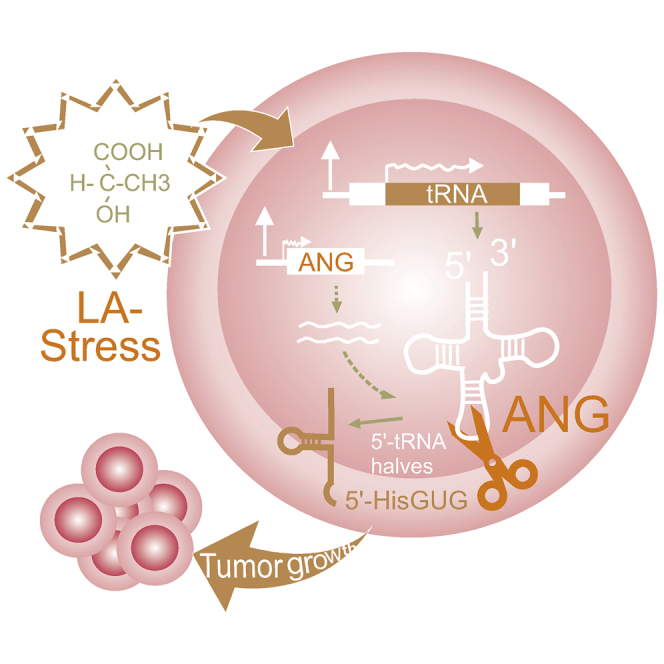
Small RNAs have been implicated in regulation of many cellular stresses and cancer malignancies. Mo et al. report that cleavage of mature tRNA at the anticodon loop is induced to promote growth of B cell lymphoma cells in response to acidic lactate stress.
Introduction
Transfer RNA (tRNA) is the first characterized noncoding RNA (ncRNA) and is well known as an adaptor molecule and its role in decoding messenger RNA (mRNA) for protein synthesis, in which amino acids are brought to the ribosome and transferred to nascent polypeptides. Mature tRNAs are 70- to 90-nucleotide (nt) RNA molecules with a cloverleaf secondary structure, which further folds into an L-shaped tertiary structure. At least 500 tRNA genes have been identified in the human genome so far.1 To produce mature tRNAs, eukaryotic tRNA genes must be transcribed by RNA polymerase III (RNA Pol III) into precursor tRNAs (pre-tRNAs) and extensively processed by removal of the 5′-leader and 3′-trailer sequences and intron splicing from precursor transcripts2. Most eukaryotic tRNA maturation also requires 3′ end addition of 3 nt (CCA) and extensive base modification, which is usually completed in the nucleus. Properly processed tRNA can be aminoacylated for nuclear export,3 whereas unmodified or misfolded tRNAs are polyadenylated for nuclear exosome-mediated degradation.4,5 Thus, quality control machinery is important for destroying improperly processed tRNA transcripts that might otherwise interfere with optimal cellular function. Given that tRNA serves as a second messenger of mRNA in gene expression by acting as a critical signaling molecule, recycling of nucleotides and amino acids, along with the key role of general repression of transcription and translation, is often coupled to selective synthesis of nucleic acids and proteins required for cell survival in response to cellular stress.6 Alteration of tRNA abundance and heterogeneity has also been implicated in many diseases.7
Although tRNAs are best known as adaptor molecules essential for protein translation in many organisms, increasing evidence shows that they can also serve as a source of small functional RNAs in many biological processes beyond translation.8 Among these, tRNA-derived small RNAs (tsRNA) can be divided into two groups: tRNA-derived fragments (tRFs) and tRNA halves.9 tRFs range from 13–24 nt in length and are often called 5′ tRF or 3′ tRF, which are individually derived from 5′ or 3′ parts of mature tRNAs or 5′ leader or 3′ trailer sequences of pre-tRNAs. tRNA halves are 30- to 50-nt fragments that are derived from the 5′ or 3′ part of mature tRNAs with cleavage at the anticodon loop to yield 5′ tRNA (30–35 nt) and 3′ tRNA (40–50 nt) fragments, respectively. Production of tRNA halves is often triggered by stress stimuli such as amino acid deficiency, heat shock, oxidative stress, and viral infection.10 Therefore, they are also known as 5′ or 3′ tiRNAs (tRNA-derived stress-induced RNAs). Under normal conditions, tiRNA is rarely produced in cells. Upon stimulation from stress, mature tRNA is cleaved in the cytoplasm. In yeast cells, tRNA halves are generated by the RNA endonuclease Rny1p.11 In mammalian cells, tRNA halves are mainly produced by angiogenin (ANG)-mediated cleavage.12 Distinct from tRNA halves, tRFs are considered by-products of tRNA during maturation (or generated by unknown enzymatic cleavage following maturation) and are closely related to various types of tumors.13 However, little is known about whether tRNA halves, likely through production of stress stimuli, are crucially involved in development of cancers.
Metabolic reprogramming is a hallmark of cancer. As a major source of cellular energy and cell mass, metabolic synergy or metabolic coupling between glycolytic stromal cells (the Warburg effect) and oxidative cancer cells commonly occurs in human lymphoma and promotes tumor growth.14 The Warburg effect, or aerobic glycolysis, not only refers to catabolism of glucose to lactate to produce adenosine triphosphate (ATP) but also to the increase in lactic acid (LA; acidic lactate) production, which provides a material basis for tumor cells to induce formation of an acidic microenvironment. The change of this metabolic mode is assumed to be an important factor driving malignant development of cancer. Previous studies have shown that modulation of glucose metabolism through glycolysis-targeting drugs in animal lymphoma models could have promising effects with respect to decreasing tumor volume, increasing survival, and promoting chemotherapy sensitization.15 However, the molecular mechanisms related to LA in malignant development of lymphoma remain largely unclear.
Epstein-Barr virus (EBV), the first tumor virus identified in humans, is closely associated with many human cancers, including Burkitt’s lymphoma, Hodgkin’s disease, post-transplant lymphoma, diffuse large B cell lymphoma (DLBCL), and nasopharyngeal carcinoma (NPC) by infecting B and T lymphocytic or epithelial cells.16 In these host cancer cells, the status of EBV infection is complicated and usually classified into three types of latency (I, II, and III) according to the expression of viral latent genes.17 For B lymphocytic cells, EBV infects cells by binding to CD21 (the EBV receptor on the surface of B cells) and induces transformation of an immortalized B lymphoblastoid cell line (LCL). The LCL is an important model for studying the viral oncogenic mechanisms mediated by EBV infection. Emerging evidence has shown that EBV can tamper with the mechanisms of energy metabolism of host cells and promote host cells to utilize glucose through glycolysis. For example, EBV latent membrane protein 1 (LMP1), one of the main latent proteins that is highly expressed in EBV type III-infected cells, can activate poly-ADP ribose polymerase 1 (PARP1) and promote HIF1α-dependent gene expression in B lymphocytes, which leads to changes in host cell metabolism and glycolysis metabolism.18 Cell glucose uptake can be achieved by LMP1-mediated localization of the glucose transporter (GLUT) on the cell membrane to enhance the absorption and utilization of glucose.19 We have also shown previously that the EBV-immortalized LCL can produce large amounts of LA in the extracellular environment and promote cell malignancy.20 In view of the fact that survival of mammalian cells exposed to adverse environmental conditions requires reprogramming of protein translation, LA may impair regulation of cellular mRNA translation. However, until now, to our knowledge, no direct protein translation-related tRNA target of LA has been identified. How LA stress selectively induces translational arrest of mRNA and how cell survival and growth are promoted in response to an acidic microenvironment is not clear.
Here we set out to uncover the mechanistic basis for protein translation-associated tRNA regulation under LA stress by deep sequencing of small RNA using a B cell lymphoma LCL as a model. To our surprise, we found that LA can dramatically induce cleavage of tRNAHis, tRNAVal, and tRNAGly at the anticodon loop (5′ halves). Further investigation reveals that the LA-induced 5′-HisGUG half is dependent on the expression of ANG and that the levels of ANG and 5′-HisGUG half expression in peripheral blood mononuclear cells from B cell lymphoma patients are tightly correlated with lactate dehydrogenase (LDH; a lactate indicator) in plasma. Interference with the 5′-HisGUG half or ANG significantly reduces LA-induced cell proliferation and tumor growth in vitro and in vivo. Taken together, our data identify a potential diagnostic and therapeutic target to control development of B lymphoma by interfering with tsRNA production.
Results
LA Induces RNA Cleavage in B Cell Lymphoma Cells
To understand how LA impairs regulation of cellular mRNA translation, total RNA from different EBV-infected (LCL) and uninfected (Ramos) B cell lymphoma cell lines treated with 10 mM LA or left untreated were extracted individually and subjected to RNA electrophoresis analysis by agarose gel. Unexpectedly, the results showed that, in addition to the two main RNA bands of 28S and 18S, there were smaller migrating bands (∼100 bp) that obviously appeared upon LA treatment in EBV-infected and uninfected cells, although the intensity of the smaller bands in EBV-infected cells was much higher than that of uninfected cells (Figure 1A, left panel, compare lanes 2 and 4 with lanes 1 and 3). To verify this phenomenon, the RNA samples were also subjected to higher resolution analysis by Agilent 2200. Consistent with the observation, similar results were obtained with EBV-infected and uninfected cells, with a much clearer band shift of 28S and 18S RNA and appearance of smaller (∼25–100 bp) RNA bands upon LA treatment (Figure 1A, right panel, compare lanes 2 and 4 with lanes 1 and 3). This indicates that LA may induce cellular RNA degradation in B cell lymphoma cells, particularly in EBV-infected B cells. To further reveal the potential mechanisms of LA-mediated RNA regulation, RNA samples from EBV-infected LCL cells with or without LA treatment were subjected to deep sequencing of cellular mRNA and small RNA, respectively (Figure 1B). To our surprise, the results from small RNA sequencing showed that the profiles of different types of small RNAs were greatly changed upon LA treatment (Figure 1C). Among these, the percentage of tRFs was increased most significantly (4.8% versus 21.2%) by LA stimulation.
Figure 1.

Profiles of RNA Transcripts in B Cell Lymphoma Cells Induced by LA
(A) RNA profiles of EBV-infected (LCL) and uninfected (Ramos) B lymphoblastic cells left untreated (mock) or treated with lactic acid (LA; 10 mM, 48 h). RNA electrophoresis was analyzed by agarose gel (left panels) or Agilent 2200 TapeStation (right panels). (B) RNA quantitation of EBV-infected B lymphoblastic cells with Agilent 2200 TapeStation analysis from A. RNA samples were individually subjected to mRNA or sRNA deep sequencing as indicated. (C) Relative abundance of different types of human genome-derived small non-coded RNAs (sncRNAs) from B. The significant difference of each sRNA enrichment (p value) is shown by the solid line.
LA Induces ANG-Dependent Cleavage of tRNA at the Anticodon Loop
Given that many tRNA-derived small ncRNAs (sncRNA), including tRF fragments and tRNA halves, have been identified previously,8, 9, 10 we analyzed the profiles of tRNA-derived sncRNAs in B cells with or without LA treatment (Figure 2A). Intriguingly, the results showed that the ratio of 5′ tRNA halves was enhanced dramatically (33-fold from 1.67% to 55.06%) by LA, whereas that of 3′ tRFs was reduced 17.3-fold (from 52.26% to 3.02%) and that of 5′ tRFs increased 2.4-fold (from 5.51% to 13.14%) (Figure 2A). These results were further confirmed by the observation of a much higher intensity of tRFs of 30- to 35-nt size in the LA-treated groups compared with the mock group (Figure 2B, left panel), and more enrichment of 5′ tRNA than 3′ tRNA in the LA-treated group (tRNAGlyCCC, for example) (Figure 2B, right panel). Further analysis revealed that LA dramatically enhances the ratio of 5′ tRNAHis, 5′ tRNAVal, and 5′ tRNAGly halves while reducing that of tRNALys and tRNAGlu (Figure 2C). Notably, none of these tRNA fragments contain 5′ leader or 3′ trailer sequences of pre-tRNA or intervening sequences, which suggests that these tRNA fragments are generated from fully mature tRNAs rather than from nascent tRNA transcripts and could be directly derived from cleavage within the anticodon loop by a specific endonuclease.
Figure 2.

LA Highly Induces Cleavage of tRNA at the Anticodon Loop
(A) Profiles of different types of tRNA-derived sncRNAs in EBV-infected B lymphoblastic cells with or without LA treatment. The relative abundance of each tRNA-derived sncRNA was quantified according to the deep sequencing data from Figure 1B. Right panel: schematic of different types of tRFs produced from mature tRNA. (B) Relative abundance of read length distribution of different tRFs after LA treatment. Sequence alignment of 5′/3′ tRNA fragments of Gly-CCC with their parental mature tRNAs is shown on the right. The anticodon is highlighted in red. (C) Relative abundance of each tRNA in the EBV-infected LCL cells with or without LA treatment. The types of tRNAs that are significantly increased and reduced by LA are highlighted in red and green boxes, respectively. The significant difference of each tRNA enrichment (p value) is shown by the solid line.
ANG is a key nuclease that cleaves tRNA at the anticodon loop to produce tRNA halves.12 To further confirm whether 5′ tRNA halves (particularly tRNAHis, tRNAVal, and tRNAGly) are dominant products of ANG-mediated cleavage upon LA treatment, we first analyzed the transcriptional pattern of cellular genes related to tRNA synthesis and modification by mRNA deep sequencing from LCL cells with or without LA treatment. As shown in Figure 3A, the expression levels of RNA Pol III (POLR3D) and ANG instead of RNH1 (a ribonuclease inhibitor) were indeed significantly increased by LA, which was further confirmed by the results of immunoblotting assays with antibodies against RNA Pol III and ANG (Figure 3B). To validate whether LA specifically induces production of 5′ halves of tRNAHis, tRNAVal, and tRNAGly, total RNA from different LCL cell lines with or without LA treatment was subjected to northern hybridization with a 32P-labeled probe targeting 5′-HisGUG, 5′-GlyGCC, and 5′-ValAAC, respectively. A band of ∼35-nt 5′ halves derived from tRNAHisGUG, tRNAGlyGCC, and tRNAValAAC was readily detected after LA stimulation, together with a band at 80 nt corresponding to mature tRNA (Figure 3C). To determine whether ANG is required for LA-induced production of 5′ halves, we constitutively knocked down ANG expression by using a short hairpin RNA (shRNA) specifically against ANG, followed by northern blotting analysis with 5′-HisGUG or 5S rRNA as a control. The results revealed that inhibition of ANG significantly reduced production of the 5′-HisGUG half, but there was no change in the level of 5S rRNA transcripts (Figure 3D), which supports the notion that LA-induced cleavage of tRNA at the anticodon loop relies on ANG expression.
Figure 3.

LA Enhances the Expression of RNA Pol III and ANG-Mediated 5′ tRNA Half Cleavage
(A) Hierarchical cluster of expression profiles of genes related to tRNA synthesis and degradation in response to LA. The relative abundance of each gene was quantified according to the mRNA deep sequencing data from Figure 1B. Analysis of mRNA deep sequencing in EBV-infected LCL cells revealed that expression of tRNA-related genes, including ANG, DICER1-AS1, and POLR3D, is increased by more than 2-fold in the presence of LA. A schematic representation of molecules related to tRNA synthesis and the cleaved fragment is shown in the bottom panel. (B) Expression of ANG and RNA Pol III (POLR3D) is elevated in EBV-infected LCL cells in response to LA. Whole-cell lysates from EBV-infected and uninfected B cells with or without LA treatment (10 mM, 24 h) were subjected to immunoblot (IB) assays as indicated. GAPDH was used as an internal control. Relative densities (RDs) of RNA Pol III (POLR3D) and ANG are quantified and shown in the bottom panel. (C) LA induces 5′ tiRNA half cleavage in EBV-infected LCL cells. Total RNA from the indicated cells with or without LA treatment (10 mM, 24 h) was subjected to northern blot using a 5′ probe targeting human cytoplasmic tRNAHis-GUG, tRNAVal-AAC, or tRNAGly-GCC. Detected mature tRNAs and 5′ tRNA halves are indicated by arrows, and the relative quantitation from three repeats is shown at the bottom panel. (D) Knockdown of ANG blocks LA-mediated cleavage of the 5′-HisGUG half. LCL cells were transfected with shRNA targeting ANG (shANG) or a Luc control (shCtrl), followed by treatment with or without LA (10 mM, 24 h) as indicated. The knockdown efficiency of ANG was evaluated by IB assays as indicated. GAPDH was used as a control. Total RNA was extracted and subjected to northern blot using a 5′ probe targeting human cytoplasmic tRNAHis-GUG. 5S RNA was used as a control. Northern blot bands of mature tRNAs and 5′ tRNA halves are indicated by arrows, were quantified from three repeats, and are shown as relative abundance in the bottom panel.
The LA-Induced 5′-HisGUG Half Selectively Binds to AGO2 for Stability and Global Translational Repression
It has been reported that many of the miRNA fragments that are bound to Argonaute (AGO, the microRNA effector protein) prevent RNA degradation and repress translation.21, 22, 23, 24 To determine how the abundance of the 5′-HisGUG half escapes degradation, we first looked at the expression pattern of different Ago genes in EBV-infected LCL and uninfected Ramos cells with or without LA treatment. The results showed that only AGO2, but not AGO1, AGO3, or AGO4, was consistently and significantly enhanced upon LA treatment in EBV-infected and uninfected cells (Figure 4A). Intriguingly, upon LA stimulation, the 5′-HisGUG half was selectively associated with AGO2 instead of AGO1, whereas the 5′-ValAAC and 5′-GlyGCC halves did not bind to AGO2 or AGO1 (Figure 4B). To further elucidate the role of the 5′-HisGUG half bound to AGO2, we sought to examine the extent to which the LA-induced 5′ tRNA halves may bind with AGO2 by acting as microRNAs (miRNAs) at their endogenous levels. We employed luciferase reporter assays to establish the level of expression required for the 5′ tRNA half fragments to be detectably functional. We constructed luciferase reporter genes with single perfect complementarity to the 5′-HisGUG half and measured the luciferase activity produced after their transient transfection with different dosages of the 5′-HisGUG or 5′-ValAAC halves into 293 cells in the presence or absence of LA treatment. The results showed that, at their endogenous levels of expression, no repression of reporter activity was detectable in the presence of the 5′-HisGUG or 5′-ValAAC halves (Figure 4C), indicating that the LA-mediated 5′-HisGUG half does not generally serve a miRNA-like function in cells because they displayed no discernable suppressive activity. This prompted us to test their capacity to stabilize the 5′-HisGUG half in an AGO2-dependent manner. To assess the effect of AGO2 on the stability of the 5′-HisGUG half, we again constitutively knocked down AGO2 in LCL cells and tested the levels of the 5′-HisGUG or 5′-ValAAC half by northern blot assays. Consistent with our speculation, we found that inhibition of AGO2 led to a dramatic reduction in production of the 5′-HisGUG instead of the 5′-ValAAC half upon LA stimulation (Figure 4D). Introduction of the 5′-HisGUG half, but not the 5′-ValAAC half, efficiently increased expression of AGO2 instead of AGO1 in a dose-dependent manner (Figure 4E), and inhibition of the 5′-HisGUG half, but not the 5′-ValAAC half, by siRNA resulted in decreased expression of AGO2 but not AGO1 when induced with LA (Figure 4F), further indicating that 5′-HisGUG bound with AGO2 is required to ensure stability of AGO2 and the 5′-HisGUG half.
Figure 4.

AGO2 Is Associated with the 5′-HisGUG Half under LA Stress
(A) Transcriptional levels of the AGO gene family in LCL and Ramos cells with or without LA treatment (10 mM, 24 h). The data are from the mRNA sequencing (mRNA-seq) analysis in Figure 1B. Significance of enhancement of AGO2 transcripts upon LA treatment is highlighted in red. (B) AGO2, but not AGO1, binds with the 5′-HisGUG half under LA stress. Northern blot analysis of LA-induced 5′ tRNA halves immunoprecipitated (IP) with AGO2 or AGO1 antibodies in LCL cells is shown. Protein levels of AGO1 and AGO2 were determined by IB assays. (C) Luc reporter assays show no inhibitory effect of LA-induced 5′ tRNAHis halves on gene transcription in cis. HEK293 cells were transfected with the Luc-5′-tRNAHis anti-sense reporter with different dosages of 5′-HisGUG or 5′-ValAAC half, followed by treatment with or without 10 mM LA for 24 h before harvesting as indicated. 48 h post-transfection, Luc activity was determined in triplicate. Error bars depict standard error of the mean. The Luc reporter with 5′-tRNAHis anti-sense co-transfection with LANA-myc was used as a positive control. (D) Knockdown of AGO2 inhibits production of the 5′-HisGUG half. Total RNA from LCL cells with control shRNA or shRNA targeting AGO2 was subjected to northern blot analysis using a 5′ probe targeting human cytoplasmic 5′-HisGUG or 5′-ValAAC. Parental LCL cells were used as a control. Levels of AGO2 and GAPDH expression were determined by IB assays. (E) The 5′-HisGUG half enhances expression of AGO2. LCL cells were transfected with different dosages of the 5′-HisGUG or 5′-ValAAC half. 48 h post-transfection, whole-cell lysates were subjected to IB assays as indicated. GAPDH was used as a control. (F) Inhibition of the 5′-HisGUG half reduces LA-induced AGO2 expression. LCL cells were transfected with siRNA targeting 5′-HisGUG, 5′-ValAAC, or the scramble control, followed by treatment with or without 10 mM LA for 24 h before harvest. 48 h post-transfection, whole-cell lysates were subjected to IB analysis as indicated. Right panel: the levels of 5′-HisGUG and 5′-ValAAC halves at 24 h post-transfection of siRNA were quantified by northern blotting.
To further confirm the role of the LA-mediated 5′-HisGUG half on the protein stability of AGO2, we compared the protein levels of AGO2 in the presence or absence of treatment with LA or the 5′-HisGUG half in LCL cells exposed to cycloheximide for different times (Figure 5A), and the results showed that the protein stability of AGO2 is clearly enhanced upon LA or 5′-HisGUG half treatment. Interestingly, the results of immunoblotting puromycin-labeled LCL cells showed that LA induces global translational repression, whereas introduction of siRNA of 5′-HisGUG instead of a control efficiently blocks the inhibitory effect (Figure 5B). This indicates that the LA-mediated 5′-HisGUG half represses protein synthesis. miR-20a has been well demonstrated to complex with AGO225 and inhibit expression of several its downstream target genes (including MAP3K7, SFMBT1, RUNX3, and ATG7), related to cell survival and proliferation in previous literature.26, 27, 28, 29 We attempted to measure the binding affinity of miR-20a with AGO2 and the transcriptional levels of its downstream target genes in the presence or absence of LA treatment by performing RNA immunoprecipitation and quantitative PCR assays. The results showed that LA reduces the binding affinity of miR-20a with AGO2 and, in turn, dramatically increases the transcription levels of SFMBT1 and MAP3K7 instead of RUNX3 or ATG7 (Survivin was used as a non-target gene control), but the binding affinity of AGO2 with mRNA of RUNX3 or ATG7 was greatly reduced (Figures 5C and 5D). Moreover, knockdown of the 5′-HisGUG half dramatically reduces the LA-induced expression of MAP3K7 and SFMBT1 (Figure 5E). These results indicate that accumulation of the 5′-HisGUG half and AGO2 may selectively regulate gene expression for cell survival and proliferation under LA stress.
Figure 5.

LA Enhances AGO2 Protein Stability but Reduces Its Ability to Bind with miR-20a and Global Translation
(A) LA and the exogenous 5′-HisGUG half enhance AGO2 protein stability. LCL cells treated with or without 10 mM LA for 24 h (top panel) or transfected with or without 5′-HisGUG half at 48 h post-transfection (bottom panel), followed by 200 μg/mL cycloheximide (CHX) for the indicated time before harvest, were individually subjected to IB analysis with the indicated antibodies. The RD of AGO2 is shown. (B) LA reduces global protein translation. LCL cells were treated with 10 mM LA for 0, 24, or 48 h (left panel) or transfected with siRNA of 5′-HisGUG or the control, followed by LA treatment for 24 h at 24 h post-transfection. Cells were pulsed with 1 μM puromycin (puro) for 1 h before harvest and lysis for IB analysis. (C) LA reduces the ability of AGO2 to bind to miR-20a. LCL cells treated with 10 mM LA for 24 h were subjected to quantitative PCR analysis of miR-20a (input) or RNA IP (RIP) with AGO2 antibodies followed by quantitative PCR analysis of miR-20a. ∗∗p < 0.01. (D) LA dramatically enhances transcription of SFMBT1 and MAP3K7. Total RNA from LCL cells treated as indicated in (C) were subjected to quantitative PCR analysis of mRNA transcripts of the indicated gene (input) or RIP with AGO2 antibodies followed by quantitative PCR analysis. ∗∗p < 0.01. (E) 5′-HisGUG half knockdown reduces LA-induced expression of MAP3K7 and SFMBT1. LCL cells transfected with siRNA of different dosages of 5′-HisGUG or a control, followed by LA treatment for 24 h at 24 h post-transfection, were subjected to quantitative PCR analysis of SFMBT1 and MAP3K7. Parental LCL cells with or without LA treatment were used a control.
Abundant Expression of the 5′-HisGUG Half and ANG in B Cell Lymphoma Cells with High Levels of LA
Because knockdown of ANG led to dramatically reduced production of the 5′-HisGUG half in LCL cells under LA stress (Figure 3D), we reasoned that expression of ANG and 5′-HisGUG half production correlate with levels of LA in B cell lymphoma patients. To perform wide screening of B cell lymphoma patient clinical samples for expression of the 5′-HisGUG half, we developed a convenient and accurate method that was able to exclusively quantify the 5′-HisGUG half (to distinguish signals of 5′ tRNA halves from mature and pre-tRNAs) by quantitative reverse-transcriptase polymerase chain reaction (qRT-PCR), as described previously with slight modifications.7 Total RNA was first treated with T4 polynucleotide kinase (PNK) and ATP to dephosphorylate the 3′ end of the 5′ tRNA half. Subsequently, a 3′ RNA adaptor was ligated to the 5′ tRNA half, followed by quantification of the ligation products by SYBR Green qPCR (Figure 6A, bottom panel). The specificity of this qRT-PCR method was simultaneously verified by quantification of the 5′-HisGUG half in LCL cells treated with LA for different times by using northern blotting. The results showed that the quantitation trend by PCR was consistent with the northern blot (Figure 6A). To further confirm this, the levels of the 5′-HisGUG half in the LCL and B95.8 cell lines with different dosages of LA treatment were also quantified by this PCR method, along with quantitation of ANG expression by regular PCR. The results showed that, consistent with increased expression of ANG, the abundance of the 5′-HisGUG half was apparently greater in LA-treated cells than in untreated cells, although there appeared to be a gradual reduction after reaching a peak, with higher levels of LA treatment in both B cell lines (Figure 6B). With this method, the expression of ANG and the 5′-HisGUG half in peripheral blood mononuclear cells of 28 B cell lymphoma patients was profiled (Figure 6C). According to the level of LDH (a lactate indicator) and EBV loading in plasma, the 28 specimens were divided into three groups: EBV−, LDH− (EBV negative, LDH normal); EBV−, LDH+ (EBV negative, LDH high); and EBV+, LDH+ (EBV positive, LDH high). Strikingly, consistent with our observation of EBV-infected and uninfected B cell lines, the results showed that, regardless of the presence or absence of EBV infection, increased levels of the 5′-HisGUG half and ANG expression were significantly correlated with high levels of LDH in B cell lymphoma patients, and the levels of the 5′-HisGUG half and ANG expression in response to LA were much more apparent (∼3-fold and 15-fold increases, respectively) in the EBV-positive group than in the EBV-negative group (Figure 6C, right and center panels). This implies that production of the 5′-HisGUG half and ANG expression are specifically associated with LA in B cell lymphoma cells.
Figure 6.

LA Induces ANG Expression and 5′-HisGUG Half Production in B Cell Lymphoma Cells
(A) Total RNA from the indicated LCL cells with 10 mM LA treatment at different time points was subjected to northern blot (top panel) or qRT-PCR (bottom panel) analysis for detection of the 5′-HisGUG half as indicated. A schematic of quantification of the 5′-tRNA half using qRT-PCR with T4 PNK and T4 RNA ligase (T4 Rnl) treatment is shown in the bottom panel. (B) Expression of the 5′-HisGUG half and ANG is enhanced by LA in LCL and B95.8 cells. Cells treated with different dosages of LA for 24 h were subjected to quantitative PCR analysis as indicated. The trend of 5′-HisGUG half and ANG expression in response to different concentrations of LA is shown by a dotted line. (C) Expression of ANG and the 5′-HisGUG half is correlated with the level of LDH (an LA indicator) in peripheral blood mononuclear cells from B cell lymphoma patients with or without EBV infection. EBV−, LDH− (EBV negative, LDH normal); EBV+, LDH+ (EBV positive, LDH high); EBV−, LDH+ (EBV negative, LDH high); ∗∗p < 0.01, ∗p < 0.05.
Inhibition of the 5′-HisGUG Half Reduces LA-Induced B Cell Lymphoma Cell Growth In Vitro and In Vivo
Because LA is correlated with proliferation in LCL cells,20 we hypothesized that the 5′-HisGUG half is not just accumulated non-functionally but required as a functional molecule for driving cell proliferation in LA-dependent B lymphoma. To test this hypothesis, we investigated the effect of the presence and absence of the 5′-HisGUG half on cell proliferation by performing specific siRNA knockdown or ectopic expression of the 5′-HisGUG half. We first transfected different dosages of siRNA targeting the 5′-HisGUG half into LCL1 cells with LA treatment. Using northern blot analysis, we confirmed that siRNA transfection is able to specifically reduce expression of the 5′-HisGUG half induced by LA compared with scramble control siRNA (Figure 7A, bottom panel). Upon 5′-HisGUG reduction, the cell growth rate was decreased significantly in a dose-dependent manner compared with control siRNA (Figure 7A, top panel). Because the levels of mature tRNAHis cells were not changed by siRNA transfection (Figure 7A, bottom panel), inhibition of cell proliferation appeared to be solely attributable to the change in expression of the 5′-HisGUG half. Depletion of the 5′-HisGUG half strongly impaired cell proliferation starting 2 days after siRNA transfection (days 3, 4, and 5). Introduction of the purified endogenous 5′-HisGUG half into LCL cells significantly increased the cell growth rate in a dose-dependent manner (Figure 7B). In addition, the cells were arrested at G1 phase when the 5′-HisGUG half was knocked down by siRNA (Figure 7C), indicating that the 5′-HisGUG half contributes to cell proliferation in B cells under LA stress.
Figure 7.

The 5′-HisGUG Half Enhances LCL Cell Proliferation In Vitro
(A) Knockdown of the 5′-HisGUG half in LCL cells reduces LA-mediated cell proliferation. The number of LCL cells transfected with different dosages of siRNA targeting 5′-HisGUG or the scramble control, followed by treatment with LA, was individually detected every day for 5 days by Hoechst DNA staining. Assays were performed in triplicate, and error bars indicate standard deviation. ∗∗p < 0.01. (B) Introduction of the 5′-HisGUG half enhances LCL cell proliferation. The numbers of LCL cells transfected with different dosages of the 5′-HisGUG half or the scramble control were individually detected every day for 5 days by Hoechst DNA staining. Bottom panel: the quality of the 5′-HisGUG half purified from LCL cells was confirmed by northern blot. (C) Knockdown of 5′-HisGUG induces G1 phase arrest. LCL cells transfected with siRNA targeting 5′-HisGUG or the scramble control were subjected to DNA content analysis. The percentages of subG1, G1, S, and G2/M populations were quantified from triplicate experiments.
To elucidate the physiological function of the 5′-HisGUG half in cell growth, equal amounts of LCL cells with inhibition of the 5′-HisGUG half or ANG expression or a scramble control were treated individually with LA or left untreated and assessed using a colony formation assay. The results of 21-day culture showed a reduction in colony formation in LA-treated cells with knockdown of the 5′-HisGUG half or ANG but not in the control groups (Figure 8A). In the tumor xenograft model of B cell lymphoma cells in vivo, inhibition of the 5′-HisGUG half led to an apparent reduction in LA-induced tumor growth rates (24-fold versus 2.2-fold, p < 0.01) within weeks after injection (Figures 8B–8D). Taken together, these findings support our hypothesis that the LA-dependent 5′-HisGUG half enhances cell proliferation in B cell lymphoma.
Figure 8.

LA-Induced Expression of the 5′-HisGUG Half Contributes to EBV-Infected B Cell Lymphoma Cell Growth In Vitro and In Vivo
(A) The 5′-HisGUG half enhances colony formation of EBV-infected B cell lymphoma cells in soft agar. Equal amounts of LCL cells with inhibition of ANG, the 5′-HisGUG half, or the scramble control in the presence or absence of LA were individually inoculated for soft agar assays and then fixed 21 days later, followed by staining with crystal violet to determine the colony numbers. Bottom panels: relative colony formation was calculated from three independent experiments. (B) Inhibition of the 5′-HisGUG half reduces LCL tumor growth in a xenograft mouse model. Top panel: schematic of NOD/SCID mice engrafted intraperitoneally with 10 million LCL-Luc cells on day 2 (week 0) and treated with PBS or 10 mM LA-Na every other day for 1 week, followed by treatment with siRNA targeting the 5′-HisGUG half or scramble control at week 1 for 1 week as indicated. Bottom panel: the tumor burden of NOD/SCID mice was analyzed by luminescence assay at weeks 0 and 4. (C) Luminescent signals were quantified and expressed as the region of interest (ROI) signal intensity (total radiant efficiency [p/s]/[microwatt per square centimeter]) in (B). (D) Relative levels of the 5′-HisGUG half in tumor cells of xenograft mice at week 4 from (B) were quantified by qRT-PCR analysis. ∗∗p < 0.01, ∗p < 0.05.
Discussion
In eukaryotic cells, tRNA synthesis is a complex and precisely regulated cellular process that plays a critical role in protein translation; tRNAs act as adapters to link mRNA to amino acids. Although earlier studies of tRNAs mainly focused on their structure, maturation, and the correlative function in protein synthesis, emerging evidence supports the existence of highly abundant miRNA-like small noncoding tRNA fragments (sncRNA) derived from tRNA degradation in a variety of cell types that regulate cell proliferation, stress-induced translational suppression, and stress granule assembly.9,30, 31, 32 Among these, tRNA halves have been shown to engage in response to various cellular stresses, such as nutrition deficiency, hypoxia, and hypothermia.10,33,34 In this study, based on our analysis of sncRNAs in EBV-infected LCL cells upon LA treatment, we unexpectedly discovered a previously unidentified response to LA stress: cleavage of mature tRNA at the anticodon loop by enhancing ANG expression and, in turn, abundant production of the 5′-tRNA halves 5′-HisGUG, 5′-VaAAC, and 5′-GlyGCC. Intriguingly, only the 5′-HisGUG half binds to the chromatin regulator AGO2 protein for stability. Accumulated 5′-HisGUG halves competes with miR-20a to release expression of MAP3K7 and SFMBT1 for B-lymphoma cell survival and proliferation under LA stress (Figure 9). More importantly, the levels of ANG and 5′-HisGUG half expression in peripheral blood mononuclear cells from B cell lymphoma patients are tightly correlated with LDH (an LA indicator) in plasma, which provides a novel molecular therapeutic target for diagnosis and treatment of B cell lymphoma. To our knowledge, this is the first evidence demonstrating that cleavage of tRNA halves is in response to LA stress and has critical roles in development and progression of B cell lymphoma.
Figure 9.

Proposed Model of the LA-Dependent 5′-HisGUG Half Enhancing EBV-Infected B Cell Lymphoma Growth
Accumulation of LA secreted from B cell lymphoma cells immortalized by EBV infection results in formation of LA stress.20 LA stress feedback increases expression of RNA Pol III and ANG, which leads to specific production of 5′-tRNA halves, including 5′-HisGUG, 5′-ValAAC, and 5′-GlyGCC. Among these, 5′-HisGUG binds with AGO2 protein to form a stable RNase-resistant structure to release miR-20a binding and, in turn, enhance its downstream targeted gene expression (i.e., MAP3K7 and SFMBT1) for cell survival and proliferation under LA stress.
Although production of tRNA halves has mainly been shown to be linked to cellular stress, the profiles of tRNA halves are varied in response to different stresses. For example, the 5′-ValAAC, 5′-GlyGCC, 5′-MetCAT, and 5′-ArgACG halves are produced in response to nutrition deficiency, heat shock, and hypoxia,34 whereas the 3′-GlyUCC, 3′-AsnGUU, 3′-ThrUGU, 3′-SerAGA, 3′-ArgUCU, and 3′-HisGUG halves are induced during cell starvation.33 In this study, we demonstrate that the abundant 5′-HisGUG, 5′-ValAAC, and 5′-GlyGCC halves are exclusively produced in response to LA stress. Although tRNAHisGUG and tRNAGlyGCC respond to starvation and LA stress, their 5′ and 3′ halves are exclusively accumulated, indicating that the profile of tRNA halves is totally dependent on the type of cellular stress, and even 5′ and 3′ halves derived from the same tRNA may have different functions. However, how and why only a few of the tRNAs are selectively cleaved under stress remains largely unknown.
Although only a small fraction of the total tRNA population appears to be targeted for cleavage under LA stress, it is still likely that tRNA cleavage inhibits translation overall or that tRNA degradation is needed for recycling of ribonucleotides. The observed tRNA cleavage under LA stress could serve as a mechanism to eliminate uncharged and/or 5′/3′-truncated tRNAs that might interfere with translational accuracy or efficiency. Alternatively, production of tRNAs halves under LA stress could limit the function of uncharged tRNAs as signaling molecules and promote selective expression of genes required for adaptation to LA stress. Our observation that levels of 5′-HisGUG half production are increased with a longer time course of LA treatment supports the notion that targeting cleavage of tRNAs halves may promote progression from an initial adjustment phase to an adapted state competent for cell survival under conditions of LA stress.
To define the role of the LA-induced 5′-HisGUG half, we knocked down expression of the endogenous 5′-HisGUG half in LCL cells by introduction of siRNA targeting 5′-HisGUG. Because the 5′-HisGUG half shares identical sequences with mature tRNAHis or pre-tRNAHis, it is possible that siRNAs targeting the 5′-HisGUG half will affect mature and precursor tRNAs, leading to confusing results. However, previous studies have shown successful siRNA knockdown of 3′-trailer-derived tRNA fragments without affecting pre-tRNA levels and mature tRNAs.35,36 Considering these studies and the fact that mature tRNAs are usually aminoacylated to form rigid L-shaped tertiary structures and tightly bind to an elongation factor in the cytoplasm, we assumed that siRNA targeting the 5′-HisGUG half could preferably function toward the 5′-HisGUG half without greatly affecting mature tRNAHis. Indeed, as shown in Figure 4F, siRNA transfection targeting the 5′-HisGUG half did not affect mature tRNA levels but specifically reduced the levels of the targeted 5′-HisGUG half.
Consistent with previous studies showing that expression of ANG is enhanced by hypoxia,37,38 we found that ANG is also upregulated by LA stimulation. This indicates that ANG could be a component of a stress response program. Considering that only mature cytoplasmic tRNAs are targeted by ANG, LA-induced cleavage of 5′ tRNA halves by ANG most likely occurs in the cytoplasm. In addition, an increasing number of studies have demonstrated an evident association of tRNA-derived ncRNAs with AGO proteins,24,39 and some tRFs seem to be generated via a Dicer-independent biogenesis mechanism and potentially function as miRNAs.40 Although the three tRNA halves 5′-HisGUG, 5′-ValAAC, and 5′-GlyGCC are induced upon LA stimulation, only 5′-HisGUG binds to AGO2 to enhance stability instead of functioning as a transcriptional inhibitor, which is a unique instance in the field of non-coding RNA selectively stabilized by AGO2. These diverse roles of tsRNAs bound to AGO suggest that their possible functions are far broader than currently recognized. Inhibition of 5′-HisGUG not only reduces LA-mediated AGO2 expression but also leads to G1 arrest of the cell cycle and severe impairment of cell proliferation in vitro and in vivo, indicating an enhancer role of the association of 5′-HisGUG and AGO2 in cell survival and proliferation and that AGO2 and 5′-HisGUG have a positive feedback relationship. However, important questions remain regarding the mechanism behind this enhancement and why the 5′-HisGUG half appears to have a functional role in cell proliferation; we observed that the decreased association of AGO2 with miR-20a leads to dramatically increased expression of the cell proliferation-related genes SFMBT1 and MAP3K7 under LA stress. In addition, it is noteworthy that we also noticed that the endogenous 5′-HisGUG half purified from LA-induced LCL cells has a much more dramatic effect on cell proliferation and a slightly higher molecular weight than the synthesized one in vitro, suggesting that the 5′-HisGUG half may undergo some modifications, which requires further investigation.
During quantitative analysis of the relationship of the 5′-HisGUG half and ANG expression with the level of LA in LCL and B95.8 cell lines, we found that increased production of the 5′-HisGUG half and ANG is not always consistent with the level of LA in a dose-dependent manner but seems to appear as an increased peak and is then gradually reduced. The peak of the 5′-HisGUG half presents faster than that of ANG, suggesting that the effect of higher levels of LA is more complicated than that of low levels of LA, and this may have more severe effects on cell survival. Similarly, high levels of LA (LDH+) in some B cell lymphoma patient samples did not present abundant levels of 5′-HisGUG or ANG mRNA, implying that high levels of LA can induce expression of 5′-HisGUG or ANG mRNA at an early stage but may also reduce expression at a later stage as a feedback control mode.
We identified a novel response to LA stress in B cell lymphoma cells, whose tRNAs are cleaved at the anticodon loop, which apparently occurs more in EBV-infected than uninfected B cell lymphoma cells. However, it remains to be determined whether the type of tRNA cleavage is broadly conserved in other type of cancer cells in response to LA stress and whether the viral genes are involved in regulation of production of the 5′-HisGUG half and ANG expression. Previous studies showed that CU1276, a microRNA derived from the 3′ end of tRNA suppressing cell proliferation and the DNA damage response, is downregulated in B cell lymphoma.6 Much less abundance of 3′ tRNA halves was observed in LCL cells (Figure 2B), and it remains unknown whether the 3′ tRNA halves undergo degradation to produce a tRNA-derived miRNA similar to CU1276, as described previously.6 In addition, the apparent band down-shift of rRNAs upon LA treatment in EBV-infected and uninfected B lymphoma cells (Figure 1A) suggests the possibility that clear processing rather than a random degradation event gives rise to smaller 28S and 18S rRNA species, which is uncommon and remains to investigated further.
Taken together, our study offers evidence that the 5′-HisGUG half impairs the cell cycle and proliferation of B cells, particularly EBV-infected B cell lymphoma cells, in an LA stress microenvironment and contributes to B cell lymphoma growth, which may be useful for future therapeutic applications during early neoplastic formation of B cell lymphoma.
Materials and Methods
Human Subjects
Peripheral blood mononuclear cells from B cell lymphoma patients (age 30–72) diagnosed as EBV-negative with normal LDH (EBV−, LDH−), EBV-negative with high LDH (EBV−, LDH+), or EBV-positive with high LDH (EBV+, LDH+) were collected from Shanghai First People’s Hospital, Shanghai Jiao Tong University. Use of redundant blood samples for research purposes was approved by the Hospital Medical Ethics Committee. The Institutional Review Board (IRB)-approved protocol 2019-C009, Declaration of Helsinki protocols were followed, and each donor gave written informed consent.
Cell Culture
The EBV-negative B cell lymphoma cell line (Ramos from the American Type Culture Collection [ATCC], Manassas, VA) and EBV-positive cell lines (B95.8 from the ATCC and the EBV-transformed primary B cell lines LCL1 and LCL2, stored in the lab as described previously20) were cultured in RPMI 1640 medium (Invitrogen) supplemented with 10% fetal bovine serum (FBS) (HyClone), 100 U/mL penicillin, and 100 μg/mL streptomycin. All cells were maintained at 37°C with 5% CO2.
RNA Deep Sequencing
RNA deep sequencing was performed and analyzed with RiboBio (Ribobio, Guangzhou, China) following the manufacturer’s instructions. Briefly, mRNAs were isolated, fragmented, reverse transcribed, and amplified before sequencing, as described previously.20 For small RNA (sRNA) sequencing, sRNAs ranging from 18–50 nt were gel purified and ligated to the 3′ adaptor and 5′ adaptor. Ligation products were gel purified, reverse transcribed, amplified, and then sequenced as described previously.20 Raw sequencing reads were obtained using related Illumina analysis software.
RNA Isolation and Northern Blotting
Total RNA was isolated from whole cells using TRIzol reagent (Thermo Fisher Scientific) according to the manufacturer’s instructions. Northern blot analysis was carried out as described previously.41 Briefly, RNA was separated in 15% denaturing polyacrylamide gel with 7 M urea and then transferred to a positively charged nylon membrane (Amersham Biosciences, Piscataway, NJ, USA). The membrane was hybridized with 32P-labeled probes in ULTRAhyb-Oligo solution (Life Technologies, Grand Island, NY, USA), followed by washing according to the manufacturer’s instructions, and hybridized to 5′ end-labeled antisense probes targeting 5′-tRNA-HisGTG, 5′-tRNA-ValAAC, or 5′-tRNA-GlyGCC (for oligonucleotide sequences, see Table S1). Total RNA (20 μg) was separated on 12% SDS-PAGE/8 M urea gels, and the gels were blotted onto positively charged nylon membranes. 5S rRNA was used as an RNA loading control.
Immunoblotting
Cells were harvested and lysed in RIPA buffer containing protease inhibitors (Sigma-Aldrich) and phosphatase inhibitors (Keygen, China). Proteins were separated by SDS-PAGE gels and blotted onto a polyvinylidene fluoride (PVDF) membrane (Millipore). The membrane was probed with the primary antibody as indicated and then with the peroxidase-conjugated secondary antibody. POLR3D (ab86786), ANG (ab10600), AGO1 (ab5070), and AGO2 (ab32381) antibodies were purchased from Abcam. GAPDH (sc-32233) antibodies were purchased from Santa Cruz Biotechnology. Puromycin (12D10, MABE343) antibodies were purchased from Millipore. Western blot bands were visualized using an enhanced chemiluminescence (ECL) western blot kit (CWBIO Technology) and captured with a ChemiDoc XRS Molecular Imager (Bio-Rad).
RNA Interference
Ten million LCL cells were transfected with 40 nM of siRNA targeting 5′-HisGUG (5′-UCGUAUAGUGGUUAGUACUUU-3′), 5′-ValAAC (5′-UAGUGUAGUGG UUAUCACGUU-3′), or the scramble control (5′-UGUGAGUCACGUGAGGGCAGAAU CUGCUC-3′) using Entranster-D4000 and -R4000 reagent following the manufacturer’s instructions (Engreen, Inc.). 48 h post transfection, the cells were harvested. The efficiency of RNAi knockdown was verified by northern blotting. For knockdown of ANG and AGO2, the oligo sequences against ANG (5′-GACTTGCTTATTCTTAGGTTT-3′), AGO2 (5′-CAAGACACTCTGCGCACCATGTA CT-3′), and a non-specific control sequence (5′-TGCGTTG CTAGTACCAAC-3′) were used as in previous reports.42,43 The DNA oligo of shRNA sequences targeted to ANG or AGO2 were individually inserted into the pGIPz vector following the Clontech Laboratories instructions. The pGIPz vector carrying different shRNAs was co-transfected with lentivirus packaging plasmids into HEK293T cells for 48 h to generate lentiviruses. The shRNA-packaged lentiviruses were individually transduced into LCL1 cells, followed by treatment with 2 μg/mL of puromycin. Immunoblot analysis with ANG and AGO2 antibodies was used to verify the efficiency of RNA interference.
AGO:5′ tRNA Half Immunoprecipitation Assay
AGO:5′ tRNA half immunoprecipitation was performed as described previously with appropriate modifications based on the HITS-CLIP (high-throughput sequencing, cross-linked immunoprecipitation) technique.23,44 Briefly, cells were lysed in ice-cold lysis buffer (50 mM Tris-HCl [pH 8.0], 150 mM NaCl, 5 mM EDTA, and 0.5% Nonidet P-40) with freshly added 1 mM DTT, 200 U/mL RNase inhibitor (Promega), and a protease inhibitor cocktail (Roche) for 30 min at −80°C. After dissolving at room temperature, centrifugation was performed at 16,000 rpm at 4°C for 10 min. The supernatant was first mixed with 40 μL of protein G magnetic beads (Millipore) and incubated at 4°C for 3 h with gentle agitation (mock). After immobilizing the magnetic beads with a magnet, the supernatant was removed and mixed with 5 μL of specific antibodies or normal mouse immunoglobulin G (IgG) for 3 h at 4°C with gentle agitation. Then, 40 μL of protein G magnetic beads was added and incubated for 3 h at 4°C. The immunoprecipitated pellet was washed five times in lysis buffer and separated into two portions: one for RNA isolation as a sample for the following experiment and another for immunoblotting to identify immunoprecipitation of AGO1/2. The fractions of input and sRNAs associated with AGO1/2 were isolated by acid-phenol:chloroform extraction followed by ethanol precipitation. The RNA concentrations were measured with a NanoDrop2000 (Thermo Scientific) and subsequently analyzed by northern blot assays.
qRT-PCR of the 5′-HisGUG Half, miR-20a, and mRNA
The sequences of the adapters and primers for quantitation analysis of the 5′-tRNA-HisGUG half, miR-20a (UAAAGUGCUUAUAGUGCAGGUAG), and ANG are shown in Table S1. Total RNA was extracted with TRIeasy (Yeasen) according to the manufacturer’s instructions. For the 5′-HisGUG half, the purified RNA was treated with T4 polynucleotide kinase (Beyotime, D7096) to remove 2,3 cyclic phosphate at the 3′ end of 5′ tRNA half. The treated RNAs (400 ng) were subjected to a ligation reaction with a 3′ RNA adaptor (20 pmol) using 5 U T4 RNA ligase (Beyotime, D7021). Subsequently, cDNA was synthesized with Hifair II First Strand cDNA Synthesis SuperMix (Yeasen) using the treated RNA as a template. The levels of 5′-tRNA-HisGUG were normalized to U6 small nuclear RNA (snRNA) expression levels. For miR-20a, total RNA was treated with a miRNA First Strand cDNA Synthesis Kit (Vazyme, MR101) to synthesize cDNA and subjected to qPCR analysis. For mRNA transcripts, total RNA was directly reverse-transcribed into cDNA and subjected to qPCR analysis. The transcription levels of genes were normalized by β-actin. The fold changes were calculated using the 2−ΔΔCt method.
Luciferase Reporter Assay
Dual luciferase reporters were constructed to contain a single copy of a complementary target site of the sequences of 5′-tRNAHis. Oligonucleotides (Genepharma) were designed with XhoI and NotI overhangs, annealed, and ligated into the vector pmiR-RB-REPORT using XhoI and NotI restriction enzyme sites. The empty vector was used as a control. For luciferase reporter assays, the reporter plasmids were co-transfected with the purified endogenous 5′-half tRNA or a nonspecific oligonucleotide control (Genepharma) into HEK293 cells. Luciferase activity was measured 48 h post-transfection using the Luc-Pair miR Luciferase Assay Kit (GeneCopoeia) on a Panomics luminometer.
Ribopuromycilation Assay
The ribopuromycilation assay was performed as described previously with a modification.45 LCL cells were transfected with siRNA against 5′-HisGUG or a control, followed by LA treatment, or directly treated with LA for 0, 24, or 48 h or left untreated. At various time points, the cells were pulse labeled with 1 μM puromycin for an additional hour before harvest and subjected to immunoblot analysis with the indicated antibodies.
Cell Proliferation Assay
A total of 5 × 10⁵ LCL cells were seeded into a 25-cm2 flask with 10 mL RPMI 1640 medium with or without siRNA and cultured at 37°C. The cell numbers were counted using Vi-cell XR (Beckman Coulter) at different time points.
Affinity Purification of the 5′-tRNA Half
To purify the endogenous 5′ tRNA half, total RNA from LCL cells with LA treatment for 24 h was isolated. Hybridization to a complementary DNA strand of 5′ tRNA was carried out by incubating 1 μL (0.1 mM) of a 5′ end-biotinylated antisense DNA oligo (biotin-ASO) with 5 μg of total RNA (size, 30–40 nt) in 100 μL of 5× saline sodium citrate (SSC) buffer (750 mM NaCl and 75 mM trisodium citrate). The sample was denatured for 3 min at 90°C, followed by hybridization for 10 min at 65°C. The RNA-DNA hybrid was immobilized onto pre-washed streptavidin magnetics beads (25 μL, Roche Diagnostics) and incubated for 30 min at room temperature with rotation. The supernatant containing the unbound RNA pool (flowthrough) was removed and stored for future use. Beads were washed once with 50 μL of 1× SSC buffer and 3 times with 50 μL of 0.1× SSC buffer. The 5′ tRNA half was eluted by heating the beads in 100 μL of ddH2O at 75°C for 3 min. Contaminating biotin-ASO was removed by DNase I treatment (Thermo Scientific). The affinity-purified 5′ tRNA half was extracted using Roti-Aqua-P/C/I (Roche). Finally, the RNA of the flowthrough and affinity-purified 5′ tRNA half were individually precipitated with 2.5 volumes of 100% ethanol at −20°C overnight. The samples were washed with 70% ethanol and resuspended in 15 μL ddH2O. To verify the quality of the affinity purification procedure, 200 ng of RNA was loaded onto a denaturing 8% polyacrylamide gel followed by northern blot analysis. The sequence of the cDNA oligonucleotide (biotin-ASO) used for affinity purification of 5′-tRNA-HisGUG was 5′-AACGCAGAGTACTAACC ACTATACGATCACGGC-3′ (Genepharma, Shanghai). The sample from the affinity purification procedure in the absence of biotin-ASO was used as a control.
Cell Cycle Analysis
The treated cells were harvested, washed twice with PBS, and resuspended at 1 × 10⁶ cells/mL. 1 mL cells were aliquoted in a 15-mL polypropylene V-bottomed tube, and 3 mL cold absolute ethanol was added. The cells were fixed in 70% ethanol for at least 2 h at 4°C with rotation. The fixed cells were then washed twice with PBS and resuspended in 1 mL propidium iodide (PI) staining solution (50 μg/mL) and RNase A (100 ng/mL) and incubated in the dark at room temperature for 30 min. 1 × 10⁴ PI-stained cells were subjected to flow cytometry using a Beckman Coulter Navios flow cytometer. The data were analyzed using FlowJo software.
Soft Agar Colony Formation Assay
The soft agar colony formation assay was performed as described previously with slight modifications46 Briefly, the bottom layer containing 0.75% agar in 10% FBS and RPMI 1640 medium was prepared first, and then the top layer containing an appropriate amount of cells in 0.36% agar mixture was placed on the bottom layer. 2 × 10⁴ or 5 × 10⁴ LCL cells were seeded in a 60-mm2 Petri plate and grown in 10% FBS containing RPMI 1640 medium with or without 20 nM siRNA targeting 5′-HisGUG or a scramble control. The dish containing 2 layers was maintained in a 37°C incubator for 3 weeks, and then the colonies were stained with 0.04% crystal violet-2% ethanol in PBS.
Animal Experiments
Five-week-old female non-obese diabetic (NOD)/severe combined immunodeficiency (SCID) mice (Beijing Vital River Laboratory Animal Technology, China) with similar weights were randomly divided into 4 groups (PBS as a control, sodium lactate and PBS, sodium lactate and siRNA control, and sodium lactate and siRNA 5′-HisGUG). Each mouse (5 mice/group) was injected intraperitoneally with 107 LCL cells expressing luciferase (LCL-Luc). For the tumor formation experiment, starting on day 7 after cell injection, sodium lactate (final concentration, 0.5 g/1 kg) or PBS for the control group was injected subcutaneously around the tumors every 2 days five times. Starting on day 17, siRNA formulations were administered five times every 2 days. The following siRNAs were used: 1 nmol siRNA, 5′-HisGUG (5′-UCGUAUAGUGGUUAGUACUUU-3′) with transfection reagent (catalog number 8668-11-1, Engreen); 1 nmol siRNA, control with transfection reagent. The mice were subjected to live imaging at weeks 0 and 5 post-inoculation. The mice were injected intraperitoneally with D-luciferin at 150 mg/kg body weight. Then the mice were imaged for 0.1, 0.5, 1, 5, and 10 s 12 min after injection of D-luciferin using an IVIS Spectrum Imaging System (PerkinElmer). Data were presented as total radiance within the region of interest (ROI) with mice imaged for 0.5 s.
Ethics Statement
All animal studies were conducted in accordance with the China Guide for the Care and Use of Laboratory Animals. All experiments were approved and overseen by the Institutional Animal Care and Use Committee at Fudan University under protocol 196086.
Statistical Analysis
Statistical analyses were performed with SPSS v.19.0 software, and graphs were completed using GraphPad Prism 5 software. Results are presented as the mean ± SD of three replicated experiments, and the difference between two experimental groups was evaluated using Student’s t test, with statistical significance defined as p <0.05.
Author Contributions
X.M., S.D., X.C., Y.W., and X.L. planned and performed the experiments and analyzed data. X.M., S.D., and X.C. drafted the manuscript. C. Zhang, C. Zhu, and L.D. contributed to discussions of experimental designs and supervised experiments. Y.L. and Y.T. contributed to blood donor communication and sample collection. D.Q., Q.J., and F.T. provided resources. X.M., F.W., and Q.C. initiated and supervised the project, acquired grants, and contributed to writing of the manuscript.
Conflicts of Interest
The authors declare no competing interests.
Acknowledgments
We are grateful to B cell lymphoma volunteer patients for support and the staff of the Core Facility of Microbiology and Parasitology of SHMC for technical support. This work was supported by the National Natural Science Foundation of China (81672015, 81971930, 81772166, and 81502738); the Scientific Research Project of Shanghai Municipal Health Commission (201940293); the National Mega-project for Innovative Drugs (2019ZX09721001); and the Research Program on Biosafety Guarantee Technology of the High-Level Biosafety Laboratory and Important Pathogen Laboratory (2018ZX10734401-004). F.W. is a scholar of Pujiang Talents in Shanghai. Q.C. is a scholar of New Century Excellent Talents at the University of China.
Footnotes
Supplemental Information can be found online at https://doi.org/10.1016/j.ymthe.2020.09.010.
Contributor Information
Fei Tan, Email: tanfeitrue@126.com.
Fang Wei, Email: fangwei@sjtu.edu.cn.
Qiliang Cai, Email: qiliang@fudan.edu.cn.
Supplemental Information
References
- 1.Chan P.P., Lowe T.M. GtRNAdb: a database of transfer RNA genes detected in genomic sequence. Nucleic Acids Res. 2009;37:D93–D97. doi: 10.1093/nar/gkn787. [DOI] [PMC free article] [PubMed] [Google Scholar]
- 2.Hopper A.K., Phizicky E.M. tRNA transfers to the limelight. Genes Dev. 2003;17:162–180. doi: 10.1101/gad.1049103. [DOI] [PubMed] [Google Scholar]
- 3.Lund E., Dahlberg J.E. Proofreading and aminoacylation of tRNAs before export from the nucleus. Science. 1998;282:2082–2085. doi: 10.1126/science.282.5396.2082. [DOI] [PubMed] [Google Scholar]
- 4.LaCava J., Houseley J., Saveanu C., Petfalski E., Thompson E., Jacquier A., Tollervey D. RNA degradation by the exosome is promoted by a nuclear polyadenylation complex. Cell. 2005;121:713–724. doi: 10.1016/j.cell.2005.04.029. [DOI] [PubMed] [Google Scholar]
- 5.Vanácová S., Wolf J., Martin G., Blank D., Dettwiler S., Friedlein A., Langen H., Keith G., Keller W. A new yeast poly(A) polymerase complex involved in RNA quality control. PLoS Biol. 2005;3:e189. doi: 10.1371/journal.pbio.0030189. [DOI] [PMC free article] [PubMed] [Google Scholar]
- 6.Maute R.L., Schneider C., Sumazin P., Holmes A., Califano A., Basso K., Dalla-Favera R. tRNA-derived microRNA modulates proliferation and the DNA damage response and is down-regulated in B cell lymphoma. Proc. Natl. Acad. Sci. USA. 2013;110:1404–1409. doi: 10.1073/pnas.1206761110. [DOI] [PMC free article] [PubMed] [Google Scholar]
- 7.Honda S., Loher P., Shigematsu M., Palazzo J.P., Suzuki R., Imoto I., Rigoutsos I., Kirino Y. Sex hormone-dependent tRNA halves enhance cell proliferation in breast and prostate cancers. Proc. Natl. Acad. Sci. USA. 2015;112:E3816–E3825. doi: 10.1073/pnas.1510077112. [DOI] [PMC free article] [PubMed] [Google Scholar]
- 8.Gebetsberger J., Polacek N. Slicing tRNAs to boost functional ncRNA diversity. RNA Biol. 2013;10:1798–1806. doi: 10.4161/rna.27177. [DOI] [PMC free article] [PubMed] [Google Scholar]
- 9.Sobala A., Hutvagner G. Transfer RNA-derived fragments: origins, processing, and functions. Wiley Interdiscip. Rev. RNA. 2011;2:853–862. doi: 10.1002/wrna.96. [DOI] [PubMed] [Google Scholar]
- 10.Thompson D.M., Parker R. Stressing out over tRNA cleavage. Cell. 2009;138:215–219. doi: 10.1016/j.cell.2009.07.001. [DOI] [PubMed] [Google Scholar]
- 11.Thompson D.M., Parker R. The RNase Rny1p cleaves tRNAs and promotes cell death during oxidative stress in Saccharomyces cerevisiae. J. Cell Biol. 2009;185:43–50. doi: 10.1083/jcb.200811119. [DOI] [PMC free article] [PubMed] [Google Scholar]
- 12.Saikia M., Jobava R., Parisien M., Putnam A., Krokowski D., Gao X.H., Guan B.J., Yuan Y., Jankowsky E., Feng Z. Angiogenin-cleaved tRNA halves interact with cytochrome c, protecting cells from apoptosis during osmotic stress. Mol. Cell. Biol. 2014;34:2450–2463. doi: 10.1128/MCB.00136-14. [DOI] [PMC free article] [PubMed] [Google Scholar]
- 13.Li S., Xu Z., Sheng J. tRNA-Derived Small RNA: A Novel Regulatory Small Non-Coding RNA. Genes. 2018;9:246. doi: 10.3390/genes9050246. [DOI] [PMC free article] [PubMed] [Google Scholar]
- 14.Afonso J., Pinto T., Simões-Sousa S., Schmitt F., Longatto-Filho A., Pinheiro C., Marques H., Baltazar F. Clinical significance of metabolism-related biomarkers in non-Hodgkin lymphoma - MCT1 as potential target in diffuse large B cell lymphoma. Cell Oncol. (Dordr.) 2019;42:303–318. doi: 10.1007/s13402-019-00426-2. [DOI] [PMC free article] [PubMed] [Google Scholar]
- 15.Schaefer N.G., Geschwind J.F., Engles J., Buchanan J.W., Wahl R.L. Systemic administration of 3-bromopyruvate in treating disseminated aggressive lymphoma. Transl. Res. 2012;159:51–57. doi: 10.1016/j.trsl.2011.08.008. [DOI] [PubMed] [Google Scholar]
- 16.Kutok J.L., Wang F. Spectrum of Epstein-Barr virus-associated diseases. Annu. Rev. Pathol. 2006;1:375–404. doi: 10.1146/annurev.pathol.1.110304.100209. [DOI] [PubMed] [Google Scholar]
- 17.Yuan J., Cahir-McFarland E., Zhao B., Kieff E. Virus and cell RNAs expressed during Epstein-Barr virus replication. J. Virol. 2006;80:2548–2565. doi: 10.1128/JVI.80.5.2548-2565.2006. [DOI] [PMC free article] [PubMed] [Google Scholar]
- 18.Martin K.A., Lupey L.N., Tempera I. Epstein-Barr Virus Oncoprotein LMP1 Mediates Epigenetic Changes in Host Gene Expression through PARP1. J. Virol. 2016;90:8520–8530. doi: 10.1128/JVI.01180-16. [DOI] [PMC free article] [PubMed] [Google Scholar]
- 19.Sommermann T.G., O’Neill K., Plas D.R., Cahir-McFarland E. IKKβ and NF-κB transcription govern lymphoma cell survival through AKT-induced plasma membrane trafficking of GLUT1. Cancer Res. 2011;71:7291–7300. doi: 10.1158/0008-5472.CAN-11-1715. [DOI] [PMC free article] [PubMed] [Google Scholar]
- 20.Mo X., Wei F., Tong Y., Ding L., Zhu Q., Du S., Tan F., Zhu C., Wang Y., Yu Q. Lactic Acid Downregulates Viral MicroRNA To Promote Epstein-Barr Virus-Immortalized B Lymphoblastic Cell Adhesion and Growth. J. Virol. 2018;92:e00033-18. doi: 10.1128/JVI.00033-18. [DOI] [PMC free article] [PubMed] [Google Scholar]
- 21.Burroughs A.M., Ando Y., de Hoon M.J., Tomaru Y., Suzuki H., Hayashizaki Y., Daub C.O. Deep-sequencing of human Argonaute-associated small RNAs provides insight into miRNA sorting and reveals Argonaute association with RNA fragments of diverse origin. RNA Biol. 2011;8:158–177. doi: 10.4161/rna.8.1.14300. [DOI] [PMC free article] [PubMed] [Google Scholar]
- 22.Yamakawa N., Okuyama K., Ogata J., Kanai A., Helwak A., Takamatsu M., Imadome K., Takakura K., Chanda B., Kurosaki N. Novel functional small RNAs are selectively loaded onto mammalian Ago1. Nucleic Acids Res. 2014;42:5289–5301. doi: 10.1093/nar/gku137. [DOI] [PMC free article] [PubMed] [Google Scholar]
- 23.Chi S.W., Zang J.B., Mele A., Darnell R.B. Argonaute HITS-CLIP decodes microRNA-mRNA interaction maps. Nature. 2009;460:479–486. doi: 10.1038/nature08170. [DOI] [PMC free article] [PubMed] [Google Scholar]
- 24.Thomson D.W., Pillman K.A., Anderson M.L., Lawrence D.M., Toubia J., Goodall G.J., Bracken C.P. Assessing the gene regulatory properties of Argonaute-bound small RNAs of diverse genomic origin. Nucleic Acids Res. 2015;43:470–481. doi: 10.1093/nar/gku1242. [DOI] [PMC free article] [PubMed] [Google Scholar]
- 25.Elkayam E., Kuhn C.D., Tocilj A., Haase A.D., Greene E.M., Hannon G.J., Joshua-Tor L. The structure of human argonaute-2 in complex with miR-20a. Cell. 2012;150:100–110. doi: 10.1016/j.cell.2012.05.017. [DOI] [PMC free article] [PubMed] [Google Scholar]
- 26.Yuan G., Zhao Y., Wu D., Gao C., Jiao Z. miRNA-20a upregulates TAK1 and increases proliferation in osteosarcoma cells. Future Oncol. 2018;14:461–469. doi: 10.2217/fon-2017-0490. [DOI] [PubMed] [Google Scholar]
- 27.Bai X., Han G., Liu Y., Jiang H., He Q. MiRNA-20a-5p promotes the growth of triple-negative breast cancer cells through targeting RUNX3. Biomed. Pharmacother. 2018;103:1482–1489. doi: 10.1016/j.biopha.2018.04.165. [DOI] [PubMed] [Google Scholar]
- 28.Guo L., Zhao J., Qu Y., Yin R., Gao Q., Ding S., Zhang Y., Wei J., Xu G. microRNA-20a Inhibits Autophagic Process by Targeting ATG7 and ATG16L1 and Favors Mycobacterial Survival in Macrophage Cells. Front. Cell. Infect. Microbiol. 2016;6:134. doi: 10.3389/fcimb.2016.00134. [DOI] [PMC free article] [PubMed] [Google Scholar]
- 29.Li R., Qiao M., Zhao X., Yan J., Wang X., Sun Q. MiR-20a-3p regulates TGF-β1/Survivin pathway to affect keratinocytes proliferation and apoptosis by targeting SFMBT1 in vitro. Cell. Signal. 2018;49:95–104. doi: 10.1016/j.cellsig.2018.06.003. [DOI] [PubMed] [Google Scholar]
- 30.Honda S., Loher P., Shigematsu M., Palazzo J.P., Suzuki R., Imoto I., Rigoutsos I., Kirino Y. Sex hormone-dependent tRNA halves enhance cell proliferation in breast and prostate cancers. Proc. Natl. Acad. Sci. USA. 2015;112:E3816–E3825. doi: 10.1073/pnas.1510077112. [DOI] [PMC free article] [PubMed] [Google Scholar]
- 31.Shao Y., Sun Q., Liu X., Wang P., Wu R., Ma Z. tRF-Leu-CAG promotes cell proliferation and cell cycle in non-small cell lung cancer. Chem. Biol. Drug Des. 2017;90:730–738. doi: 10.1111/cbdd.12994. [DOI] [PMC free article] [PubMed] [Google Scholar]
- 32.Ivanov P., Emara M.M., Villen J., Gygi S.P., Anderson P. Angiogenin-induced tRNA fragments inhibit translation initiation. Mol. Cell. 2011;43:613–623. doi: 10.1016/j.molcel.2011.06.022. [DOI] [PMC free article] [PubMed] [Google Scholar]
- 33.Lee S.R., Collins K. Starvation-induced cleavage of the tRNA anticodon loop in Tetrahymena thermophila. J. Biol. Chem. 2005;280:42744–42749. doi: 10.1074/jbc.M510356200. [DOI] [PubMed] [Google Scholar]
- 34.Fu H., Feng J., Liu Q., Sun F., Tie Y., Zhu J., Xing R., Sun Z., Zheng X. Stress induces tRNA cleavage by angiogenin in mammalian cells. FEBS Lett. 2009;583:437–442. doi: 10.1016/j.febslet.2008.12.043. [DOI] [PubMed] [Google Scholar]
- 35.Lee Y.S., Shibata Y., Malhotra A., Dutta A. A novel class of small RNAs: tRNA-derived RNA fragments (tRFs) Genes Dev. 2009;23:2639–2649. doi: 10.1101/gad.1837609. [DOI] [PMC free article] [PubMed] [Google Scholar]
- 36.Garcia-Silva M.R., Frugier M., Tosar J.P., Correa-Dominguez A., Ronalte-Alves L., Parodi-Talice A., Rovira C., Robello C., Goldenberg S., Cayota A. A population of tRNA-derived small RNAs is actively produced in Trypanosoma cruzi and recruited to specific cytoplasmic granules. Mol. Biochem. Parasitol. 2010;171:64–73. doi: 10.1016/j.molbiopara.2010.02.003. [DOI] [PubMed] [Google Scholar]
- 37.Hartmann A., Kunz M., Köstlin S., Gillitzer R., Toksoy A., Bröcker E.B., Klein C.E. Hypoxia-induced up-regulation of angiogenin in human malignant melanoma. Cancer Res. 1999;59:1578–1583. [PubMed] [Google Scholar]
- 38.Nakamura M., Yamabe H., Osawa H., Nakamura N., Shimada M., Kumasaka R., Murakami R., Fujita T., Osanai T., Okumura K. Hypoxic conditions stimulate the production of angiogenin and vascular endothelial growth factor by human renal proximal tubular epithelial cells in culture. Nephrol. Dial. Transplant. 2006;21:1489–1495. doi: 10.1093/ndt/gfl041. [DOI] [PubMed] [Google Scholar]
- 39.Shigematsu M., Kirino Y. tRNA-Derived Short Non-coding RNA as Interacting Partners of Argonaute Proteins. Gene Regul. Syst. Bio. 2015;9:27–33. doi: 10.4137/GRSB.S29411. [DOI] [PMC free article] [PubMed] [Google Scholar]
- 40.Kuscu C., Kumar P., Kiran M., Su Z., Malik A., Dutta A. tRNA fragments (tRFs) guide Ago to regulate gene expression post-transcriptionally in a Dicer independent manner. RNA. 2018;24:1093–1105. doi: 10.1261/rna.066126.118. [DOI] [PMC free article] [PubMed] [Google Scholar]
- 41.Sun G., Yan J., Noltner K., Feng J., Li H., Sarkis D.A., Sommer S.S., Rossi J.J. SNPs in human miRNA genes affect biogenesis and function. RNA. 2009;15:1640–1651. doi: 10.1261/rna.1560209. [DOI] [PMC free article] [PubMed] [Google Scholar]
- 42.Cai Q., Cai S., Zhu C., Verma S.C., Choi J.Y., Robertson E.S. A unique SUMO-2-interacting motif within LANA is essential for KSHV latency. PLoS Pathog. 2013;9:e1003750. doi: 10.1371/journal.ppat.1003750. [DOI] [PMC free article] [PubMed] [Google Scholar]
- 43.Yamasaki S., Ivanov P., Hu G.F., Anderson P. Angiogenin cleaves tRNA and promotes stress-induced translational repression. J. Cell Biol. 2009;185:35–42. doi: 10.1083/jcb.200811106. [DOI] [PMC free article] [PubMed] [Google Scholar]
- 44.Bracken C.P., Li X., Wright J.A., Lawrence D.M., Pillman K.A., Salmanidis M., Anderson M.A., Dredge B.K., Gregory P.A., Tsykin A. Genome-wide identification of miR-200 targets reveals a regulatory network controlling cell invasion. EMBO J. 2014;33:2040–2056. doi: 10.15252/embj.201488641. [DOI] [PMC free article] [PubMed] [Google Scholar]
- 45.Schmidt E.K., Clavarino G., Ceppi M., Pierre P. SUnSET, a nonradioactive method to monitor protein synthesis. Nat. Methods. 2009;6:275–277. doi: 10.1038/nmeth.1314. [DOI] [PubMed] [Google Scholar]
- 46.Zhu Q., Ding L., Zi Z., Gao S., Wang C., Wang Y., Zhu C., Yuan Z., Wei F., Cai Q. Viral-Mediated AURKB Cleavage Promotes Cell Segregation and Tumorigenesis. Cell Rep. 2019;26:3657–3671.e5. doi: 10.1016/j.celrep.2019.02.106. [DOI] [PubMed] [Google Scholar]
Associated Data
This section collects any data citations, data availability statements, or supplementary materials included in this article.