

Abstract
The role of an extracellular matrix- (ECM-) receptor interaction signature has not been fully clarified in gastric cancer. This study performed comprehensive analyses on the differentially expressed ECM-related genes, clinicopathologic features, and prognostic application in gastric cancer. The differentially expressed genes between tumorous and matched normal tissues in The Cancer Genome Atlas (TCGA) and validation cohorts were identified by a paired t-test. Consensus clusters were built to find the correlation between clinicopathologic features and subclusters. Then, the least absolute shrinkage and selection operator (lasso) method was used to construct a risk score model. Correlation analyses were made to reveal the relation between risk score-stratified subgroups and clinicopathologic features or significant signatures. In TCGA (26 pairs) and validation cohort (134 pairs), 25 ECM-related genes were significantly highly expressed and 11 genes were downexpressed in gastric cancer. ECM-based subclusters were slightly related to clinicopathologic features. We constructed a risk score model = 0.081∗log2 (CD36) + 0.043∗log2 (COL5A2) + 0.001∗log2 (ITGB5) + 0.039∗log2 (SDC2) + 0.135∗log2 (SV2B) + 0.012∗log2 (THBS1) + 0.068∗log2 (VTN) + 0.023∗log2 (VWF). The risk score model could well predict the outcome of patients with gastric cancer in both training (n = 351, HR: 1.807, 95% CI: 1.292-2.528, P = 0.00046) and validation (n = 300, HR: 1.866, 95% CI: 1.347-2.584, P = 0.00014) cohorts. Besides, risk score-based subgroups were associated with angiogenesis, cell adhesion molecules, complement and coagulation cascades, TGF-beta signaling, and mismatch repair-relevant signatures (P < 0.0001). By univariate (1.845, 95% CI: 1.382-2.462, P < 0.001) and multivariate (1.756, 95% CI: 1.284-2.402, P < 0.001) analyses, we regarded the risk score as an independent risk factor in gastric cancer. Our findings revealed that ECM compositions became accomplices in the tumorigenesis, progression, and poor survival of gastric cancer.
1. Introduction
As a common tumor of the digestive system, gastric cancer is the fifth common malignant tumor and the third leading cause of cancer death in the world [1, 2]. Due to the occult course of gastric cancer, it is of great significance to clarify the pathogenesis and find effective markers for gastric cancer.
In recent years, studies have shown that the extracellular matrix (ECM) remodeling, namely, the synthesis, distribution, and degradation of ECM, is closely connected to the differentiation, proliferation, invasion, and metastasis of malignant tumors [3]. ECM constitutes the main part of the extracellular microenvironment [4]. It is a complex organic unity constructed by a variety of insoluble extracellular macromolecules in a certain proportion and structure. It is the site of cell survival and activity, with physical functions such as connection, support, water retention, pressure resistance, and protection. In addition, by integrin or other cell surface receptors, it can directly interact with cells to regulate growth, metabolism, function, migration, proliferation, and differentiation of cells, thus to adjust functions of the whole tissue and organs [4]. Recent studies on solid tumors such as breast cancer and ovarian cancer have suggested that ECM underwent a remodeling process similar to embryonic development in tumor progression. The reconstructed ECM then forms a loose microenvironment for cancer cells, giving rise to high proliferation, low differentiation, and invasion and metastasis of tumor cells [5]. Therefore, the identification of prominent ECM-relevant tumor markers that derive the biological perspective into the development and progression of gastric cancer would be of clinical value. In this study, the differentially expressed ECM-relevant markers were identified between gastric cancer and normal tissues. Based on the selection operator (lasso) regression model, it revealed that the ECM-relevant markers exhibited a great value to predict the prognosis of gastric cancer.
2. Methods
2.1. Datasets
We downloaded The Cancer Genome Atlas-Stomach Adenocarcinoma (TCGA-STAD) data from the UCSC Xena browser (https://xena.ucsc.edu/) [6]. The RNA-sequencing data were unified into log2 (FPKM + 1) (fragments per kilobase million (FPKM)). The validation data GSE29272 [7] and GSE62254 [8] were downloaded from Gene Expression Omnibus datasets (https://www.ncbi.nlm.nih.gov/geo/).
2.2. Genes of Researched Signatures
We investigated all ECM-receptor interaction-related genes (KEGG hsa04512) from the Kyoto Encyclopedia of Genes and Genomes (KEGG) (https://www.kegg.jp/) [9]. Besides, genes of cell adhesion molecules (CAMs) (KEGG hsa04514), complement and coagulation cascades (KEGG hsa04610), TGF-beta signaling pathway (KEGG hsa04530), base excision repair (KEGG hsa03410), DNA replication (KEGG hsa03030), nucleotide excision repair (KEGG hsa03420), and mismatch repair (KEGG hsa03430) were also identified from KEGG (Table 1).
Table 1.
Genes of researched signatures.
| Gene signature | Gene | Source |
|---|---|---|
| ECM-receptor interaction | GP1BA, COL6A2, COL6A3, GP1BB, COL5A2, COL6A1, LAMA1, VWF, HSPG2, TNN, FN1, ITGA9, GP9, COMP, IBSP, CD36, CHAD, GP5, VTN, THBS4, ITGA4, ITGA3, ITGA2B, ITGA7, ITGA5, COL5A1, COL4A6, ITGA11, SV2C, COL2A1, COL3A1, COL4A1, AGRN, COL4A2, COL4A4, ITGB3, ITGB4, RELN, ITGB5, ITGB6, ITGB7, LAMC2, ITGAV, ITGB1, LAMB2, SPP1, LAMB3, LAMC1, COL1A1, LAMA4, LAMA5, LAMB1, COL1A2, ITGA10, GP6, ITGA8, LAMB4, TNR, CD47, SV2A, CD44, DAG1, TNXB, LAMA3, LAMA2, SDC3, ITGB8, ITGA6, ITGA2, ITGA1, SV2B, TNC, COL11A1, LAMC3, COL11A2, HMMR, SDC2, SDC4, COL5A3, THBS3, COL6A6, THBS2, SDC1, THBS1 | KEGG hsa04512 |
| Cell adhesion molecules (CAMs) | CDH5, JAM3, CDH3, NLGN3, CDH4, CD80, NLGN1, CD86, CD28, CD274, PDCD1LG2, ITGA9, ITGAL, NRCAM, ITGAM, CD34, CD276, ICOSLG, CADM3, ITGA4, ICOS, SIGLEC1, CADM1, HLA-G, CLDN20, PECAM1, CD22, ITGB7, SELL, VCAM1, ITGAV, SELP, SPN, ITGB1, SELPLG, ITGB2, CDH2, JAM2, CTLA4, HLA-DRB4, CDH15, CLDN18, CD4, HLA-DRB5, CNTN1, NLGN2, HLA-DRB3, NRXN3, ALCAM, SELE, CD8A, CD8B, CD6, NLGN4X, CLDN17, L1CAM, ITGB8, MAG, VCAN, HLA-F, NFASC, HLA-E, NRXN1, HLA-DPA1, HLA-DPB1, CLDN9, GLG1, HLA-DQA1, HLA-DQA2, HLA-DQB1, NRXN2, CD2, CLDN16, CLDN23, MADCAM1, SDC2, SDC4, CLDN14, CD40, SDC1, OCLN, PVR, HLA-DRB1, NECTIN2, CDH1, HLA-DRA, NECTIN1, HLA-DOA, HLA-DOB, CLDN10, CNTNAP1, ICAM2, ICAM3, CLDN8, CLDN2, CLDN6, CLDN5, CLDN1, ICAM1, NEO1, HLA-C, HLA-B, ESAM, CD40LG, PTPRM, HLA-DMB, HLA-DMA, HLA-A, F11R, PDCD1, CLDN19, PTPRF, CLDN15, CD226, CD99, CLDN22, CNTN2, ITGA6, CNTNAP2, MPZ, MPZL1, PTPRC, NECTIN3, ITGA8, NCAM2, NCAM1, CD58, NEGR1, CLDN11, SDC3, CLDN3, CLDN7, CLDN4 | KEGG hsa04514 |
| Complement and coagulation cascades | F2, F2R, VWF, KNG1, FGB, PLAT, SERPIND1, MBL2, F3, F5, SERPINA1, PLAUR, F7, PLAU, F10, F9, C1S, TFPI, F8, KLKB1, CR2, MASP1, C9, A2M, CR1, F12, F13A1, F11, CFI, SERPING1, MASP2, THBD, C1QC, C8A, F13B, C7, C8G, C8B, CD59, SERPINA5, FGG, CD55, C6, C5AR1, C5, BDKRB1, CFD, C1QA, C1R, C4BPB, C4BPA, C4B, C4A, BDKRB2, CFH, CFB, CPB2, CD46, PROS1, SERPINF2, PROC, C3, C1QB, C3AR1, FGA, SERPINE1, PLG, C2, SERPINC1 | KEGG hsa04610 |
| TGF-beta signaling pathway | TFDP1, NOG, TNF, GDF7, INHBB, INHBC, COMP, INHBA, THBS4, RHOA, CREBBP, ROCK1, INHBE, THBS2, DCN, ID1, ID2, RPS6KB1, RPS6KB2, CUL1, ID4, SMAD3, MAPK3, RBL2, SMAD4, RBL1, NODAL, THBS1, THBS3, SP1, SMAD1, MYC, SMAD2, MAPK1, SMURF2, SMURF1, EP300, BMP8A, GDF5, SKP1, CHRD, ZFYVE16, BMP6, BMP5, E2F4, TGFB2, TGFB1, IFNG, CDKN2B, PPP2CB, PPP2CA, PPP2R1A, ID3, SMAD5, RBX1, FST, PITX2, ZFYVE9, BMP7, PPP2R1B, TGFBR2, AMHR2, LTBP1, LEFTY1, AMH, TGFBR1, SMAD9, LEFTY2, SMAD7, ROCK2, BMP8B, ACVR1C, TGFB3, SMAD6, BMPR2, GDF6, BMPR1A, BMPR1B, ACVRL1, ACVR2B, ACVR2A, ACVR1, BMP4, E2F5, BMP2 | KEGG hsa04530 |
| Base excision repair | NEIL2, MPG, SMUG1, XRCC1, POLE4, HMGB1, POLE3, POLD4, MBD4, OGG1, UNG, POLD3, MUTYH, PARP1, LIG1, PCNA, NEIL1, POLE2, PARP4, PARP3, PARP2, POLB, APEX1, POLL, POLD1, POLD2, POLE, NEIL3, FEN1, TDG, APEX2, LIG3, HMGB1P1, NTHL1, HMGB1P40 | KEGG hsa03410 |
| DNA replication | DNA2, POLE4, POLE3, PRIM1, PRIM2, POLD4, RFC4, RFC5, RPA1, POLA1, RPA3, POLD3, LIG1, SSBP1, FEN1, RNASEH2B, RPA2, PCNA, RPA4, RNASEH1, RNASEH2C, MCM4, POLE2, MCM3, MCM6, MCM5, POLA2, FEN1, MCM2, MCM7, POLD1, POLD2, RNASEH2A, POLE, RFC1, RFC3, RFC2 | KEGG hsa03030 |
| Nucleotide excision repair | MNAT1, POLE4, ERCC4, POLE3, ERCC3, ERCC6, ERCC5, GTF2H5, POLD4, ERCC2, RFC4, CETN2, RFC5, GTF2H3, RPA1, RAD23B, RBX1, DDB2, RPA3, POLD3, RPA2, RAD23A, PCNA, RPA4, DDB1, POLE2, ERCC1, POLD1, GTF2H4, POLD2, POLE, RFC1, RFC3, RFC2, XPC, XPA, GTF2H2, GTF2H1, CDK7, LIG1, CUL4A, CUL4B, ERCC8,CCNH | KEGG hsa03420 |
| Mismatch repair | MLH3, POLD1, MLH1, POLD2, RFC1, MSH2, RFC3, RFC2, MSH3, POLD4, PMS2, RFC4, LIG1, SSBP1, RPA4, EXO1, RFC5, RPA1, MSH6, RPA3, POLD3, RPA2, PCNA | KEGG hsa03430 |
2.3. Building a lasso Regression Model
We conducted the univariate analysis of each ECM-receptor interaction-related genes. Then, the genes with P < 0.05 were selected in the establishment of a lasso regression model. The lasso regression model was built by the package “glmnet” of R [10]. According to the lasso model, each patient is assigned a risk score. We defined patients with a risk score ≥ median value in the high-risk group (N = 175); otherwise, in the low-risk group (N = 176).
2.4. Statistical Analyses
We identified differentially expressed genes between tumorous and matched normal tissues in TCGA and validation cohorts by a paired t-test. Consensus clusters were built by the package “ConsensusClusterPlus” of R [11]. We identified a consensus matrix of TCGA for k from 2 to 9. Gene set enrichment analysis (GSEA) was used to analyze the most enriched gene sets of the high- and low-risk groups [12, 13]. Packages “clusterProfiler” [14], “org.Hs.eg.db,” “enrichplot,” and “GO plot” [15] of R were applied to perform GO analyses and visualize the results. The package “GSVA” was applied to get single-sample gene set enrichment analysis (ssGSEA) of relevant signatures [16]. The package “survminer” was used to visualize the survival time of high- and low-risk groups. A P value > 0.05 was considered to indicate a statistically significant difference. All analyses were conducted with R (https://www.r-project.org/). The hazard ratios were shown with 95% confidence interval (95% CI).
3. Results
3.1. Differentially Expressed Genes of an ECM-Receptor Interaction Signature
In TCGA cohort, there were 26 pairs of tumorous and matched normal tissues enrolled in the study. As shown in Figure 1(a) and Supplementary Figure 1, the expressions of 46 ECM-receptor interaction-related genes were significantly different in contrast to adjacent tissues. In an independent cohort with 134 pairs of tumorous and matched normal tissues, 36 genes had the obvious uniformity with the expression changes. The expressions of AGRN, CD47, COL11A1, COL1A2, COL3A1, COL4A1, COL4A2, COL5A1, COL5A2, COL5A3, COL6A3, COMP, DAG1, HMMR, ITGA2, ITGA4, ITGAV, ITGB8, LAMB1, LAMB3, LAMC2, SPP1, THBS2, VWF, and SDC1 were significantly highly expressed in gastric cancer, while 11 genes CD36, CHAD, COL4A6, ITGA8, ITGA9, LAMA2, RELN, SV2C, TNXB, LAMB4, and LAMC3 were downexpressed in tumorous tissues (Figure 1(b) and Supplementary Figure 2).
Figure 1.
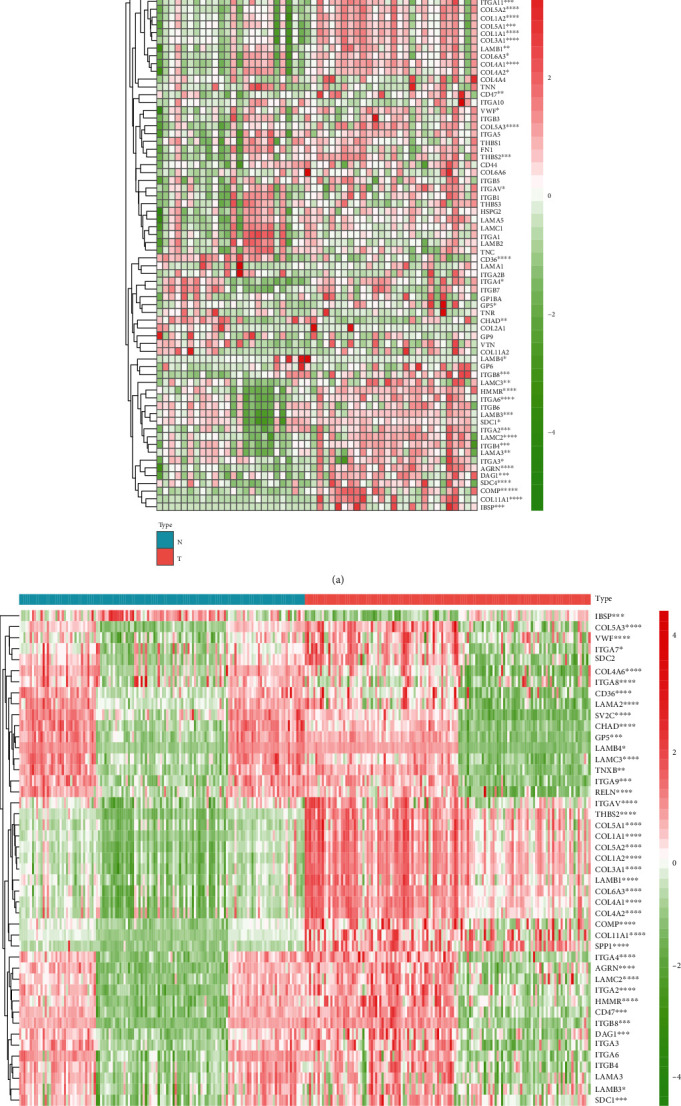
Differential expression of ECM-receptor interaction-related genes between tumor and matched normal tissues in TCGA and validation cohorts of gastric cancer. (a) The heat map showed differential expression of all ECM-receptor interaction-related genes of 26 pairs of tumorous and matched normal tissues of gastric cancer in TCGA. (b) The heat map validated 45 ECM-receptor interaction-related genes that were identified in the validation cohort (GSE29272) with 134 pairs of tumorous and matched normal tissues. TCGA: The Cancer Genome Atlas; N: adjacent tissue to cancer; T: tumorous tissue. ∗P < 0.05, ∗∗P < 0.01, ∗∗∗P < 0.001, and ∗∗∗∗P < 0.0001.
3.2. Building Consensus Clusters and Correlation between Clinicopathologic Features and Clusters
We identified consensus matrixes of TCGA for k from 2 to 9 (Figure 2(a) and Supplementary Figure 3). In consideration of discrimination and simplicity, we chose k = 2 to build consensus clusters. Principal component analysis (PCA) showed that two consensus clusters had a certain degree of differentiation (Figure 2(b)). Patients in cluster 2 (N = 190) had worse outcomes than patients in cluster 1 (N = 185) (P = 0.0032) (Figure 2(c)). Besides, stratified clusters were slightly related to the histologic grade, cancer type, tumor stage, and TNM stage, while presenting no correlation with PIK3CA, KMT2D, PCLO, FAT4, ARID1A, LRP1B, and TP53 mutations (Figures 2(d)–2(f) and Supplementary Table 1).
Figure 2.
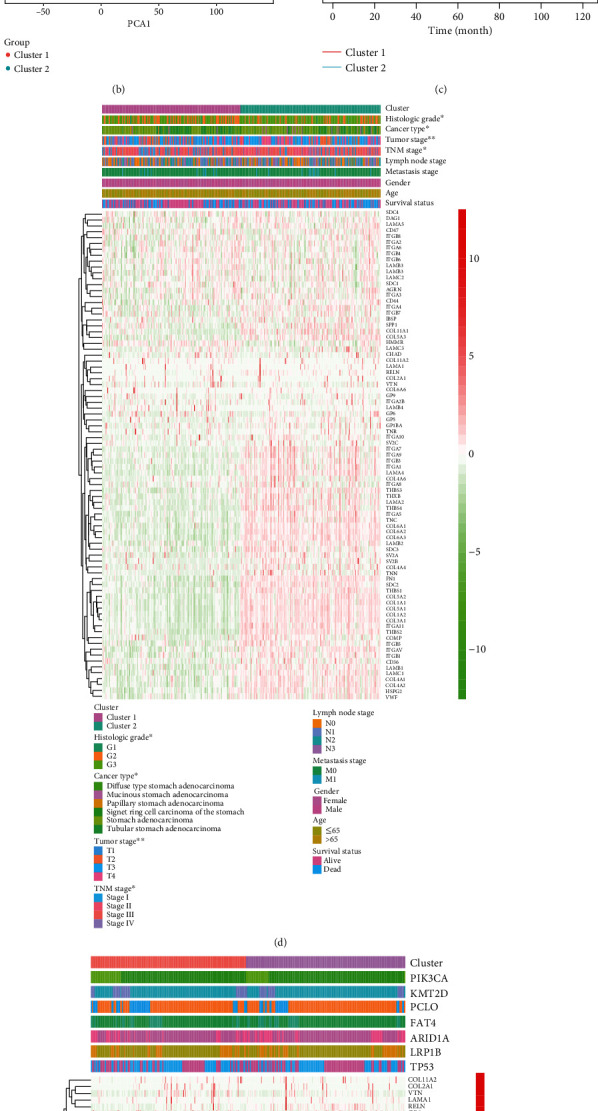
Identification of subclusters stratified by ECM-receptor interaction-related genes and correlation between subclusters and clinicopathologic features. (a) Identification of the consensus matrix of TCGA cohort for k = 2. (b) Principal component analysis of subclusters. (c) Survival curve of subclusters stratified by ECM-receptor interaction-related genes. (d, e) Correlation analyses between tumor characteristics or mutations and the subclusters. ∗P < 0.05, ∗∗P < 0.01.
3.3. Establishment of the lasso Regression Model
To better predict the outcome of gastric cancer patients, we calculated the hazard ratio with 95% confidence interval of all ECM-receptor interaction-related genes and 25 of them with P < 0.05, which were enrolled in the establishment of the lasso regression model (Table 2). Figures 3(a) and 3(b) show the solution paths and partial likelihood deviances of the building process of the lasso regression model. The risk score model = 0.081∗log2 (CD36) + 0.043∗log2 (COL5A2) + 0.001∗log2 (ITGB5) + 0.039∗log2 (SDC2) + 0.135∗log2 (SV2B) + 0.012∗log2 (THBS1) + 0.068∗log2 (VTN) + 0.023∗log2 (VWF) (Figure 3(c)). GSEA showed the top enriched gene sets: protein complex binding, GTPase activity, organ morphogenesis, integrin binding, and regulation of biological quality (Figures 3(d)–3(h)). GO analyses revealed the top enriched biological process (BP), molecular function (MF), and cellular component (CC) (Figure 3(i)). The circular plot showed that 17 genes were highly related to the GO term (Figure 3(j)).
Table 2.
Univariate analysis of the hazard ratio with 95% confidence interval of each gene.
| Gene | Hazard ratio | HR.95%L | HR.95%H | P value | Gene | Hazard ratio | HR.95%L | HR.95%H | P value |
|---|---|---|---|---|---|---|---|---|---|
| AGRN | 0.980 | 0.814 | 1.181 | 0.8352 | ITGA8 | 1.101 | 0.939 | 1.292 | 0.2352 |
| CD36 | 1.344 | 1.133 | 1.595 | 0.0007 | ITGA9 | 1.158 | 0.985 | 1.362 | 0.0753 |
| CD44 | 1.134 | 0.982 | 1.310 | 0.0864 | ITGAV | 1.405 | 1.112 | 1.777 | 0.0044 |
| CD47 | 0.824 | 0.626 | 1.086 | 0.1689 | ITGB1 | 1.192 | 0.941 | 1.510 | 0.1450 |
| CHAD | 0.997 | 0.785 | 1.267 | 0.9793 | ITGB3 | 1.286 | 0.991 | 1.669 | 0.0587 |
| COL11A1 | 1.115 | 0.987 | 1.260 | 0.0795 | ITGB4 | 0.870 | 0.762 | 0.995 | 0.0418 |
| COL11A2 | 0.843 | 0.679 | 1.046 | 0.1212 | ITGB5 | 1.329 | 1.030 | 1.715 | 0.0287 |
| COL1A1 | 1.138 | 1.017 | 1.273 | 0.0243 | ITGB6 | 1.102 | 0.971 | 1.251 | 0.1315 |
| COL1A2 | 1.168 | 1.033 | 1.322 | 0.0135 | ITGB7 | 1.040 | 0.810 | 1.334 | 0.7596 |
| COL2A1 | 1.089 | 0.960 | 1.234 | 0.1850 | ITGB8 | 0.995 | 0.813 | 1.219 | 0.9635 |
| COL3A1 | 1.173 | 1.041 | 1.321 | 0.0087 | LAMA1 | 1.044 | 0.830 | 1.312 | 0.7142 |
| COL4A1 | 1.251 | 1.042 | 1.502 | 0.0164 | LAMA2 | 1.288 | 1.085 | 1.529 | 0.0038 |
| COL4A2 | 1.196 | 1.006 | 1.421 | 0.0427 | LAMA3 | 1.033 | 0.902 | 1.183 | 0.6366 |
| COL4A4 | 1.118 | 0.911 | 1.373 | 0.2860 | LAMA4 | 1.298 | 1.080 | 1.560 | 0.0054 |
| COL4A6 | 1.134 | 0.916 | 1.404 | 0.2471 | LAMA5 | 0.937 | 0.790 | 1.112 | 0.4558 |
| COL5A1 | 1.163 | 1.013 | 1.335 | 0.0319 | LAMB1 | 1.244 | 1.014 | 1.526 | 0.0363 |
| COL5A2 | 1.233 | 1.060 | 1.433 | 0.0065 | LAMB2 | 0.999 | 0.814 | 1.227 | 0.9948 |
| COL5A3 | 1.104 | 0.909 | 1.340 | 0.3173 | LAMB3 | 0.987 | 0.859 | 1.133 | 0.8490 |
| COL6A1 | 1.135 | 0.972 | 1.326 | 0.1091 | LAMB4 | 2.320 | 0.762 | 7.066 | 0.1386 |
| COL6A2 | 1.170 | 1.014 | 1.349 | 0.0312 | LAMC1 | 1.277 | 1.064 | 1.532 | 0.0086 |
| COL6A3 | 1.162 | 1.013 | 1.333 | 0.0319 | LAMC2 | 1.056 | 0.936 | 1.191 | 0.3788 |
| COL6A6 | 1.361 | 0.661 | 2.802 | 0.4030 | LAMC3 | 0.954 | 0.741 | 1.226 | 0.7113 |
| COMP | 1.040 | 0.949 | 1.139 | 0.3989 | RELN | 1.183 | 0.976 | 1.435 | 0.0874 |
| DAG1 | 0.985 | 0.787 | 1.234 | 0.8958 | SDC1 | 0.951 | 0.823 | 1.099 | 0.4968 |
| FN1 | 1.144 | 1.028 | 1.273 | 0.0139 | SDC2 | 1.381 | 1.144 | 1.667 | 0.0008 |
| GP1BA | 1.026 | 0.772 | 1.364 | 0.8576 | SDC3 | 0.904 | 0.740 | 1.103 | 0.3203 |
| GP5 | 1.652 | 0.676 | 4.035 | 0.2708 | SDC4 | 1.068 | 0.903 | 1.265 | 0.4417 |
| GP6 | 1.187 | 0.603 | 2.338 | 0.6198 | SPP1 | 1.047 | 0.962 | 1.139 | 0.2848 |
| GP9 | 1.862 | 0.666 | 5.210 | 0.2362 | SV2A | 1.205 | 0.967 | 1.502 | 0.0962 |
| HMMR | 0.917 | 0.756 | 1.113 | 0.3811 | SV2B | 2.033 | 1.269 | 3.257 | 0.0032 |
| HSPG2 | 1.087 | 0.929 | 1.272 | 0.2990 | SV2C | 1.144 | 0.433 | 3.027 | 0.7859 |
| IBSP | 1.182 | 0.957 | 1.461 | 0.1212 | THBS1 | 1.210 | 1.069 | 1.369 | 0.0025 |
| ITGA1 | 1.193 | 1.001 | 1.421 | 0.0484 | THBS2 | 1.138 | 1.023 | 1.265 | 0.0171 |
| ITGA10 | 1.439 | 0.958 | 2.161 | 0.0792 | THBS3 | 1.220 | 0.936 | 1.590 | 0.1417 |
| ITGA11 | 1.163 | 0.994 | 1.361 | 0.0602 | THBS4 | 1.058 | 0.979 | 1.144 | 0.1515 |
| ITGA2 | 0.989 | 0.837 | 1.168 | 0.8945 | TNC | 1.082 | 0.978 | 1.197 | 0.1245 |
| ITGA2B | 1.801 | 0.666 | 4.876 | 0.2466 | TNN | 1.252 | 1.020 | 1.536 | 0.0314 |
| ITGA3 | 1.069 | 0.900 | 1.270 | 0.4475 | TNR | 1.436 | 0.616 | 3.349 | 0.4024 |
| ITGA4 | 1.175 | 0.953 | 1.449 | 0.1318 | TNXB | 1.102 | 0.964 | 1.261 | 0.1549 |
| ITGA5 | 1.129 | 0.977 | 1.306 | 0.1006 | VTN | 1.134 | 1.041 | 1.235 | 0.0040 |
| ITGA6 | 0.876 | 0.729 | 1.052 | 0.1561 | VWF | 1.285 | 1.085 | 1.521 | 0.0036 |
| ITGA7 | 1.041 | 0.901 | 1.202 | 0.5864 |
Figure 3.
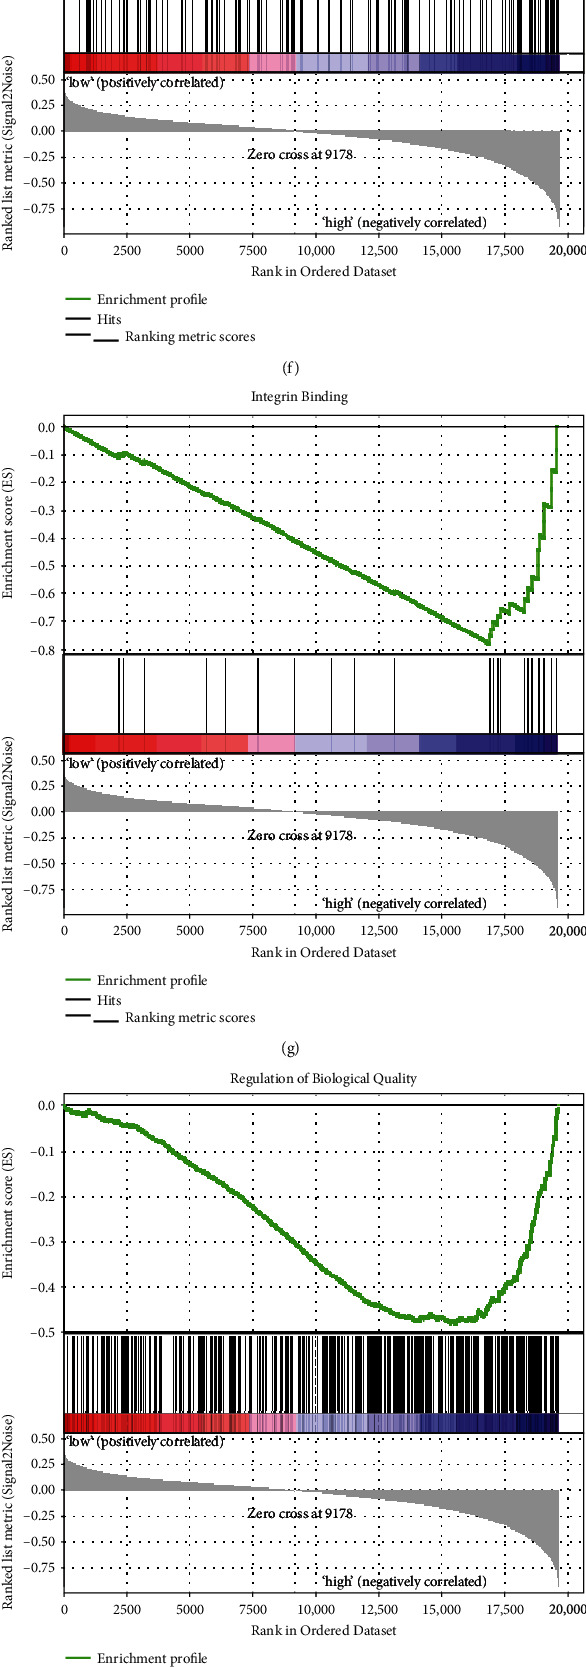
Construction of the lasso regression model with ECM-receptor interaction-related genes and enrichment analyses. (a) The relation between partial likelihood deviances and number of genes involved in the risk model. (b) The solution paths of the risk model. (c) The coefficients of each gene involved in the risk model. (d–h) Top five enriched gene sets between high- and low-risk groups identified by the risk model. (i) The GO analysis between high- and low-risk groups identified by the risk model. (j) Top genes refer to the top BP. GO: BP: biological process; MF: molecular function; CC: cellular component; logFC: log2(fold change).
3.4. Predictive Ability of the Risk Model
In TCGA cohort (n = 351), the risk model could predict the outcome of patients with gastric cancer (HR: 1.807, 95% CI: 1.292-2.528, P = 0.00046), whose reliability and credibility were stronger than those of the consensus clusters (P = 0.032) (Figure 4(a)). Besides, in another independent cohort (GSE62254) (n = 300), the risk model could still provide excellent prediction accuracy (HR: 1.866, 95% CI: 1.347-2.584, P = 0.00014) (Figure 4(c)). The distribution of survival time, risk score, and gene expressions showed that patients in the high-risk group had shorter disease survival time in both TCGA (Figure 4(b)) and validation cohorts (Figure 4(d)).
Figure 4.

Survival analyses and distribution of the risk model in the training and validation cohorts. (a) Survival curve of the high- and low-risk groups identified by the risk model in TCGA cohort. (b) The distribution of survival month, risk score, and gene expression in TCGA cohort. (c) Survival curve of the high- and low-risk groups identified by the risk model in the validation cohort (GSE62254). (d) The distribution of survival month, risk score, and gene expressions in the validation cohort (GSE62254).
3.5. Correlation between Risk Groups and Clinicopathologic Features
To explore the underlying mechanisms of the risk group, we compared relevant signatures in the high- and low-risk groups. As shown in Figure 5(a), we found the signatures angiogenesis, cell adhesion molecules, complement and coagulation cascades, and TGF-beta signaling enriched in the high-risk group, while mismatch repair-relevant signatures base excision repair, DNA replication, nucleotide excision repair, and mismatch repair were not in the group. Furthermore, the risk stratification was highly correlated with the histologic grade (P < 0.01), cancer type (P < 0.01), tumor stage (P < 0.05), and living status (P < 0.01) (Figure 5(b)).
Figure 5.
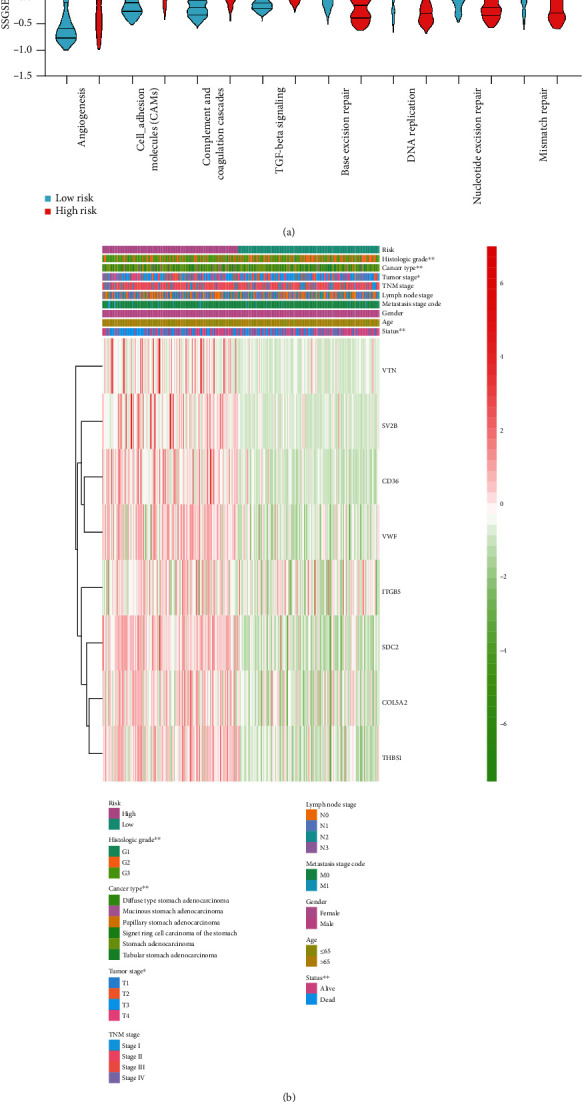
Relevant signatures and clinicopathologic features of the risk groups. (a) The violin plot showed high- and low-risk groups identified by different signatures. Within each group, the middle line represents the mean value of signature genes, and the bottom and top lines represent the 25th and 75th percentiles, respectively. (b) Correlation analyses between tumor characteristics and the risk groups. ∗∗P < 0.01.
3.6. Univariate and Multivariate Analyses of the Risk Score and Clinicopathologic Features
In the univariate analysis, age (1.641, 95% CI: 1.140-2.362, P = 0.008), the lymph node stage (1.318, 95% CI: 1.124-1.545, P < 0.001), the TNM stage (1.535, 95% CI: 1.233-1.910, P < 0.001), the tumor stage (1.277, 95% CI: 1.020-1.601, P = 0.033), and the risk score (1.845, 95% CI: 1.382-2.462, P < 0.001) were risk factors for gastric cancer (Figure 6(a)). In the multivariate analysis, age (1.951, 95% CI: 1.337-2.849, P < 0.001) and the risk score (1.756, 95% CI: 1.284-2.402, P < 0.001) were the main risk factors for gastric cancer (Figure 6(b)).
Figure 6.
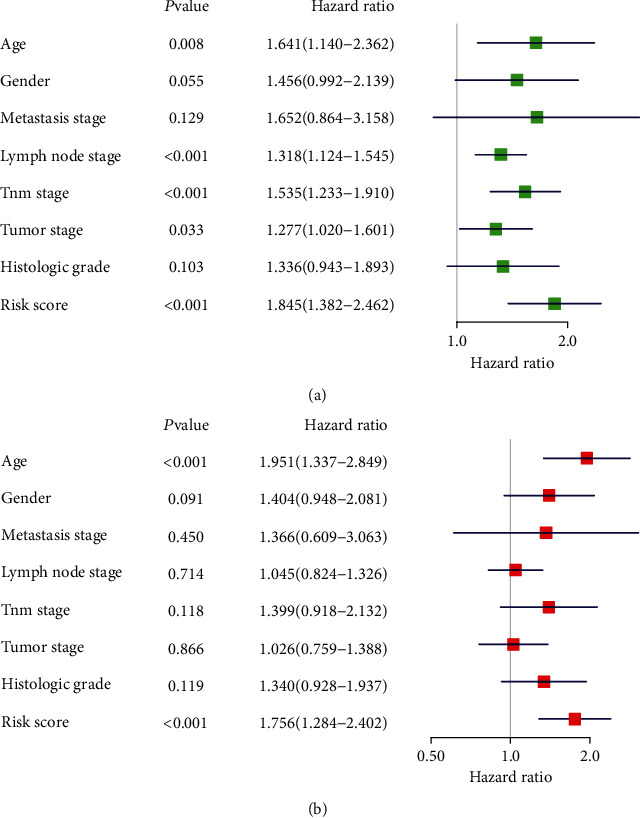
The forest plot of clinicopathologic features and the risk score. (a) Univariate analysis of clinicopathologic features and the risk score in TCGA cohort. (b) Multivariate analysis of clinicopathologic features and the risk score in TCGA cohort. Hazard ratios are shown with 95% confidence interval.
4. Discussion
Gastric cancer is characterized by insidious onset, easy metastasis, early misdiagnosis, and high recurrence rate [17]. Due to the lack of a simple domestic screening system, most patients with gastric cancer are in the late stage when first diagnosed, greatly influencing their clinical therapeutic effect and survival quality [18]. Within this context, tumor markers, in the field of biochemistry, have received increasing attention for their characters such as noninvasive, safe, simple, inexpensive, and easy to monitor dynamically [19]. For gastric cancer, many tumor markers have been detected from the perspective of genetic traits or genetic modification. In this study, we revealed that in gastric cancer, many ECM-relevant molecules also were effective tumor markers, possessing an important value in clinical application.
In previous research, ECM-relevant molecules have been identified as progression and prognostic biomarkers in some other solid tumors that were used for impacting clinical decisions and overall outcomes. For example, in colon adenocarcinoma (CAC), COL1A2, THBS2, and COL1A1 were related to prognosis [20]. In addition, it was found that the level of ITGA5 in CAC was significantly linked to overall survival (OS), which might serve as an independent prognostic indicator [21]. In neuroblastoma, it has been revealed that there existed an association between SDC3 expression and improved prognosis [22]. Additionally, the high expression level of SDC3 was also associated with poor prognosis in patients with renal cell carcinoma [23]. For lung cancer, COL5A1 was highly expressed in patients with recurrence and short survival [24]. SSP1 was upregulated in tumor tissues, and low expression of SSP1 had a significant relationship with the better outcome [25]. Moreover, according to the reported references, FN1 likely represented a signature biomarker for lung cancer in the prediction of responses to treatments [26]. In contrast to these cancer types that we have discussed, ECM-receptor interaction-relevant genes have been poorly studied as progressive and prognostic biomarkers in gastric cancer. Through the KEGG database, we systematically examined 84 ECM-receptor interaction-relevant genes in this study and found that most of them were differentially expressed in gastric cancer tissues. On the basis of these genes, we divided patients into two subclusters. As we had expected, the subclusters exhibited good prognostic performance (P = 0.032). For better prediction of survival with ECM-receptor interaction-relevant genes, lasso regression analysis was then conducted. Thereinto, we found that eight significant genes (VTN, SV2B, CD36, VWF, ITGB5, SDC2, COL5A2, and THBS1) were related to ECM-receptor interaction and an eight-gene risk score model was constructed based on them. The risk score model had its favorable performance in predicting prognosis of gastric cancer. The eight genes may be potential prognostic markers for gastric cancer.
In a variety of tumors, such as cervix neoplasia [27], ovarian cancer [28], and prostate cancer [29], VTN was considered a promising biomarker, which encoded vitronectin, an adhesive glycoprotein that connected cells with ECM. Recently, a report also revealed that VTN was a poor prognostic factor in gastric cancer [30]. Likewise, VWF, encoding von Willebrand factor that is a platelet adhesion glycoprotein, has been widely used as a biomarker in cancer, and it also has been identified as a new therapeutic target in gastric cancer [31]. As for THBS1, encoding thrombospondin 1, it took part in angiogenesis and tumor progression, whose increased expression was significantly correlated with tumor differentiation [32]. COL5A1, encoding an alpha chain of type V collagen, was a promising prognostic marker considered to have a good potential for the treatment of patients with gastric cancer as well [33]. The expression of CD36 was reported in relation to gastric cancer metastasis via O-GlcNAcylation [34]. However, the current literature mostly explores the role of one gene in gastric cancer and rarely links them to explore the combined effect on the gastric cancer treatment. Besides, ITGB5, encoding integrin-β5, was thought to be involved in the regulation of tumor initiation and progression by mediating links between cells and ECM. The literature reported in glioblastoma [35], hepatocellular carcinoma [36], and cervical cancer [37] that ITGB5 could serve as a predictive biomarker. In ITGB5, the gene expression analysis identified that its expression was elevated in gastric tumor tissue [38]. Nevertheless, the function of ITGB5 in gastric cancer is not yet fully elucidated. As for SV2B and SDC2, encoding a member of the synaptic vesicle protein 2 and syndecan 2, respectively, both of them have not been fully studied in gastric cancer. SV2B was identified as a key prognosis-associated marker in glioblastoma multiforme and prostate cancer [39, 40]. In spite of this, the study of SV2B in tumors is still limited. Relatively speaking, SDC2 has been well studied in various tumors, especially in colorectal cancer, lung cancer, prostate cancer, and esophageal squamous cell carcinoma [41–45]. According to the discussion above, we considered that SV2B and SDC2 deserved to be further studied in gastric cancer. The disruption in ECM organization lost its regularity, which will compromise gastric cancer foci. ECM compositions became accomplices in the tumorigenesis, progression, and poor survival of gastric cancer. The aberrant ECM signature should be simultaneously inhibited in the treatment of gastric cancer [46].
We further investigated the possible mechanisms underlying the differences between low- and high-risk groups. It was found that there existed a significant difference in angiogenesis between the two groups. As you know, it has been suggested that angiogenesis provided nutrients for tumor growth and pathways for cell metastasis [47]. Consistent with our research, the angiogenesis signature was upregulated in the high-risk group. Besides, the angiogenesis depends on migration and proliferation of vascular endothelial cells [48]. In this process, endothelial cells must attach to each other and to the extracellular matrix to form and expand new microvessels. ECM is one of the critical influencers in the survival of vascular endothelial cells [49]. Thus, we speculated that these differentially expressed genes could promote the formation of tumor blood vessels and further affect the development and prognosis of tumors. Moreover, cell adhesion molecules presented as one of the main media between cells and ECM. The changes of cell adhesion molecules could affect multiple signaling pathways, thereby affecting the pathophysiology of cancer tissues [50]. In addition to possible changes in angiogenesis and cell adhesion molecules, complement and coagulation cascades were also affected in gastric cancer, which might participate in tumor progression and prognosis. Increasing evidence has indicated that complement and coagulation cascades were significantly involved in the signaling pathway in gallbladder cancer [51], clear cell renal cell carcinoma [52], small-cell lung cancer [53], epithelial ovarian cancer [54], bladder cancer [55], and head and neck cancer [56]. In gastric cancer, Gu et al. once pointed that complement and coagulation cascades were significantly enriched pathways [57]. However, the research about it in gastric cancer is insufficient, and there is no direct evidence to clarify that the upregulation of this pathway connects with the prognosis of gastric cancer. From the results in this study, we also found that TGF-β signaling pathway is upregulated in gastric cancer, which was in line with the results of existing research. The dysregulated pathway could promote the generation of ECM [58], leading to tissue fibrosis. An overactivated TGF-β signaling pathway could induce tumor growth and metastasis by promoting epithelial-mesenchymal transformation and angiogenesis [59]. Of course, the results indicated that we could further research the relationship between the eight significant genes and TGF-β.
Furthermore, the downregulation of base excision repair and nucleotide excision repair signatures in the high-risk group was consistent with the current research in gastric cancer. Particularly, DNA mismatch repair is one of the most prevalent pathways involved in a damaged base excision repair system. Absence of base excision repair could result in the accumulation of DNA damage, leading to cancer malignant transformations and poor prognosis. This imbalance was also associated with DNA polymorphism regulation, and such uncorrected false DNA variant likely had relation to cancer risk [60]. The defects in nucleotide excision repair would lead to the increased instability of the genome. Besides, unrepaired DNA damage possibly increased genetic susceptibility to cancers and risk of carcinogenesis [61]. Thus, according to the mentioned results above, the association between the excision repair and eight significant genes deserved to be further explored.
Recent research suggested that the impact of age as an independent risk factor on gastric cancer may differ depending on the cancer stage [62]. Although the finding of age as an independent risk factor in this study had a certain particular value, large-scale clinical data is urgently needed to verify and thus to direct the establishment of a clinical treating scheme. We identified a risk score model to predict prognosis of patients with gastric cancer and validate it in an independent cohort. For the simple and convenient assessment, we could choose it to provide some references. However, we need to acknowledge that the risk score is a relative value, which varies in different institutes and different detection methods. After unifying the testing methods, we need to collect as many samples as possible to identify the cut-off value to guide the oncologists.
5. Conclusions
In conclusion, we produced comprehensive analyses to investigate the vital role of an ECM-receptor interaction signature in gastric cancer. ECM compositions became accomplices in the tumorigenesis, progression, and poor survival of gastric cancer.
Acknowledgments
We are very grateful to TCGA database. We appreciate Chen Yang's help in bioinformatics. This work was supported by the Wenzhou Science and Technology Project (grant number 2019Y0216).
Abbreviations
- ECM:
Extracellular matrix
- TCGA:
The Cancer Genome Atlas
- lasso:
Least absolute shrinkage and selection operator method
- STAD:
Stomach adenocarcinoma
- FPKM:
Fragments per kilobase million
- KEGG:
Kyoto Encyclopedia of Genes and Genomes
- CAMs:
Cell adhesion molecules
- GSEA:
Gene set enrichment analysis
- ssGSEA:
Single-sample gene set enrichment analysis
- CAC:
Colon adenocarcinoma
- OS:
Overall survival
- BP:
Biological process
- MF:
Molecular function
- CC:
Cellular component
- HR:
Hazard ratios
- 95% CI:
95% confidence interval
- logFC:
log2(fold change)
- PCA:
Principal component analysis.
Data Availability
The datasets used and/or analyzed during the current study are available from the corresponding author on reasonable request.
Conflicts of Interest
The authors have no conflicts of interest to declare.
Authors' Contributions
X. Yang and M. He searched the literature and designed the study. L. Chen collected the data. X. Yang and Y. Mao performed the data analyses. X. Yang and L. Chen were in charge of the validation cohort analyses. Z. Hu and M. He processed the figures. All authors participated in manuscript writing. All authors read and approved the final manuscript. Xiangchou Yang and Liping Chen contributed equally to this work.
Supplementary Materials
Supplementary Figure 1: paired t-test of ECM-receptor interaction-related genes with statistical difference of gastric cancer in the training cohort (TCGA). Supplementary Figure 2: paired t-test of ECM-receptor interaction-related genes in the validation cohort (GSE29272). Supplementary Figure 3: consensus matrixes of the training cohort for k from 3 to 9. Supplementary Table 1: patients' clinical characteristics and their cluster classification.
References
- 1.Torre L. A., Bray F., Siegel R. L., Ferlay J., Lortet-Tieulent J., Jemal A. Global cancer statistics, 2012. CA: a Cancer Journal for Clinicians. 2015;65(2):87–108. doi: 10.3322/caac.21262. [DOI] [PubMed] [Google Scholar]
- 2.Bray F., Ferlay J., Soerjomataram I., Siegel R. L., Torre L. A., Jemal A. Global cancer statistics 2018: GLOBOCAN estimates of incidence and mortality worldwide for 36 cancers in 185 countries. CA: a Cancer Journal for Clinicians. 2018;68(6):394–424. doi: 10.3322/caac.21492. [DOI] [PubMed] [Google Scholar]
- 3.Egeblad M., Rasch M. G., Weaver V. M. Dynamic interplay between the collagen scaffold and tumor evolution. Current Opinion in Cell Biology. 2010;22(5):697–706. doi: 10.1016/j.ceb.2010.08.015. [DOI] [PMC free article] [PubMed] [Google Scholar]
- 4.Kessenbrock K., Plaks V., Werb Z. Matrix metalloproteinases: regulators of the tumor microenvironment. Cell. 2010;141(1):52–67. doi: 10.1016/j.cell.2010.03.015. [DOI] [PMC free article] [PubMed] [Google Scholar]
- 5.Schedin P., Keely P. J. Mammary Gland ECM Remodeling, Stiffness, and Mechanosignaling in Normal Development and Tumor Progression. Cold Spring Harbor Perspectives in Biology. 2011;3(1):p. a003228. doi: 10.1101/cshperspect.a003228. [DOI] [PMC free article] [PubMed] [Google Scholar]
- 6.Goldman M. J., Craft B., Hastie M., et al. Visualizing and interpreting cancer genomics data via the Xena platform. Nature Biotechnology. 2020;38(6):675–678. doi: 10.1038/s41587-020-0546-8. [DOI] [PMC free article] [PubMed] [Google Scholar]
- 7.Wang G., Hu N., Yang H. H., et al. Comparison of global gene expression of gastric cardia and noncardia cancers from a high-risk population in China. PLoS One. 2013;8(5) doi: 10.1371/journal.pone.0063826. [DOI] [PMC free article] [PubMed] [Google Scholar]
- 8.Cristescu R., Lee J., Nebozhyn M., et al. Molecular analysis of gastric cancer identifies subtypes associated with distinct clinical outcomes. Nature Medicine. 2015;21(5):449–456. doi: 10.1038/nm.3850. [DOI] [PubMed] [Google Scholar]
- 9.Kanehisa M. Post-genome informatics. Oxford: Oxford University Press; 2000. [Google Scholar]
- 10.Tibshirani R., Bien J., Friedman J., et al. Strong rules for discarding predictors in lasso-type problems. J R Stat Soc Series B Stat Methodol. 2012;74(2):245–266. doi: 10.1111/j.1467-9868.2011.01004.x. [DOI] [PMC free article] [PubMed] [Google Scholar]
- 11.Wilkerson M. D., Hayes D. N. ConsensusClusterPlus: a class discovery tool with confidence assessments and item tracking. Bioinformatics. 2010;26(12):1572–1573. doi: 10.1093/bioinformatics/btq170. [DOI] [PMC free article] [PubMed] [Google Scholar]
- 12.Subramanian A., Tamayo P., Mootha V. K., et al. Gene set enrichment analysis: a knowledge-based approach for interpreting genome-wide expression profiles. Proc Natl Acad Sci USA. 2005;102(43):15545–15550. doi: 10.1073/pnas.0506580102. [DOI] [PMC free article] [PubMed] [Google Scholar]
- 13.Mootha V. K., Lindgren C. M., Eriksson K. F., et al. PGC-1alpha-responsive genes involved in oxidative phosphorylation are coordinately downregulated in human diabetes. Nature Genetics. 2003;34(3):267–273. doi: 10.1038/ng1180. [DOI] [PubMed] [Google Scholar]
- 14.Yu G., Wang L. G., Han Y., He Q. Y. clusterProfiler: an R package for comparing biological themes among gene clusters. OMICS: A Journal of Integrative Biology. 2012;16(5):284–287. doi: 10.1089/omi.2011.0118. [DOI] [PMC free article] [PubMed] [Google Scholar]
- 15.Walter W., Sánchez-Cabo F., Ricote M. GOplot: an R package for visually combining expression data with functional analysis. Bioinformatics. 2015;31(17):2912–2914. doi: 10.1093/bioinformatics/btv300. [DOI] [PubMed] [Google Scholar]
- 16.Hänzelmann S., Castelo R., Guinney J. GSVA: gene set variation analysis for microarray and RNA-seq data. BMC Bioinformatics. 2013;14(1):p. 7. doi: 10.1186/1471-2105-14-7. [DOI] [PMC free article] [PubMed] [Google Scholar]
- 17.Jemal A., Bray F., Center M. M., Ferlay J., Ward E., Forman D. Global cancer statistics. CA: a Cancer Journal for Clinicians. 2011;61(2):69–90. doi: 10.3322/caac.20107. [DOI] [PubMed] [Google Scholar]
- 18.Deng J., Liang H., Wang D., Sun D., Pan Y., Liu Y. Investigation of the recurrence patterns of gastric cancer following a curative resection. Surgery Today. 2011;41(2):210–215. doi: 10.1007/s00595-009-4251-y. [DOI] [PubMed] [Google Scholar]
- 19.Wang X., Zhi Q., Liu S., et al. Identification of specific biomarkers for gastric adenocarcinoma by ITRAQ proteomic approach. Scientific Reports. 2016;6(1) doi: 10.1038/srep38871. [DOI] [PMC free article] [PubMed] [Google Scholar]
- 20.Wei S., Chen J., Huang Y., et al. Identification of hub genes and construction of transcriptional regulatory network for the progression of colon adenocarcinoma hub genes and TF regulatory network of colon adenocarcinoma. Journal of Cellular Physiology. 2020;235(3):2037–2048. doi: 10.1002/jcp.29067. [DOI] [PMC free article] [PubMed] [Google Scholar]
- 21.Gong Y. Z., Ruan G. T., Liao X. W., et al. Diagnostic and prognostic values of integrin α subfamily mRNA expression in colon adenocarcinoma. Oncology Reports. 2019;42(3):923–936. doi: 10.3892/or.2019.7216. [DOI] [PMC free article] [PubMed] [Google Scholar]
- 22.Knelson E. H., Gaviglio A. L., Nee J. C., et al. Stromal heparan sulfate differentiates neuroblasts to suppress neuroblastoma growth. The Journal of Clinical Investigation. 2014;124(7):3016–3031. doi: 10.1172/JCI74270. [DOI] [PMC free article] [PubMed] [Google Scholar]
- 23.Yamada Y., Arai T., Kojima S., et al. Regulation of antitumor miR‐144‐5p targets oncogenes: direct regulation of syndecan-3 and its clinical significance. Cancer Science. 2018;109(9):2919–2936. doi: 10.1111/cas.13722. [DOI] [PMC free article] [PubMed] [Google Scholar]
- 24.Liu W., Wei H., Gao Z., et al. COL5A1 may contribute the metastasis of lung adenocarcinoma. Gene. 2018;665:57–66. doi: 10.1016/j.gene.2018.04.066. [DOI] [PubMed] [Google Scholar]
- 25.Wang X., Zhang F., Yang X., et al. Secreted phosphoprotein 1 (SPP1) contributes to second-generation EGFR tyrosine kinase inhibitor resistance in non-small cell lung cancer. Oncology Research. 2019;27(8):871–877. doi: 10.3727/096504018X15426271404407. [DOI] [PMC free article] [PubMed] [Google Scholar]
- 26.Srivastava M., Khurana P., Sugadev R. Lung cancer signature biomarkers: tissue specific semantic similarity based clustering of digital differential display (DDD) data. BMC Research Notes. 2012;5(1):p. 617. doi: 10.1186/1756-0500-5-617. [DOI] [PMC free article] [PubMed] [Google Scholar]
- 27.Starodubtseva N. L., Brzhozovskiy A. G., Bugrova A. E., et al. Label-free cervicovaginal fluid proteome profiling reflects the cervix neoplastic transformation. Journal of Mass Spectrometry. 2019;54(8):693–703. doi: 10.1002/jms.4374. [DOI] [PubMed] [Google Scholar]
- 28.Chang P. Y., Liao Y. P., Wang H. C., et al. An epigenetic signature of adhesion molecules predicts poor prognosis of ovarian cancer patients. Oncotarget. 2017;8(32):53432–53449. doi: 10.18632/oncotarget.18515. [DOI] [PMC free article] [PubMed] [Google Scholar]
- 29.Niu Y., Zhang L., Bi X., Yuan S., Chen P. Evaluation of vitronectin expression in prostate cancer and the clinical significance of the association of vitronectin expression with prostate specific antigen in detecting prostate cancer. Urology Journal. 2016;13(1):2527–2532. [PubMed] [Google Scholar]
- 30.Lian L., Li X. L., Xu M. D., et al. VEGFR2 promotes tumorigenesis and metastasis in a pro-angiogenic-independent way in gastric cancer. BMC Cancer. 2019;19(1):p. 183. doi: 10.1186/s12885-019-5322-0. [DOI] [PMC free article] [PubMed] [Google Scholar]
- 31.Yang A. J., Wang M., Wang Y., et al. Cancer cell-derived von Willebrand factor enhanced metastasis of gastric adenocarcinoma. Oncogene. 2018;7(1):p. 12. doi: 10.1038/s41389-017-0023-5. [DOI] [PMC free article] [PubMed] [Google Scholar]
- 32.Hong B. B., Chen S. Q., Qi Y. L., Zhu J. W., Lin J. Y. Association of THBS1 rs1478605 T>C in 5′-untranslated regions with the development and progression of gastric cancer. Biomed Rep. 2015;3(2):207–214. doi: 10.3892/br.2015.414. [DOI] [PMC free article] [PubMed] [Google Scholar]
- 33.Sun H. Identification of key genes associated with gastric cancer based on DNA microarray data. Oncology Letters. 2016;11(1):525–530. doi: 10.3892/ol.2015.3929. [DOI] [PMC free article] [PubMed] [Google Scholar]
- 34.Jiang M., Wu N., Xu B., et al. Fatty acid-induced CD36 expression via O-GlcNAcylation drives gastric cancer metastasis. Theranostics. 2019;9(18):5359–5373. doi: 10.7150/thno.34024. [DOI] [PMC free article] [PubMed] [Google Scholar]
- 35.Zhang L. Y., Guo Q., Guan G. F., Cheng W., Cheng P., Wu A. H. Integrin beta 5 is a prognostic biomarker and potential therapeutic target in glioblastoma. Frontiers in Oncology. 2019;9:p. 904. doi: 10.3389/fonc.2019.00904. [DOI] [PMC free article] [PubMed] [Google Scholar]
- 36.Lin Z., He R., Luo H., et al. Integrin-β5, a miR-185-targeted gene, promotes hepatocellular carcinoma tumorigenesis by regulating β-catenin stability. Journal of Experimental & Clinical Cancer Research. 2018;37(1):p. 17. doi: 10.1186/s13046-018-0691-9. [DOI] [PMC free article] [PubMed] [Google Scholar] [Retracted]
- 37.Wang S., Xie J., Li J., Liu F., Wu X., Wang Z. Cisplatin suppresses the growth and proliferation of breast and cervical cancer cell lines by inhibiting integrin β5-mediated glycolysis. American Journal of Cancer Research. 2016;6(5):1108–1117. [PMC free article] [PubMed] [Google Scholar]
- 38.Claerhout S., Lim J. Y., Choi W., et al. Gene expression signature analysis identifies vorinostat as a candidate therapy for gastric cancer. PLoS One. 2011;6(9) doi: 10.1371/journal.pone.0024662. [DOI] [PMC free article] [PubMed] [Google Scholar]
- 39.Wang H., Liu D., Yang J. Prognostic risk model construction and molecular marker identification in glioblastoma multiforme based on mRNA/microRNA/long non-coding RNA analysis using random survival forest method. Neoplasma. 2019;66(3):459–469. doi: 10.4149/neo_2018_181008N746. [DOI] [PubMed] [Google Scholar]
- 40.Clegg N., Ferguson C., True L. D., et al. Molecular characterization of prostatic small-cell neuroendocrine carcinoma. The Prostate. 2003;55(1):55–64. doi: 10.1002/pros.10217. [DOI] [PubMed] [Google Scholar]
- 41.Hua R., Yu J., Yan X., et al. Syndecan-2 in colorectal cancer plays oncogenic role via epithelial-mesenchymal transition and MAPK pathway. Biomedicine & Pharmacotherapy. 2020;121:p. 109630. doi: 10.1016/j.biopha.2019.109630. [DOI] [PubMed] [Google Scholar]
- 42.Oh T. J., Oh H. I., Seo Y. Y., et al. Feasibility of quantifying SDC2 methylation in stool DNA for early detection of colorectal cancer. Clinical Epigenetics. 2017;9(1) doi: 10.1186/s13148-017-0426-3. [DOI] [PMC free article] [PubMed] [Google Scholar]
- 43.Tsoyi K., Osorio J. C., Chu S. G., et al. Lung Adenocarcinoma Syndecan-2 Potentiates Cell Invasiveness. American Journal of Respiratory Cell and Molecular Biology. 2019;60(6):659–666. doi: 10.1165/rcmb.2018-0118oc. [DOI] [PMC free article] [PubMed] [Google Scholar]
- 44.Popović A., Demirović A., Spajić B., Stimac G., Kruslin B., Tomas D. Expression and prognostic role of syndecan-2 in prostate cancer. Prostate Cancer and Prostatic Diseases. 2010;13(1):78–82. doi: 10.1038/pcan.2009.43. [DOI] [PubMed] [Google Scholar]
- 45.Huang X., Xiao D. W., Xu L. Y., et al. Prognostic significance of altered expression of SDC2 and CYR61 in esophageal squamous cell carcinoma. Oncology Reports. 2009;21(4):1123–1129. doi: 10.3892/or_00000332. [DOI] [PubMed] [Google Scholar]
- 46.Moreira A. M., Pereira J., Melo S., et al. The Extracellular Matrix: An Accomplice in Gastric Cancer Development and Progression. Cells. 2020;9(2):p. 394. doi: 10.3390/cells9020394. [DOI] [PMC free article] [PubMed] [Google Scholar]
- 47.Katagiri K., Hattori M., Minato N., Irie S.-k., Takatsu K., Kinashi T. Rap1 Is a Potent Activation Signal for Leukocyte Function-Associated Antigen 1 Distinct from Protein Kinase C and Phosphatidylinositol-3-OH Kinase. Molecular and Cellular Biology. 2000;20(6):1956–1969. doi: 10.1128/mcb.20.6.1956-1969.2000. [DOI] [PMC free article] [PubMed] [Google Scholar]
- 48.Shahneh F. Z., Baradaran B., Zamani F., Aghebati-Maleki L. Tumor angiogenesis and anti-angiogenic therapies. Human Antibodies. 2013;22(1-2):15–19. doi: 10.3233/HAB-130267. [DOI] [PubMed] [Google Scholar]
- 49.Varner J. A., Cheresh D. A. Integrins and cancer. Current Opinion in Cell Biology. 1996;8(5):724–730. doi: 10.1016/S0955-0674(96)80115-3. [DOI] [PubMed] [Google Scholar]
- 50.Deville S. S., Cordes N. The extracellular, cellular, and nuclear stiffness, a trinity in the cancer resistome-a review. Frontiers in Oncology. 2019;9:p. 1376. doi: 10.3389/fonc.2019.01376. [DOI] [PMC free article] [PubMed] [Google Scholar]
- 51.Kong L., Wu Q., Zhao L., Ye J., Li N., Yang H. Identification of messenger and long noncoding RNAs associated with gallbladder cancer via gene expression profile analysis. Journal of Cellular Biochemistry. 2019;120(12):19377–19387. doi: 10.1002/jcb.28953. [DOI] [PubMed] [Google Scholar]
- 52.Yang H., Li W., Lv Y., et al. Exploring the mechanism of clear cell renal cell carcinoma metastasis and key genes based on multi-tool joint analysis. Gene. 2019;720:p. 144103. doi: 10.1016/j.gene.2019.144103. [DOI] [PubMed] [Google Scholar]
- 53.Liao Y., Yin G., Wang X., Zhong P., Fan X., Huang C. Identification of candidate genes associated with the pathogenesis of small cell lung cancer via integrated bioinformatics analysis. Oncology Letters. 2019;18(4):3723–3733. doi: 10.3892/ol.2019.10685. [DOI] [PMC free article] [PubMed] [Google Scholar]
- 54.Zhang W., Peng P., Ou X., Shen K., Wu X. Ovarian cancer circulating extracelluar vesicles promote coagulation and have a potential in diagnosis: an iTRAQ based proteomic analysis. BMC Cancer. 2019;19(1):p. 1095. doi: 10.1186/s12885-019-6176-1. [DOI] [PMC free article] [PubMed] [Google Scholar]
- 55.Liu Y., Xiong S., Liu S., et al. Analysis of gene expression in bladder cancer: possible involvement of mitosis and complement and coagulation cascades signaling pathway. Journal of Computational Biology. 2020;27(6):987–998. doi: 10.1089/cmb.2019.0237. [DOI] [PubMed] [Google Scholar]
- 56.Chen F., Zheng A., Li F., Wen S., Chen S., Tao Z. Screening and identification of potential target genes in head and neck cancer using bioinformatics analysis. Oncology Letters. 2019;18(3):2955–2966. doi: 10.3892/ol.2019.10616. [DOI] [PMC free article] [PubMed] [Google Scholar]
- 57.Gu J., Li Y., Fan L., et al. Identification of aberrantly expressed long non-coding RNAs in stomach adenocarcinoma. Oncotarget. 2017;8(30):49201–49216. doi: 10.18632/oncotarget.17329. [DOI] [PMC free article] [PubMed] [Google Scholar]
- 58.Tenti P., Vannucci L. Lysyl oxidases: linking structures and immunity in the tumor microenvironment. Cancer Immunology, Immunotherapy. 2020;69(2):223–235. doi: 10.1007/s00262-019-02404-x. [DOI] [PMC free article] [PubMed] [Google Scholar]
- 59.Dituri F., Mancarella S., Cigliano A., Chieti A., Giannelli G. TGF-β as multifaceted orchestrator in HCC progression: signaling, EMT, immune microenvironment, and novel therapeutic perspectives. Seminars in Liver Disease. 2019;39(1):53–69. doi: 10.1055/s-0038-1676121. [DOI] [PubMed] [Google Scholar]
- 60.Ni F., Tang H., Wang C., et al. Berzosertib (VE-822) inhibits gastric cancer cell proliferation via base excision repair system. Cancer Management and Research. 2019;Volume 11:8391–8405. doi: 10.2147/CMAR.S217375. [DOI] [PMC free article] [PubMed] [Google Scholar]
- 61.Liu J., He C., Xing C., Yuan Y. Nucleotide excision repair related gene polymorphisms and genetic susceptibility, chemotherapeutic sensitivity and prognosis of gastric cancer. Mutation Research. 2014;765:11–21. doi: 10.1016/j.mrfmmm.2014.04.008. [DOI] [PubMed] [Google Scholar]
- 62.Lee J. G., Kim S. A., Eun C. S., et al. Impact of age on stage-specific mortality in patients with gastric cancer: a long-term prospective cohort study. PLoS One. 2019;14(8) doi: 10.1371/journal.pone.0220660. [DOI] [PMC free article] [PubMed] [Google Scholar]
Associated Data
This section collects any data citations, data availability statements, or supplementary materials included in this article.
Supplementary Materials
Supplementary Figure 1: paired t-test of ECM-receptor interaction-related genes with statistical difference of gastric cancer in the training cohort (TCGA). Supplementary Figure 2: paired t-test of ECM-receptor interaction-related genes in the validation cohort (GSE29272). Supplementary Figure 3: consensus matrixes of the training cohort for k from 3 to 9. Supplementary Table 1: patients' clinical characteristics and their cluster classification.
Data Availability Statement
The datasets used and/or analyzed during the current study are available from the corresponding author on reasonable request.