

Abstract
Islet β cell death has been proved to contribute to diabetes. Studies suggest that the activation of nuclear factor κB (NF-κB)-inducing kinase (NIK) is involved in the β cell dysfunction encountered in obesity. However, the pathological significance of NIK activation in diabetes remains largely unknown. Here, we report that β cell-specific overexpression of NIK (β-NIK-OE) results in spontaneous diabetes in male mice at a young age (≥10 weeks of age), which is likely due to insulin deficiency, β cell death, and insulitis. Importantly, inhibiting the kinase activation of NIK by the small molecule B022 prevents NIK- or H2O2-induced β cell death and also reduces streptozotocin (STZ)-induced β cell death while ameliorating hyperglycemia, suggesting that the kinase activity of NIK is essential in inducing islet inflammation, β cell death, and diabetes. In all, this study not only uncovers a role of NIK in β cell failure but also provides a potential therapeutic target for the treatment of diabetes.
Keywords: islet β cells, NF-κB-inducing kinase, inflammation, diabetes, insulin secretion
Graphical Abstract
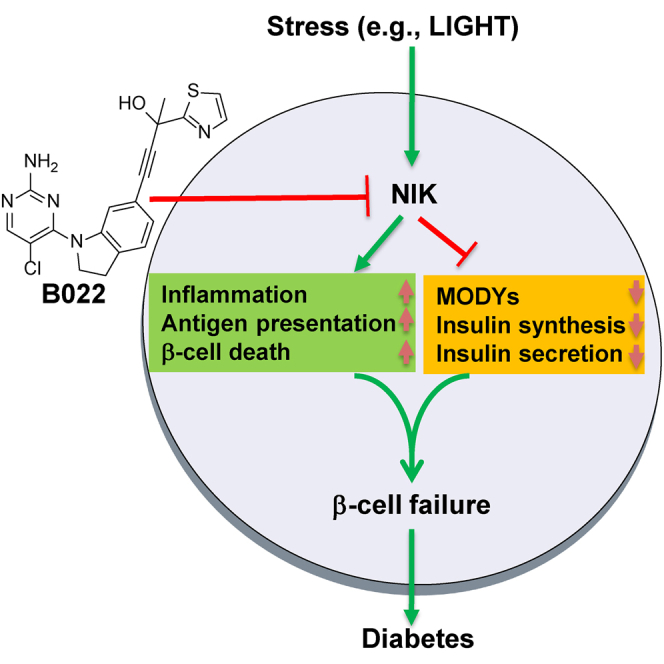
Chen and colleagues demonstrated that NIK plays a key role in the development of diabetes. β cell-specific NIK-overexpressing mice display spontaneous diabetes. Inhibiting NIK activity by the small molecule ameliorates streptozotocin-induced β cell failure, which suggests that inhibition of NIK activity is a potential strategy to ameliorate β cell failure in diabetes.
Introduction
Islet β cell dysfunction causes both type 1 and type 2 diabetes. Inflammation plays a key role in islet β cell dysfunction. The canonical nuclear factor κB (NF-κB) signaling pathway has been well studied in the regulation of islet inflammation in both type 1 and type 2 diabetes.1,2 Recent studies suggest that the non-canonical NF-κB signaling pathway plays an important role in islet β cell dysfunction in obesity.3 However, the role of the non-canonical NF-κB signaling pathway in the regulation of islet β cell failure in diabetes and its detailed mechanisms are not fully understood.
NF-κB-inducing kinase (NIK), which is also known as MAP3K14, is a key activator of the non-canonical NF-κB signaling pathway.4 Under physiological conditions, the non-canonical NF-κB signaling pathway is inactivated because of the low expression of NIK. Its protein levels cannot be detected using currently available commercial antibodies, which is most likely due to TRAF2- and TRAF3-mediated ubiquitination and degradation.4 Under pathological conditions, NIK mRNA levels are increased,5,6 and NIK protein stability is also improved due to cytokine-mediated degradation of TRAF2 and TRAF3. In turn, NIK/IKKα fully activates the non-canonical NF-κB signaling pathway by inducing p52 formation.4,7 This p52 is the active form of NF-κB2,8 which is translocated into the nucleus from where it induces the expression of inflammatory genes.9 Recent studies have shown that the activation of NIK either by a pharmacological tool or by β cell-specific deletion of negative regulators (TRAF2 or TRAF3) of NIK impairs islet β cell function in obesity.3 The genome-wide association study (GWAS) shows that a single-nucleotide polymorphism (SNP) rs17759555 of NIK (MAP3K14) is strongly associated with type 1 diabetes.10 However, the contribution of NIK in the development of diabetes is still largely unknown.
In this study, we demonstrate that the NIK in islet β cells plays a key role in the development of diabetes. β cell-specific NIK-overexpressing (β-NIK-OE) mice display spontaneous diabetes at a young age (≥10-weeks of age), which is likely due to insulin deficiency, β cell death, and insulitis. Importantly, inhibiting the kinase activation of NIK by the small molecule B022 prevents NIK- or H2O2-induced β cell death and also ameliorates streptozotocin (STZ)-induced β cell death and hyperglycemia, which suggests that the kinase activity of NIK is essential in inducing islet dysfunction and diabetes, and inhibition of NIK activity is a potential strategy to ameliorate β cell failure in diabetes.
Results
Islet β Cell-Specific Overexpression of NIK Causes Spontaneous Diabetes in Mice
Inflammation and oxidative stress are two major causes of both type 1 and type 2 diabetes. Tumor necrosis factor alpha (TNF-α) and H2O2 can increase the expression of NIK and its kinase activity.3,6 The LTβR/NIK/NF-κB2 signaling pathway is present in both islet α11 and β cells (Figures S1A–S1C). In the MIN6 cells, LTβR was highly expressed (Figure S1A). Immunofluorescent data also showed that LTβR was highly expressed in insulin-positive cells (Figure S1B). Activation of LTβR by an anti-LTβR antibody can induce p100-to-p52 processing in a dose-dependent manner (Figure S1C). LIGHT, a ligand for LTβR, is abnormally increased in patients with type 2 diabetes and impairs islet β cell function.12 LIGHT activated the LTβR/NIK/NF-κB2 signaling pathway and induced p52 production in a dose-dependent manner (Figure 1A). The GWAS has shown that an SNP rs17759555 of NIK (MAP3K14) is strongly associated with type 1 diabetes.10 To determine whether activation of NIK in pancreatic β cells contributes to diabetes, we generated β cell-specific overexpression of NIK (β-NIK-OE) mice by crossing STOP-NIK mice with Rip-Cre transgenic mice. NIK mRNA levels were increased by more than 10-fold (Figure 1B), and the p52 production was significantly increased by ∼17.6-fold (Figure 1C), which is within the range of LIGHT (1–5 μg/mL)-induced p52 production (Figure 1A). The blood glucose levels in male β-NIK-OE mice under fed conditions were gradually increased at 3 weeks of age and reached about 20 mM at 9 weeks of age (Figure 1D). All of the male β-NIK-OE mice developed non-obese diabetes (NOD) at 10 weeks of age, whereas the blood glucose in control mice did not change at 3–16 weeks of age (Figure 1D). The incidence rate of diabetes was 100% in male β-NIK-OE mice after 10 weeks of age. The β-NIK-OE mice displayed decreased body weights starting from 11 weeks of age (Figure 1E), most likely because of the severe diabetic phenotypes. Expectedly, the β-NIK-OE mice showed severe glucose intolerance with no insulin resistance (Figures 1F and 1G).
Figure 1.

Islet β-NIK-OE Induces Non-obese Diabetes
(A) Pancreatic islets were isolated from C57BL6 mice and treated with LIGHT at different concentrations (0, 1, and 5 μg/mL) for 2 h. NF-κB2 and Actin protein levels were measured by immunoblotting. (B and C) Pancreatic islets were isolated from male β-NIK-OE mice and control littermates at 8 weeks of age. NIK mRNA levels were measured by qRT-PCR and normalized to 36B4 levels (B) (β-NIK-OE: n = 4; control: n = 4). NF-κB2, IκBα, and Actin protein levels were measured by immunoblotting (C). (D) Feeding blood glucose levels were measured every week from 3 to 18 weeks of age (β-NIK-OE: n = 6–9; control: n = 6–11). (E) Body weights of male β-NIK-OE mice and control littermates (β-NIK-OE: n = 6–9; control: n = 6–11). (F and G) Glucose tolerance test (GTT) (F) and insulin tolerance test (ITT) (G) were measured in male β-NIK-OE and control mice at 18 weeks of age (β-NIK-OE: n = 6; control: n = 7). (H–K) Serum insulin (H), C-peptide (I), β-hydroxybutyrate (J), and glucagon (K) levels were measured in male β-NIK-OE and control mice at 18 weeks of age (β-NIK-OE: n = 11; control: n = 10–12). (L and M) Pancreas insulin (L) and glucagon (M) contents were measured in male β-NIK-OE and control mice at 18 weeks of age (β-NIK-OE: n = 11; control: n = 12). (N) Representative islets from male β-NIK-OE mice and control littermates at 18 weeks of age were immunostained with insulin and glucagon. The scale bar represents 100 μm. (O) Relative insulin-positive areas of male β-NIK-OE mice and control littermates at 18 weeks of age (β-NIK-OE: n = 5; control: n = 5). (P) Ratio of islet glucagon-positive area/islet areas in male β-NIK-OE mice and control littermates at 18 weeks of age (β-NIK-OE: n = 5; control: n = 5). ∗p < 0.05, ∗∗p < 0.01. Data represent the mean ± SEM.
Decreased insulin level is the major cause of hyperglycemia in type 1 diabetes, and decreased serum C-peptide is a marker of type 1 diabetes. Therefore, we measured plasma insulin and C-peptide levels in β-NIK-OE and control mice. The feeding serum insulin levels were dramatically reduced by 86.3% (Figure 1H), and the serum C-peptide levels were decreased by 65% (Figure 1I), indicating severely impaired insulin secretion in male β-NIK-OE mice. Absolute insulin deficiency resulted in ketoacidosis as revealed by the dramatically increased serum β-hydroxybutyrate levels in β-NIK-OE mice (Figure 1J). The serum glucagon levels were significantly increased by about 2.8-fold in β-NIK-OE mice (Figure 1K), contributing to the hyperglycemia. Accordingly, pancreatic insulin contents were significantly decreased by 98.1%, whereas the glucagon contents were increased by about 1.83-fold in β-NIK-OE mice relative to the control mice (Figures 1L and 1M). Immuno-histological analyses showed that both the size of individual islets and the total islet area were significantly decreased in male β-NIK-OE mice as compared with the control mice (Figure 1N). The relative insulin-positive area was dramatically decreased (Figure 1O), whereas the relative glucagon-positive area in the islets was significantly increased in β-NIK-OE mice (Figure 1P). These data indicate that insufficient secretion of insulin and higher levels of serum glucagon thus contribute to the observed hyperglycemia in male β-NIK-OE mice.
β-NIK-OE Mice at a Young Age Display Increased β Cell Death and Glucose Intolerance
Islet β cell death may have occurred at an early age in β-NIK-OE mice, which contributed to the dramatic reduction of insulin-positive areas at an old age (18 weeks of age). To test this hypothesis, we measured islet β cell apoptosis by TUNEL staining in β-NIK-OE mice at a young age (8 weeks of age). Pancreatic sections were co-immunostained with anti-insulin antibody to visualize β cells. The number of TUNEL-positive β cells was significantly more in β-NIK-OE mice than that in control mice (Figure 2A), which caused a significant reduction of islet β cell mass in β-NIK-OE mice at 8 weeks of age (Figure 2B). As expected, β-NIK-OE mice at a young age (8 weeks of age) also showed severe glucose intolerance with no insulin resistance (Figures 2C and 2D). We did not observe any difference in the insulin content between β-NIK-OE and control mice at birth (β-NIK-OE: 2,398.4 ± 501.9 ng/mg protein, n = 5; control: 2,165.9 ± 285.1 ng/mg protein, n = 7; p = 0.6751), which indicates that β-NIK-OE of NIK does not affect the embryonic development of β cells. Taken together, these data suggest that increased apoptosis of β cells contributes to the reduced islet β cell mass and the decreased serum insulin levels observed in the adult β-NIK-OE mice.
Figure 2.

β-NIK-OE Mice at Young Age Display Increased β Cell Death and Glucose Intolerance
(A) Islet β cell apoptosis in male β-NIK-OE mice and control mice at 8 weeks of age was measured by TUNEL assays (β-NIK-OE: n = 5; control: n = 5). (B) Relative insulin-positive areas (β cell mass) of male β-NIK-OE mice and control littermates at 8 weeks of age (β-NIK-OE: n = 6; control: n = 5). The scale bars represent 100 μm. (C and D) Glucose tolerance test (GTT) (C) and insulin tolerance test (ITT) (D) were measured in male β-NIK-OE and control mice at 8 weeks of age (β-NIK-OE: n = 6–7; control: n = 8). ∗p < 0.05, ∗∗p < 0.01. Data represent the mean ± SEM.
β-NIK-OE Mice at a Young Age Display Increased Lymphocyte Infiltration in Islets
It has been well-known that type 1 diabetes is associated with increased lymphocyte infiltration in islets, which contributes to the disease progression in both NOD mice and human patients with type 1 diabetes.1,13 Immunostaining data showed that both B220+ and CD3+ lymphocytes were significantly increased in islets of β-NIK-OE mice (Figures 3A and 3B), suggesting that β-NIK-OE mice developed insulitis and lymphocyte infiltration. To further confirm the infiltration of lymphocytes into islets, we performed flow cytometry. At 6 weeks of age, the percentage of CD45.2+ CD3+ T cells in islets was about 1.16% in β-NIK-OE mice (Figures 3C and 3D; Figure S2), whereas only 0.06% of the total cells were CD45.2+ CD3+ T cells in the islets of control mice. About 0.4% of all cells were CD8+ T cells and 0.18% were CD4+ T cells in the β-NIK-OE islets (Figures 3C and 3D; Figure S2), whereas fewer CD4+ and CD8+ T cells were observed in the control islets (Figures 3C and 3D; Figure S2). These data indicate that β-NIK-OE leads to lymphocyte infiltration, which further induces β cell death and diabetes.
Figure 3.

β-NIK-OE Mice Display Increased Lymphocyte Infiltration in Islets at Young Age
(A) B lymphocytes were immunostained with anti-B220 antibody. Pancreatic sections were also immunostained with anti-insulin antibody to identify islet β cells (β-NIK-OE: n = 6; control: n = 5). (B) T lymphocytes were immunostained with anti-CD3 antibody in pancreatic sections of male β-NIK-OE mice and control mice at 8 weeks of age. Pancreatic sections were also immunostained with anti-insulin antibody to identify islet β cells (β-NIK-OE: n = 5; control: n = 6). The scale bars represent 100 μm. (C) Islets were isolated from male β-NIK-OE mice and control mice at 6 weeks of age. Single cells were dispersed and subjected to FACS analysis. Representative FACS plots of staining for total T (CD45.2+CD3+) cells, CD4 T (CD45.2+CD3+CD4+) cells, and CD8 T (CD45.2+CD3+CD8+) cells were presented. (D) Quantification of FACS data (β-NIK-OE: n = 3 pooled samples; control: n = 4 pooled samples; each pooled sample contained islet cells from 2–8 mice). (E) mRNA levels in islets of male β-NIK-OE mice and control mice were measured by qRT-PCR (β-NIK-OE: n = 7; control: n = 7). ∗p < 0.05, ∗∗p < 0.01. Data represent the mean ± SEM.
Next, we performed qRT-PCR on cDNA from the islets of β-NIK-OE and control mice. Transcripts that demonstrated inflammation of the islets, including Cxcl1, Cxcl10, Cxcl11, and Tnfα, were all upregulated in 8 weeks of β-NIK-OE mice (Figure 3E). Coincident with T cell entry, we detected an upregulation of T cell-associated gene (Cd3) (Figure 3E). Finally, we analyzed canonical markers of B cells (Cd19) by qPCR. The expression of Cd19 was significantly increased in the islets of β-NIK-OE mice (Figure 3E), further supporting the infiltration of B cells.
NIK Activation in Islet β Cells Inhibits Glucose-Stimulated Insulin Secretion
To determine whether NIK directly inhibits glucose-stimulated insulin secretion (GSIS), we isolated islets from β-NIK-OE and control mice and treated them with low (2.8 mM) and high (16.7 mM) glucose, respectively. Insulin secretion and islet insulin content were measured by ELISA. As shown in Figures 4A and 4B, GSIS was dramatically decreased in the islets of β-NIK-OE mice, and the insulin content was also significantly reduced. Consistently, the expression of insulin-secretion-related genes, such as Glut2 and Gck, was significantly decreased in the islets of β-NIK-OE mice. Insulin1/2 mRNA levels were also decreased, which also contributed to the downregulation of insulin content. In addition to Gck (also named as MODY2), other MODYs (maturity-onset diabetes of the young), such as Hnf4α (MODY1), Hnf1α (MODY3), Pdx1 (MODY4), Hnf1β (MODY5), and Neurod1 (MODY6), were dramatically downregulated in the islets of β-NIK-OE mice (Figure 4C). These data demonstrate that the downregulation of insulin-secretion-related genes contributes to β cell failure and diabetes in β-NIK-OE mice.
Figure 4.

NIK Activation in Islet β Cells Inhibits Glucose-Stimulated Insulin Secretion
(A and B) Islets were isolated from male β-NIK-OE and control mice (8 weeks of age) and treated with low (2.8 mM) glucose for 1 h and then high (16.7 mM) glucose for 1 h. Insulin secretion (A) and islet insulin content (B) were measured by ELISA (β-NIK-OE: n = 5; control: n = 5). (C) The expression of genes related to insulin secretion (Gck, Glut2, Hnf1α, Hnf1β, Hnf4α, Insulin1/2, Neurod1, and Pdx-1) was measured by qRT-PCR (β-NIK-OE: n = 7; control: n = 7). ∗p < 0.05, ∗∗p < 0.01. Data represent the mean ± SEM.
NIK Activity Is Essential for NIK to Induce β Cell Failure
NIK is the key activator of the non-canonical NF-κB signaling pathway.4 To determine whether NIK can regulate islet β cell function, we overexpressed NIK and NIK(KA) in INS-1 832/13 cells by infecting them with ad-NIK and ad-NIK(KA) adenovirus and then assessed insulin secretion and cell viability. NIK protein levels were very high in ad-NIK- and ad-NIK(KA)-infecting INS-1 832/13 cells (Figure 5A). NIK, but not NIK(KA), induced p100-to-p52 processing (Figure 5A), which further supports the fact that KA mutations block the activation of the non-canonical NF-κB signaling pathway. As shown in Figure 5B, GSIS was present in the β-Gal control and NIK(KA) groups, whereas GSIS was completely blocked in NIK-overexpressing INS-1 832/13 cells. Moreover, insulin protein levels (insulin content) were significantly decreased in INS-1 832/13 cells after activation of NIK signaling (Figure 5C). Additionally, cell viability was significantly decreased (Figure 5D), and the number of TUNEL-positive cells was dramatically increased in NIK-overexpressing INS-1 832/13 cells (Figure 5E). However, the kinase death mutations NIK(KA) showed moderate effect on insulin content and cell death compared with the β-Gal control (Figures 5C–5E).
Figure 5.

NIK Activity Is Essential for NIK to Induce β Cell Failure
INS-1 832/13 cells were infected with β-Gal, NIK, and NIK(KA) adenovirus for 16 h. Insulin secretion, RNA-seq, and qRT-PCR analysis were performed in β-Gal-overexpressing (control), NIK-overexpressing, and NIK(KA)-overexpressing INS-1 832/13 cells. (A) Flag-NIK, NF-κB2, and Tubulin protein levels were measured by immunoblotting. (B) Glucose (16.7 mM)-stimulated insulin secretion (GSIS) was measured by ELISA (n = 3–4 for each group). (C) Insulin content was measured by ELISA (n = 4). (D and E) Cell viability (D) and the number of TUNEL-positive cells (E) were measured after virus infection for 48 h (n = 5–6 for each group). The scale bar represents 100 μm. (F) Heatmap derived from RNA-seq expression data of the differentially expressed genes (DEGs)(|log2(FoldChange)| > 1 and q < 0.005). (G) Top GO biological process terms enriched in downregulated and upregulated genes in NIK-overexpressing INS-1 832/13 cells compared with β-Gal control. (H) The expression of genes related to inflammation (Il1, Il6, Tnfα, Ccl5, Ccl11, Cxcl1, Cxcl10, and Cxcl11), antigen presentation (RT1-CE4, RT1-CE7, RT1-M2, RT1-M3, B2M, RT1-Ba, and RT1-Da), and insulin secretion (Gck, Glut2, Hnf1α, Hnf1β, Hnf4α, Insulin1/2, Neurod1, and Pdx-1) was measured by qRT-PCR (n = 6 for each group). ∗p < 0.05, ∗∗p < 0.01. Data represent the mean ± SEM.
To further determine the molecular mechanisms involved in the NIK regulation of β cell function, we performed RNA sequencing (RNA-seq) analysis in β-Gal-overexpressing (control), NIK-overexpressing INS-1 832/13, and NIK(KA)-overexpressing INS-1 832/13 cells. As shown in Figure 5F, a total of 471 genes were upregulated and 249 genes were downregulated following NIK overexpression. Gene Ontology (GO) analysis indicated that the upregulated genes were primarily related to the immune response, whereas the downregulated genes were primarily related to insulin secretion (Figure 5G). The Kyoto Encyclopedia of Genes and Genomes (KEGG) pathway enrichment analysis showed that signaling pathways related to insulin secretion, protein processing in endoplasmic reticulum, and MODY were significantly decreased (Figure S3A), whereas immune signaling pathways, including the TNF, NF-κB, and antigen processing and presentation signaling pathways, were significantly activated by NIK overexpression in INS-1 832/13 cells (Figure S3B). NIK(KA), the dominant-negative mutant of NIK, does not induce the expression of genes related to immune response in INS-1 832/13 cells (Figure 5F).
Among the upregulated genes, the expression of TNF, NF-κB, and antigen processing and presentation signaling pathways were confirmed by qPCR (Figure 5H). Inflammation-related genes, such as Il1, Tnfα, Ccl5, Cxcl1, Cxcl10, and Cxcl11, were dramatically increased in NIK-overexpressing INS-1 832/13 cells (Figure 5H). Antigen-processing and -presentation-related genes, including RT1-CE4, RT1-CE7, RT1-M2, RT1-M3, B2M, RT1-Ba, and RT1-Da, were also significantly increased in NIK-overexpressing INS-1 832/13 cells (Figure 5H). However, NIK(KA), the dominant-negative mutant of NIK, suppressed the expression of genes related to inflammation (Il6, Ccl11, Cxcl1, and Cxcl11) and antigen presentation (RT1-CE4, RT1-M2, RT1-M3, and B2M) in INS-1 832/13 cells (Figure 5H), indicating that the inhibition of NIK may prevent β cell dysfunction. Among the downregulated genes, the expression of insulin-secretion-related genes, such as Gck, Glut2, Hnf1α, Hnf4α, Insulin1/2, Neurod1, and Pdx1, was confirmed by qPCR (Figure 5H). However, NIK(KA) does not affect the expression of genes related to insulin secretion in INS-1 832/13 cells (Figure 5H). These data indicate that NIK activity is essential for NIK to inhibit GSIS and to induce cell death in β cells.
Inhibition of NIK Activity by Small Molecule B022 Prevents NIK- and H2O2-Induced β Cell Death
We recently reported that B022 is a specific inhibitor of NIK activity, and B022 can ameliorate CCl4-induced liver injury and inflammation in mice.5,14 To determine whether inhibition of NIK activity by B022 can prevent NIK-induced β cell failure, we infected INS-1 832/13 cells with ad-NIK adenovirus in the presence of B022 for 16 h, after which p100-to-p52 processing, cell viability, and gene expression were measured. As expected, B022 (10 μM) completely blocked NIK-induced p100-to-p52 processing (Figure 6A). B022 also dose-dependently prevented NIK- or H2O2-induced cell death (Figures 6B and 6C). Furthermore, B022 dose-dependently rescued the inhibitory effects of NIK on genes related to insulin secretion, such as Insulin1/2, Pdx-1, and Neurod1 (Figure 6D). The induction of genes related to inflammation, such as Cxcl1, Il1, Il6, and Tnfa, was blocked by B022 (Figure 6E). The induction of genes related to antigen processing and presentation, such as RT1-Ba, RT1-Da, and RT1-M2, was also dramatically inhibited by B022 (Figure 6F). These data demonstrate that NIK directly impairs β cell function and its kinase activity is essential for NIK- or H2O2-induced β cell death.
Figure 6.

Inhibition of NIK Activity by Small Molecule B022 Prevents NIK- or H2O2-Induced β Cell Failure In Vitro
INS-1 832/13 cells were infected with NIK adenovirus in the presence of B022 at different doses (0, 1, and 10 μM) for 16 h. (A) Flag-NIK, NF-κB2, and Tubulin protein levels were measured by immunoblotting. The quantification of p52/p100 was present on the right (n = 3 for each group). (B) Cell viability was measured by MTT (n = 6 for each group). (C) INS-1 832/13 cells were treated with H2O2 (50 μM) in the presence of B022 at different doses (0, 1, and 10 μM) for 16 h. Cell viability was measured by MTT (n = 5 for each group). (D–F) The expression of genes related to insulin secretion (Insulin1/2, Pdx-1, and Neurod1) (D), inflammation (CXCL1, IL1, IL6, and TNFα) (E), and antigen presentation (RT1-Ba, RT1-Da, and RT1-M2) (F) was measured by qRT-PCR (n = 5–6 for each group). ∗p < 0.05, ∗∗p < 0.01. Data represent the mean ± SEM.
Inhibiting the Kinase Activation of NIK by B022 Ameliorates STZ-Induced Diabetes in Mice
To further determine whether the inhibition of NIK activity by B022 can ameliorate STZ-induced diabetes in vivo, we intraperitoneally injected C57BL6 wild-type (WT) mice with a high dose of STZ to induce diabetes and then injected B022 or vehicles via tail veins four times a day as shown in Figure 7A. STZ is able to increase blood glucose levels in C57BL6 WT mice (Figure 7B). Intravenous administration of B022 ameliorated STZ-induced hyperglycemia (Figure 7B) and glucose intolerance (Figure 7C). The insulin sensitivity determined by insulin tolerance test (ITT) was similar between B022- and vehicle-treated mice (Figure 7D). B022 also ameliorated STZ-induced β cell death as revealed by higher serum insulin levels (Figure 7E), a higher pancreas insulin content (Figure 7F), and a higher β cell mass (Figures 7G and 7H) in B022-treated mice. Together, these results demonstrate that B022 ameliorates STZ-induced diabetes, indicating that inhibition of NIK activity by a small molecule could be a potential strategy for the treatment of diabetes.
Figure 7.

Inhibition of NIK Activity by Small Molecule B022 Ameliorates STZ-Induced Diabetes In Vivo
C57BL6 WT mice were intraperitoneally injected with a high dose of STZ (200 mg/kg) to induce diabetes, and then B022 or vehicles were injected via tail vein four times per day. (A) Experiment schedule. (B) Blood glucose (n = 10 for each group). (C) Glucose tolerance test (GTT) (n = 10 for each group). (D) Insulin tolerance test (ITT) (n = 7 for each group). (E) Serum insulin levels (n = 10 for each group). (F) Pancreas insulin contents (n = 10 for each group). (G) Representative islets from B022- and vehicle-treated mice were immunostained with insulin. The scale bar represents 100 μm. (H) Relative insulin-positive areas of B022- and vehicle-treated mice (n = 6–7 for each group). ∗p < 0.05, ∗∗p < 0.01. Data represent the mean ± SEM.
Discussion
GWAS has shown that an SNP rs17759555 of NIK (MAP3K14) is associated with type 1 diabetes.10 Some indirect evidence shows that the activation of NIK by cytokine treatment, small molecules, or β cell-specific deletion of negative regulators (TRAF2 or TRAF3) of NIK impaired islet β cell function both in vitro and in vivo.3,12 However, direct evidence is still lacking, and whether or not activation of NIK leads to diabetes is still largely unknown. In this study, we provided direct evidence of the fact that NIK plays a key role in the progression of diabetes. Islet β-NIK-OE results in diabetes at a very early age, which is due to insulin deficiency, β cell death, and insulitis. These observations indicate that islet β cell failure induced by NIK is directly linked to diabetes.
Our results demonstrate that NIK activation leads to diabetes through several pathways. Overexpression of NIK in islet β cells results in impaired insulin synthesis and secretion, both in vitro and in vivo, and this is most likely due to decreased expression of MYODs (Hnf4α [MODY1], Hnf1α [MODY3], Pdx1 [MODY4], Hnf1β [MODY5], Neurod1 [MODY6]), insulin1/2, and Glut2. In addition, overexpression of NIK causes islet β cell death both in vitro and in vivo, leading to a dramatically decreased islet β cell mass, further contributing to hypoinsulinemia in β-NIK-OE mice. In addition, glucagon-positive cell mass and serum glucagon levels were significantly increased in β-NIK-OE mice, which is similar to the phenotypes observed in type 1 diabetes.15, 16, 17 It has been shown that upregulated Ca2+-dependent activity of mTOR in α cells leads to increased proliferation in recent-onset type 1 diabetes, which is due to the insufficient release of GABA from the β cells.17 Whether or not this mechanism also happens in β-NIK-OE mice needs to be further tested in the future. Insufficient secretion of insulin and higher levels of serum glucagon thus contribute to the observed hyperglycemia in β-NIK-OE mice.
Islet inflammation and insulitis may also contribute to the diabetic phenotypes in β-NIK-OE mice. Overexpression of NIK causes the induction of cytokines, chemokines, antigen-processing- and -presentation-related factors, such as major histocompatibility complex (MHC) class I and class II, both in vitro and in vivo. These inflammatory factors (such as cytokines and chemokines) and danger signals from dying islet β cells could induce immune cell infiltration during the early development of diabetes.1 The percentage of CD45.2+ cells in islets is significantly increased in β-NIK-OE mice as compared with control mice. CD3+ T cells, including CD4+ and CD8+ T cells within the islets, are significantly increased in β-NIK-OE mice, whereas fewer CD3+ T cells were observed in the islets of control mice. It is still unknown whether these immune cells in the islets also contribute to β cell death in β-NIK-OE mice. However, the inhibition of NIK activity either by NIK(KA) or by the small molecule B022 completely blocks NIK-induced inflammation, which indicates that NIK activity is essential for the induction of inflammation.
TRAF2 and TRAF3 negatively regulate NIK protein levels.9 It has been shown that TRAF2/TRAF3 deficiency in β cells increases NIK and p52 protein levels, which leads to impaired β cell function.3 In this work, we show that NIK overexpression specifically in β cells causes β cell death and diabetes. These data consistently show that activation of the noncanonical NF-κB signaling pathway results in β cell dysfunction. However, even though the induction of p52 protein levels is similar, the phenotypes in β-NIK-OE mice are more significant than that in βTRAF2KO or βTRAF3KO mice, and the transcriptional changes in βTRAF2KO, βTRAF3KO, and NIK-overexpressing β cells only partially overlap. These data indicate that NIK may have other targets, which needs to be further studied in the future.
NIK overexpression in β cells leads to impaired insulin secretion, β cell death, and inflammation. Inflammation could cause impaired insulin secretion and induce β cell death in both type 1 and type 2 diabetes.1,2,18 NIK-induced inflammation surely contributes to impaired insulin secretion and induces β cell death. NIK may also inhibit insulin secretion independent of inflammation. The molecular mechanisms need to be further studied. Due to the impaired insulin secretion, β cell death, and insulitis, 100% of male β-NIK-OE mice develop NOD at 10 weeks of age that is much earlier than that in NOD mice. Compared with NOD mice, β-NIK-OE mice show clear advantages in that 100% of male mice develop stable diabetic phenotypes at a very early age (10 weeks of age). Therefore, β-NIK-OE mice may be a diabetes mouse model for basic study and drug screening.
NIK activity is essential for NIK or oxidative stress to induce β cell dysfunction, such as β cell death, inflammation, and decreased insulin synthesis and secretion. Inhibition of NIK by either NIK(KA) mutation or small molecule B022 prevents NIK-induced cell death, inflammation, and inhibitory effects of insulin secretion. B022 also prevents H2O2-induced β cell death. Intravenous administration of B022 ameliorates STZ-induced hyperglycemia, β cell death, and hypoinsulinemia. However, it should be noted that the in vivo pharmacokinetic properties of B022 are not good.5,14 Therefore, multiple injections of B022 per day are required to achieve the in vivo inhibition of STZ-induced β cell death and hyperglycemia. To determine whether inhibition of NIK in β cells by small molecules can ameliorate diabetes in the chronic mouse models (e.g., multiple low-dose STZ injections or NOD mice), further modifications to B022 are required.
In conclusion, we have provided direct evidence that NIK plays a key role in β cell function. Islet β-NIK-OE induces diabetes at a very early age by inducing the expression of cytokines and chemokines, and causing immune cell infiltration and β cell death. NIK activity is essential for NIK or oxidative stress to induce islet β cell failure. Inhibition of NIK by small molecule B022 ameliorates STZ-induced β cell death and hyperglycemia. These data suggest that NIK might be a drug target for the treatment of diabetes.
Materials and Methods
Animal Experiments
Animal experiments were carried out in strict accordance with the Guide for the Care and Use of Laboratory Animals published by the National Institutes of Health (NIH publication no. 85-23, revised 1996). Animal experiment protocols were approved by the Institutional Animal Care and Use Committee of Harbin Institute of Technology (IACUC/HIT). The approval number is IACUC-2018001. STOP-NIK and Rip-Cre mice (C57BL/6J background) were described previously.5,11,19 STOP-NIK mice were crossed with Rip-Cre mice to generate islet β-NIK-OE mice. Mice were housed on a 12-h light/12-h dark cycle and fed a normal chow with free access to water. We used male β-NIK-OE (homozygous STOP-NIK with heterozygous Rip-Cre) and control mice (homozygous STOP-NIK) for all of the experiments. Blood glucose was monitored daily or weekly and after two consecutive readings of ≥11.1 mM (200 mg/dL), mice were considered diabetic. Blood glucose levels were measured as described previously.5 Blood samples were collected from orbital sinus. Serum glucagon and insulin levels were measured using glucagon ELISA kits (DGCG0; R&D Systems) and insulin ELISA kits (MS100; EZassay), respectively. The detailed information of the reagents was listed in Table S1.
Cell Cultures, Adenoviral Infection, and GSIS
INS-1 832/13 cells were cultured at 37°C and 5% CO2 in RPMI-1640 medium supplemented with 10% FBS and 50 mmol/L β-mercaptoethanol as shown previously.20 INS-1 832/13 cells were infected with β-Gal, NIK, and NIK(KA) adenovirus for 48 h and subjected to MTT and TUNEL assays. For GSIS assay, INS-1 832/13 cells were infected with β-Gal, NIK, and NIK(KA) adenovirus for 16 h, and these cells were incubated at 37°C in 200 μL of Hank’s balanced salt solution (HBSS) (pH 7.4) containing 2.8 or 16.7 mM glucose for 1 h. Islets were isolated from β-NIK-OE and control mice. After overnight culture, islets were incubated at 37°C in 200 μL of HBSS (pH 7.4) containing 2.8 mM glucose for 1 h and then in HBSS containing 16.7 mM glucose for 1 h. The medium was collected to measure GSIS. Cells or islets were then harvested in a lysis buffer, and protein concentrations were measured. The cell extracts were then mixed with acid-ethanol (1.5% HCl in 70% EtOH) and used to measure the insulin content. Insulin secretion and insulin content were measured using a rat insulin RIA kit (Linco Research, St. Charles, MO, USA) or insulin ELISA kits (MS100; EZassay) and normalized to protein levels.
Immunoblotting
INS-1 832/13 cells were harvested in a lysis buffer (R0020; Solarbio). Cell extracts were immunoblotted with the indicated antibodies and visualized using the enhanced chemiluminescence (ECL). Antibody dilution ratios were as follows: FLAG (F1804, 1:5,000 dilution; Sigma), NF-κB2 (4882, 1:2,000; CST), β-actin (60008-1-lg; 1:5,000; Proteintech), IκBα (10268-1-AP, 1:2,000; Proteintech), and Tubulin (sc5286, 1:5,000 dilution; Santa Cruz).
Quantitative Real-Time PCR Analysis
Total RNAs were extracted using TriPure Isolation Reagent (Roche, Mannheim, Germany), and the first-strand cDNAs were synthesized using random primers and M-MLV reverse transcriptase (Promega, Madison, WI, USA) as shown before.5,11,21 Gene expression was quantified by the comparative threshold cycle (ΔΔCT) method, and results were normalized to the expression of 36B4. Primers for quantitative real-time PCR were listed in Table S2.
Immunostaining and TUNEL Assays
Immunostaining was performed as shown previously.11,20 In brief, pancreata were fixed in 4% paraformaldehyde for 3 h and then in 30% sucrose overnight. Five frozen pancreatic sections (8–10 μm, spaced >200 μm apart) for each mouse were taken for staining and analyzing. These sections were stained with the indicated antibodies (Table S1). The dilution ratios were as follows: insulin (A0564, 1:1,000 dilution; Dako), glucagon (G2654, 1:1,000 dilution; Sigma), LTβR (20331-1-AP, 1:200 dilution; Proteintech), CD3 (100236, 1:100 dilution; BioLegend), and B220 (103222, 1:100 dilution; BioLegend). Islet insulin- and glucagon-positive areas were measured using ImageJ software and normalized to pancreatic section areas. TUNEL assays were performed by using cell death detection kits (Roche Diagnostics) following the manufacturer’s recommended procedure. The sections were also stained with DAPI to visualize total cells. Cell number was counted manually.
Fluorescence-Activated Cell Sorting (FACS) Analysis
Pancreatic islets were isolated from β-NIK-OE and control mice at 6 weeks of age following a published protocol.11,20 Islets were handpicked from β-NIK-OE and control mice. Islets were pooled from two to eight β-NIK-OE and control mice. Each genotype included three to four pooled samples. Single cells were dispersed by shaking islets in Ca2+-and Mg2+-free Hank’s buffered solution containing 1 mM EGTA and 10 mg/mL BSA. Dispersed single cells were stained with indicated antibodies as shown in Table S1. The dates were collected with a BD FACSAria III flow cytometer with three laser lines (405, 488, and 633 nm).
RNA Sequencing
INS-1 832/13 cells were infected with β-Gal, NIK, and NIK(KA) adenovirus for 16 h. Islet total RNAs were extracted using TriPure Isolation Reagent (Roche, Mannheim, Germany). RNA-seq was performed by using HiSeq X Ten platform. Paired-end clean reads were aligned to the Rat reference genome with TopHat (version 2.0.12), and the aligned reads were used to quantify mRNA expression by using HTSeq-count (version 0.6.1) as described previously.11,22 RNA-seq data that support the findings of this study have been deposited in GEO under accession code GEO: GSE130121.
Statistical Analysis
Data were presented as means ± SEM. Differences between groups were analyzed by two-tailed Student’s t tests. p <0.05 was considered statistically significant.
Author Contributions
X.L. performed most of the experiments. Y.W., Y.S., N.D., M.L., and L.J. researched data. Y.Z. synthesized B022. M.L. nicely provided Rip-Cre mice and reviewed the manuscript. Z.C. designed the project, researched data, and wrote the manuscript.
Conflicts of Interest
The authors declare no competing interests.
Acknowledgments
This study was supported by the National Natural Science Foundation of China (grants 31671225 and 31971083 to Z.C., 81872724 to Y.Z., and 81570699, 81620108004, and 81830025 to M.L.); the National Natural Science Foundation of Heilongjiang Province of China (grant YQ2019C011 to Z.C.); and Tianjin Municipal Science and Technology Commission (grant 17ZXMFSY00150 to M.L.). X.L. is supported by the Chinese Postdoctoral Science Foundation (grant AUGA4130900619). We thank Dr. Zhongyu Zhang for assistance with the FACS experiment. We also thank Novogene for the assistance with RNA sequencing.
Footnotes
Supplemental Information can be found online at https://doi.org/10.1016/j.ymthe.2020.07.016.
Supplemental Information
References
- 1.Eizirik D.L., Colli M.L., Ortis F. The role of inflammation in insulitis and β-cell loss in type 1 diabetes. Nat. Rev. Endocrinol. 2009;5:219–226. doi: 10.1038/nrendo.2009.21. [DOI] [PubMed] [Google Scholar]
- 2.Donath M.Y., Dalmas É., Sauter N.S., Böni-Schnetzler M. Inflammation in obesity and diabetes: islet dysfunction and therapeutic opportunity. Cell Metab. 2013;17:860–872. doi: 10.1016/j.cmet.2013.05.001. [DOI] [PubMed] [Google Scholar]
- 3.Malle E.K., Zammit N.W., Walters S.N., Koay Y.C., Wu J., Tan B.M., Villanueva J.E., Brink R., Loudovaris T., Cantley J. Nuclear factor κB-inducing kinase activation as a mechanism of pancreatic β cell failure in obesity. J. Exp. Med. 2015;212:1239–1254. doi: 10.1084/jem.20150218. [DOI] [PMC free article] [PubMed] [Google Scholar]
- 4.Sun S.C. Non-canonical NF-κB signaling pathway. Cell Res. 2011;21:71–85. doi: 10.1038/cr.2010.177. [DOI] [PMC free article] [PubMed] [Google Scholar]
- 5.Ren X., Li X., Jia L., Chen D., Hou H., Rui L., Zhao Y., Chen Z. A small-molecule inhibitor of NF-κB-inducing kinase (NIK) protects liver from toxin-induced inflammation, oxidative stress, and injury. FASEB J. 2017;31:711–718. doi: 10.1096/fj.201600840R. [DOI] [PubMed] [Google Scholar]
- 6.Sheng L., Zhou Y., Chen Z., Ren D., Cho K.W., Jiang L., Shen H., Sasaki Y., Rui L. NF-κB–inducing kinase (NIK) promotes hyperglycemia and glucose intolerance in obesity by augmenting glucagon action. Nat. Med. 2012;18:943–949. doi: 10.1038/nm.2756. [DOI] [PMC free article] [PubMed] [Google Scholar]
- 7.Cildir G., Low K.C., Tergaonkar V. Noncanonical NF-κB Signaling in Health and Disease. Trends Mol. Med. 2016;22:414–429. doi: 10.1016/j.molmed.2016.03.002. [DOI] [PubMed] [Google Scholar]
- 8.Xiao G., Fong A., Sun S.-C. Induction of p100 processing by NF-kappaB-inducing kinase involves docking IkappaB kinase α (IKKalpha) to p100 and IKKalpha-mediated phosphorylation. J. Biol. Chem. 2004;279:30099–30105. doi: 10.1074/jbc.M401428200. [DOI] [PubMed] [Google Scholar]
- 9.Sun S.-C. The non-canonical NF-κB pathway in immunity and inflammation. Nat. Rev. Immunol. 2017;17:545–558. doi: 10.1038/nri.2017.52. [DOI] [PMC free article] [PubMed] [Google Scholar]
- 10.Evangelou M., Smyth D.J., Fortune M.D., Burren O.S., Walker N.M., Guo H., Onengut-Gumuscu S., Chen W.M., Concannon P., Rich S.S. A method for gene-based pathway analysis using genomewide association study summary statistics reveals nine new type 1 diabetes associations. Genet. Epidemiol. 2014;38:661–670. doi: 10.1002/gepi.21853. [DOI] [PMC free article] [PubMed] [Google Scholar]
- 11.Li X., Jia L., Chen X., Dong Y., Ren X., Dong Y., Chen Y., Xie L., Liu M., Shiota C. Islet α-cell Inflammation Induced By NF-κB inducing kinase (NIK) Leads to Hypoglycemia, Pancreatitis, Growth Retardation, and Postnatal Death in Mice. Theranostics. 2018;8:5960–5971. doi: 10.7150/thno.28960. [DOI] [PMC free article] [PubMed] [Google Scholar]
- 12.Halvorsen B., Santilli F., Scholz H., Sahraoui A., Gulseth H.L., Wium C., Lattanzio S., Formoso G., Di Fulvio P., Otterdal K. LIGHT/TNFSF14 is increased in patients with type 2 diabetes mellitus and promotes islet cell dysfunction and endothelial cell inflammation in vitro. Diabetologia. 2016;59:2134–2144. doi: 10.1007/s00125-016-4036-y. [DOI] [PMC free article] [PubMed] [Google Scholar]
- 13.Atkinson M.A., Eisenbarth G.S., Michels A.W. Type 1 diabetes. Lancet. 2014;383:69–82. doi: 10.1016/S0140-6736(13)60591-7. [DOI] [PMC free article] [PubMed] [Google Scholar]
- 14.Li Z., Li X., Su M.B., Gao L.X., Zhou Y.B., Yuan B., Lyu X., Yan Z., Hu C., Zhang H. Discovery of a Potent and Selective NF-κB-Inducing Kinase (NIK) Inhibitor That Has Anti-inflammatory Effects in Vitro and in Vivo. J. Med. Chem. 2020;63:4388–4407. doi: 10.1021/acs.jmedchem.0c00396. [DOI] [PubMed] [Google Scholar]
- 15.Cryer P.E. Minireview: Glucagon in the pathogenesis of hypoglycemia and hyperglycemia in diabetes. Endocrinology. 2012;153:1039–1048. doi: 10.1210/en.2011-1499. [DOI] [PMC free article] [PubMed] [Google Scholar]
- 16.Willcox A., Richardson S.J., Bone A.J., Foulis A.K., Morgan N.G. Evidence of increased islet cell proliferation in patients with recent-onset type 1 diabetes. Diabetologia. 2010;53:2020–2028. doi: 10.1007/s00125-010-1817-6. [DOI] [PubMed] [Google Scholar]
- 17.Feng A.L., Xiang Y.-Y., Gui L., Kaltsidis G., Feng Q., Lu W.-Y. Paracrine GABA and insulin regulate pancreatic alpha cell proliferation in a mouse model of type 1 diabetes. Diabetologia. 2017;60:1033–1042. doi: 10.1007/s00125-017-4239-x. [DOI] [PubMed] [Google Scholar]
- 18.Willcox A., Richardson S.J., Bone A.J., Foulis A.K., Morgan N.G. Analysis of islet inflammation in human type 1 diabetes. Clin. Exp. Immunol. 2009;155:173–181. doi: 10.1111/j.1365-2249.2008.03860.x. [DOI] [PMC free article] [PubMed] [Google Scholar]
- 19.Herrera P.L. Adult insulin- and glucagon-producing cells differentiate from two independent cell lineages. Development. 2000;127:2317–2322. doi: 10.1242/dev.127.11.2317. [DOI] [PubMed] [Google Scholar]
- 20.Chen Z., Morris D.L., Jiang L., Liu Y., Rui L. SH2B1 in β-cells regulates glucose metabolism by promoting β-cell survival and islet expansion. Diabetes. 2014;63:585–595. doi: 10.2337/db13-0666. [DOI] [PMC free article] [PubMed] [Google Scholar]
- 21.Wang Y., Gao M., Zhu F., Li X., Yang Y., Yan Q., Jia L., Xie L., Chen Z. METTL3 is essential for postnatal development of brown adipose tissue and energy expenditure in mice. Nat. Commun. 2020;11:1648. doi: 10.1038/s41467-020-15488-2. [DOI] [PMC free article] [PubMed] [Google Scholar]
- 22.Jia L., Jiang Y., Li X., Chen Z. Purβ promotes hepatic glucose production by increasing Adcy6 transcription. Mol. Metab. 2020;31:85–97. doi: 10.1016/j.molmet.2019.11.008. [DOI] [PMC free article] [PubMed] [Google Scholar]
Associated Data
This section collects any data citations, data availability statements, or supplementary materials included in this article.