

Abstract
How Wnt signaling is orchestrated in liver regeneration and tumorigenesis remains elusive. Recently, we identified transmembrane protein 9 (TMEM9) as a Wnt signaling amplifier. TMEM9 facilitates v-ATPase assembly for vesicular acidification and lysosomal protein degradation. TMEM9 is highly expressed in regenerating liver and hepatocellular carcinoma (HCC) cells. TMEM9 expression is enriched in the hepatocytes around the central vein (CV) and acutely induced by injury. In mice, Tmem9 knockout impairs hepatic regeneration with aberrantly increased Apc and reduced Wnt signaling. Mechanistically, TMEM9 downregulates APC through lysosomal protein degradation via v-ATPase. In HCC, TMEM9 is overexpressed and necessary to maintain β-catenin hyperactivation. TMEM9-upregulated APC binds to and inhibits nuclear translocation of β-catenin, independent of HCC-associated β-catenin mutations. Pharmacological blockade of TMEM9-v-ATPase or lysosomal degradation suppresses Wnt/β-catenin through APC stabilization and β-catenin cytosolic retention. Our results reveal that TMEM9 hyperactivates Wnt signaling for liver regeneration and tumorigenesis via lysosomal degradation of APC.
Keywords: liver regeneration, lysosome, tumorigenesis, TMEM9, Wnt, β-catenin, APC, v-ATPase, hepatocellular carcinoma
INTRODUCTION
Wnt signaling orchestrates multiple cellular processes such as cell proliferation, differentiation, adhesion, and migration during embryogenesis, organogenesis, tissue homeostasis, and regeneration (1–4). β-catenin acts as a critical player in Wnt/β-catenin signaling. The β-catenin destruction complex, including polyposis coli (APC), casein kinase 1 (CK1), glycogen synthase kinase 3α/β (GSK3α/β), and AXIN, negatively controls β-catenin, which induces β-catenin proteolysis (5). However, excessive activation of β-catenin induces hyperproliferation, leading to cancer.
Liver tissue shows a high capacity for regeneration when injured (3), and Wnt/β-catenin signaling has been shown to play crucial roles in liver regeneration (6–9). Tbx3 and Axin2, a Wnt/β-catenin target gene, are highly expressed in liver lobules around the central vein (CV) during homeostatic renewal and regeneration (10–12). In the setting of liver injury, these cells show high cell proliferative capacity through Wnt/β-catenin target genes such as cyclin D1 (3). Consistently, it has been shown that β-catenin contributes to hepatocyte proliferation (9) and growth (13, 14). Conversely, liver-specific β-catenin/Ctnnb1 knockout (KO) mice exhibit reduced liver size with decreased hepatocyte proliferation (9) and impaired liver regeneration (9). Despite such relevance of Wnt/β-catenin to liver regeneration, it remains elusive how Wnt/β-catenin signaling is activated upon liver injury.
The aberrant activation of the Wnt/β-catenin signaling is directly associated with HCC. HCC shows frequent genetic mutations in β-catenin/CTNNB1 (11% to 37% of patients), AXIN (5% to 15%), or APC (1% to 2%) genes in HCC (15, 16). β-catenin/CTNNB1 mutation allows β-catenin to escape an inhibitory function of the APC complex, resulting in hyperactivation of Wnt signaling (17). Despite the pivotal roles of genetic mutations in the core components of the Wnt pathway, accumulating evidence suggests that additional layers of Wnt signaling regulation are deregulated and contribute to β-catenin target gene activation and tumorigenesis (18–20). For instance, secreted Wnt ligands or agonists further enhance β-catenin target gene transactivation (21, 22). Additionally, mutated APC still negatively modulates β-catenin (22). Building on these findings, we recently revealed that deregulated v-ATPase, a vacuolar proton pump, amplifies Wnt signaling in colorectal cancer (23). Therefore, it is highly likely that beyond the core components of Wnt/β-catenin signaling, further layers of Wnt signaling regulation might contribute to hepatic tumorigenesis.
TMEM9 is a type I transmembrane protein mainly localized in the lysosomes and the late endosomes, also called the multivesicular bodies (MVBs) (24). Previously, we discovered that TMEM9 is highly expressed in cancer cells and enhances Wnt/β-catenin signaling (23). TMEM9 directly binds to the subunit of v-ATPase and its accessory protein and accelerates the assembly of them, which provokes the vesicular acidification and the lysosomal APC degradation (23). Moreover, genetic ablation of Tmem9 suppresses intestinal tumorigenesis with downregulation of Wnt/β-catenin signaling. β-catenin triggers transactivation of TMEM9 and forms a positive-feedback loop, leading to the hyperactivation of Wnt/β-catenin signaling (23). This interaction suggests that TMEM9 might amplify Wnt/β-catenin signaling in β-catenin/CTNNB1-mutated HCC and/or regenerative hepatocytes with increased Wnt/β-catenin signaling.
Given the crucial role of Wnt/β-catenin signaling in tissue regeneration and tumorigenesis, potentially related to TMEM9, we herein sought to determine the biologic and pathologic roles of TMEM9 in liver regeneration and HCC.
RESULTS
TMEM9 expression during liver regeneration
The Wnt signaling is present in hepatocytes of the CV region, and not in the regenerating hepatocytes (10–12). Given that TMEM9 positively regulates Wnt/β-catenin signaling, we first sought to locate TMEM9-expressing (TMEM9+) cells in the liver. Immunohistochemistry (IHC) showed that TMEM9+ cells were localized near the CV in normal mouse liver tissue but not Tmem9 KO liver tissue (Figure 1A) (23). TMEM9+ cells showed co-expression of glutamine synthetase (Gs), a marker for pericentral hepatocytes (Figure 1B), but not cytokeratin 19 (Ck19), a marker for biliary epithelial cells (Figure 1C). Next, we examined the expression of Tmem9 in the condition of liver regeneration by employing a liver injury mouse model using carbon tetrachloride (CCl4), a trigger for hepatocyte damage (12, 25). After CCl4 administration, Tmem9+/+ (WT) mice showed immediate loss of acutely pericentral hepatocytes, followed by gradual regeneration (Figure 1D). Intriguingly, TMEM9+ cells immediately began repopulating after CCl4 administration and culminated at 2 days post-injury (dpi; Figure 1E), which was accompanied by an increase of Ki67+ cells (Figure 1F). These results imply that TMEM9+ hepatocytes might be involved in hepatic regeneration.
Figure 1. TMEM9 expression during liver regeneration.

(A-C) TMEM9+ cells are localized around the central vein in the liver. IHC of mouse liver tissue for TMEM9 (A). Tmem9 KO mouse liver tissue served as a negative control for TMEM9 IHC. Co-staining for TMEM9 and glutamine synthetase, a marker for pericentral hepatocytes (B), or Ck19, a marker for biliary epithelial cells (C).
(D and E) The number of TMEM9+ hepatocytes cells increases in regenerating liver tissue. After intraperitoneal injection of CCl4, mouse liver tissue was analyzed by hematoxylin and eosin (H&E) staining (D) and immunohistochemistry for TMEM9 (E) and Ki67 (F).
Representative images of three experiments with similar results; Scale bars=100μm; CV, central vein; dpi, days post-injury; Gs, glutamine synthetase; PV, portal vein; WT, wild-type.
Impaired liver regeneration by Tmem9 KO
Having observed the expansion of TMEM9+ cells during hepatic regeneration, we asked whether genetic ablation of Tmem9 impairs hepatic regeneration. Because CCl4-induced hepatic injury was mostly recovered at 3 dpi (see Figures 1D–1F), we investigated the effect of TMEM9 depletion on hepatic regeneration at 3 dpi in Tmem9 KO mice, with Tmem9 WT mice as controls. Of note, Tmem9 KO mice exhibited no discernible phenotypes in the overall liver architecture and hepatocytes (Figure 2A and Supplementary Figure 1A–F). Three days after CCl4 administration, centrilobular necrosis was more severe inTmem9 KO mice than in Tmem9 WT mice (Figure 2B). Additionally, Tmem9 KO liver tissue showed less cell proliferation near the CV (as indicated by Ki67-positive cells; Figures 2C, 2D, and Supplementary Figures 1G and 1H) without significant alteration of apoptosis (as indicated by cleaved Caspase 3-positive cells [c-Cas3]; Supplementary Figures 1G and 1H). Given that regenerating cells near the CV differentiate into hepatocytes (26, 27), we examined the effect of TMEM9 depletion on hepatocyte expansion after liver injury using IHC for hepatocyte markers, hepatocyte nuclear factor 4α (Hnf4α) and albumin. Compared with Tmem9 WT tissue, Tmem9 KO mouse liver tissue showed the lower expression of Hnf4α and albumin at 3 dpi (Figures 2E and 2F). Similarly, the expression of Wnt/β-catenin signaling-controlled markers, Gs, Tbx3, and Cyp2e1 was reduced and exhibited the delayed expression pattern in Tmem9 KO mice compared to WT mice treated with CCl4 (Figures 2G, 2H, and Supplementary Figure 1I). Also, Tmem9 KO tissue showed significantly a smaller proportion of pericentral hepatocytes (as indicated by Gs-positive cells; Supplementary Figure 1G). These results suggest that TMEM9 is required for hepatic regeneration through repopulation of pericentral hepatocytes.
Figure 2. Impaired liver regeneration by Tmem9 knockout.
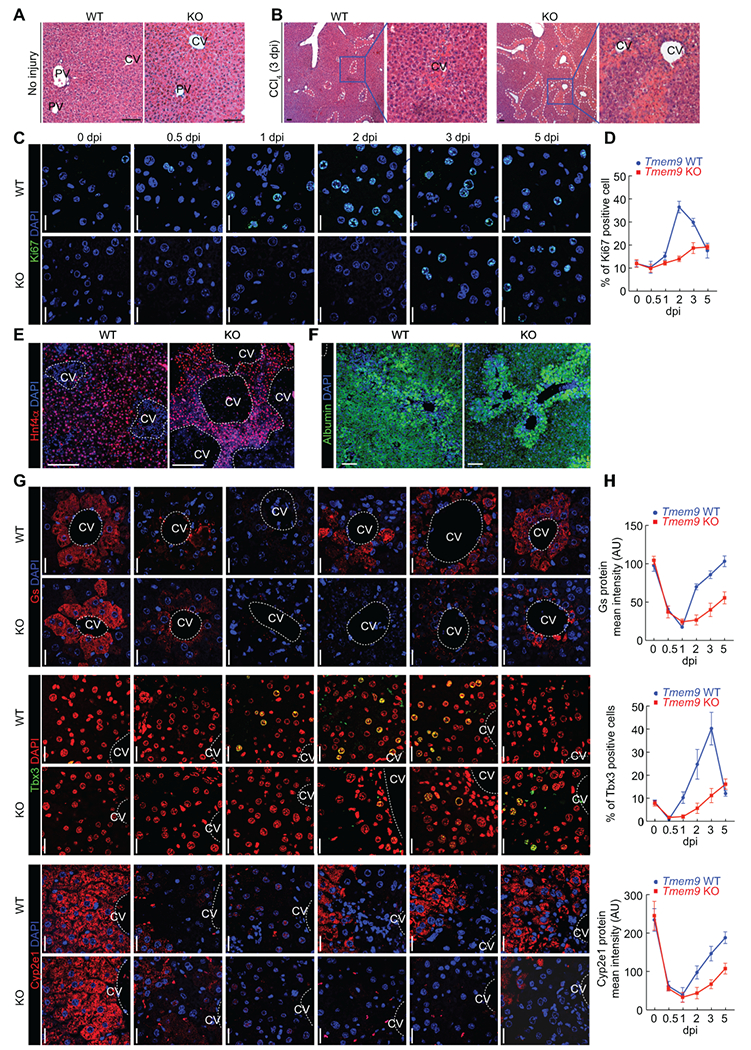
(A and B) Tmem9 KO impairs liver regeneration. In mice injected with control vehicle, no discernible phenotypes are seen in Tmem9 KO hepatocytes (A). After injection with CCl4, centrilobular necrosis was more pronounced in Tmem9 KO than in Tmem9 WT mouse liver tissue (B). Dotted lines indicate the centrilobular necrosis region.
(C and D) Cell proliferation was lower in Tmem9 KO than in Tmem9 WT mouse liver tissue upon hepatic injury. Staining of proliferating (Ki67) cells (C). Quantification of Ki67+ cells (D).
(E and F) Hepatocyte expansion is downregulated in Tmem9 KO mice upon hepatic injury. IHC for hepatocyte markers (Hnf4α, E; albumin, F) and pericentral hepatocytes.
(G and H) Reduced and delayed the expression of hepatocyte markers by Tmem9 KO during liver regeneration. IHC for Gs, Tbx3, and Cyp2e1 (G). Quantification by ZEN software (Zeiss).
Representative images of three experiments with similar results; Scale bars=20μm; error bars show mean ± SD from three or more independent experiments. CV: Central Vein (dotted lines/circles); dpi: days-post injury (CCl4).
TMEM9-activated Wnt/β-catenin signaling during liver regeneration
Next, we asked how TMEM9 contributes to hepatic regeneration. Given that active Wnt/β-catenin signaling in pericentral hepatocytes, which are TMEM9+ cells (10, 11), and the downregulation of β-catenin target genes (Gs, Tbx3, and Cyp2e1) by Tmem9 KO, we assessed the activity of Wnt/β-catenin signaling in the setting of liver injury by CCl4 administration. Similar to TMEM9 upregulation (Figure 1E), β-catenin expression immediately increased and remained high until 2–3 dpi in normal mouse liver tissue, accompanied by increased Cyclin D1 (Figures 3A and 3B; Supplementary Figure 2A). Next, we analyzed the gene expression of several developmental pathways, including Wnt, Notch, Hedgehog, Hippo, and BMP. We found that Tmem9 KO mouse liver tissue exhibited downregulation of Wnt/β-catenin signaling target genes (Axin2, Cd44, and Ccnd1) after CCl4 administration, whereas other target genes were not markedly affected (Figure 3C). Similarly, Tmem9 KO mouse liver tissue displayed lower expression levels of Cyclin D1, Cd44, β-catenin, active β-catenin, and Axin2, compared with WT liver tissue (Figures 3D–3G and Supplementary Figure 2B), indicating that TMEM9 reinforces Wnt/β-catenin signaling in the setting of liver injury. TMEM9 hyperactivates Wnt/β-catenin signaling via APC degradation in colorectal cancer (23), which next led us to ask whether TMEM9 negatively modulates APC even during liver regeneration. Indeed, we found higher levels of APC in Tmem9 KO liver tissue, compared with WT liver tissue (Figures 3H–3L). Conversely, CCl4-induced β-catenin upregulation was reduced in Tmem9 KO liver, compared with WT (Figure 3L). These data indicate that TMEM9 promotes APC downregulation during hepatic regeneration. In addition to CCl4 injury model, we also employed partial hepatectomy (PH) model to address the role of Tmem9 in liver regeneration. However, unlike CCl4 injury, PH did not upregulate Tmem9 expression, and Tmem9 KO did not impair PH-induced liver regeneration (Supplementary Figure 3), indicating the essential role of Tmem9 in liver regeneration specifically in CV injury. Together, these results suggest that TMEM9 is required for the activation of Wnt/β-catenin signaling in regenerating liver tissue upon CV injury.
Figure 3. TMEM9-activated Wnt/β-catenin signaling during liver regeneration.
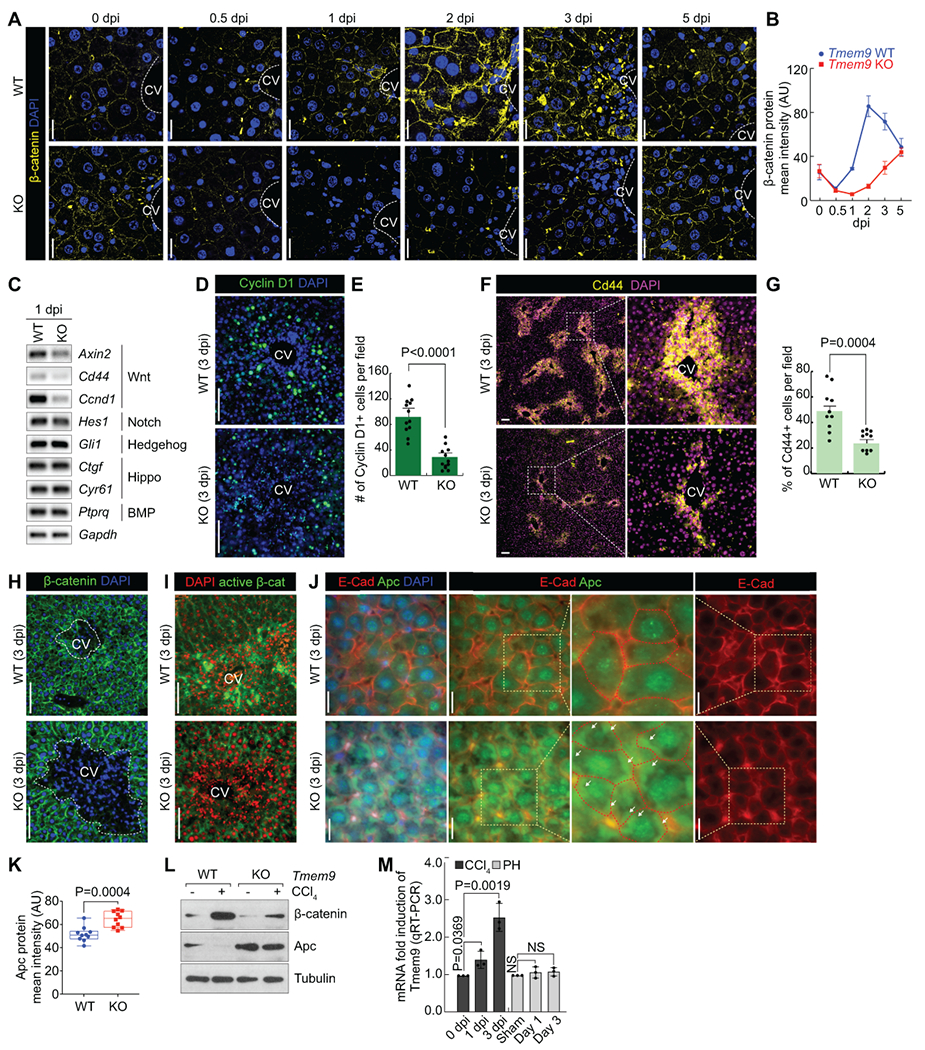
(A and B) Wnt/β-catenin signaling is activated during liver regeneration. IHC for β-catenin in Tmem9 WT and KO liver tissue after CCl4 administration (A). To monitor β-catenin kinetics (B), liver tissues were collected at indicated time. scale bars=20μm.
(C-G) Tmem9 KO downregulates Wnt/β-catenin signaling activity in regenerating liver tissue. Semiquantitative reverse transcriptase PCR of Tmem9 WT and KO mouse liver tissue at 1 dpi (C). IF staining for β-catenin target proteins Cyclin D1 (D) and Cd44 (F). Quantification of Cyclin D1+ (E) and Cd44+ (G) cells in Tmem9 WT and KO liver at 3 dpi. Scale bars=100μm.
(H and I) β-catenin levels are lower in Tmem9 KO mouse liver tissue than in Tmem9 WT tissue after hepatic injury. IHC for β-catenin (H) and active β-catenin (I). Scale bars=100μm.
(J-L) Tmem9 KO upregulates Apc during liver regeneration following CCl4-induced injury. IHC for E-cadherin and Apc (J). Arrows indicate the cytoplasmic accumulation of APC. Quantification of Apc by confocal microscopy (K). IB assays using Tmem9 WT andTmem9 KO hepatocytes (L). Scale bars=20μm.
(M) Increased Tmem9 by CV region damage. After CCl4 administration or PH, tissues were collected at indicated time point. qRT-PCR for Tmem9.
Representative images of three experiments with similar results; error bars show mean ± SD from at least three independent experiments; PH: Partial hepatectomy; two-sided unpaired t-test; NS: Not significant.
Expression of TMEM9 in HCC
Wnt signaling is hyperactivated in HCC, with frequent mutations in the core components of Wnt signaling (β-catenin/CTNNB1, AXIN, and APC)(15, 16). Having determined that TMEM9 is required for Wnt/β-catenin signaling activation during hepatic regeneration (see Figure 3) with the implication of Wnt signaling hyperactivation, we explored the roles of TMEM9 in activating Wnt/β-catenin signaling in HCC. Interestingly, in silico analysis showed the upregulation of TMEM9 transcripts in HCC compared with normal liver samples (Figure 4A). Additionally, TMEM9 gene was frequently amplified in HCC (Figure 4B), along with transcriptional upregulation of TMEM9 (Figure 4C). HCC PDX samples also showed the amplification of TMEM9 gene (57%; 24/42) (Figure 4D). cBioPortal (https://www.cbioportal.org) analysis showed that 32% of HCC samples displayed either gene amplification or transcriptional upregulation of TMEM9, which was mutually exclusive to mutations of β-catenin/CTNNB1 (28%) (Figure 4E, Supplementary Table S1). We also observed that β-catenin transactivates TMEM9 expression in HepG2 cells (Supplementary Figure 4A–4C), consistent with colorectal cancer study . IHC of HCC and normal tissue microarrays confirmed the upregulation of TMEM9 in HCC compared with normal liver tissues (Figures 4F, 4G, and Supplementary Table S2). Furthermore, we examined the expression of TMEM9 in liver cirrhosis patient samples and found no significant association of TMEM9 expression with cirrhosis (Supplementary Figures 4C and 4D). These results suggest that TMEM9 expression is highly upregulated in HCC, which implies the oncogenic roles of TMEM9 in hepatic tumorigenesis.
Figure 4. Expression of TMEM9 in HCC.

(A) TMEM9 transcripts are upregulated in HCC (cBioPortal analysis, www.cBioportal.org).
(B-D) TMEM9 gene amplification in HCC. cBioPortal analysis of TCGA, PanCan, and AMC data sets (B). Relationship between gene amplification and transcriptional upregulation of TMEM9 in HCC (C). TMEM9 amplification in HCC PDX (www.Picb.ac.cn/PDXliver, D).
(E) Comparative visualization of HCC-related genetic and transcriptional alterations (cBioPortal analysis).
(F, G) TMEM9 is upregulated in HCC. IHC for TMEM9 in normal liver and HCC tissue microarrays (F). Quantitative analysis of TMEM9 expression in normal liver and HCC samples (G). Representative images of three experiments with similar results. Scale bars=100μm.
Nuclear translocation of β-catenin by TMEM9-downregulated APC
Given the overexpression of TMEM9 in HCC, we questioned the potential oncogenic roles of TMEM9 in HCC. To address this, we examined the effect of TMEM9 depletion on developmental pathways implicated in HCC. Quantitative reverse transcriptase PCR (qRT-PCR) analysis showed that TMEM9 depletion by shTMEM9 downregulated Wnt/β-catenin target genes (AXIN2 and CD44) in Huh-7 cells (Figure 5A), indicating possible impacts of TMEM9 on Wnt/β-catenin signaling in HCC. Because mutations of β-catenin/CTNNB1 frequently occur in HCC (15, 16), we used β-catenin/CTNNB1 WT Huh-7 cells and HepG2 cells carrying the exon 3-4 deleted β-catenin/CTNNB1 allele to examine the impacts of TMEM9 on Wnt/β-catenin signaling. In both β-catenin/CTNNB1 WT and mutant cells, TMEM9 depletion (by shTMEM9) decreased β-catenin reporter activity (TOP/FOP FLASH luciferase) and AXIN2 expression compared with control cells (Figures 5B and 5C). Also, TMEM9 depletion downregulated the levels of total and active β-catenin protein (Figure 5D) with cell growth inhibition (Supplementary Figure S5A), indicating that TMEM9 might be required for the maintenance of Wnt/β-catenin signaling activity regardless of β-catenin status (WT vs. mutant). Next, we directly tested the effect of TMEM9 on other mutant β-catenin cells (S33Y [non-phosphorylated active form] and ΔN [deletion of N-terminus 47 amino acids]), compared with WT cells. Surprisingly, TMEM9 depletion by shRNA decreased the levels of WT, S33Y, and ΔN β-catenin (Figure 5E). Additionally, the rescue of WT and mutant β-catenin activated Wnt/β-catenin signaling and increased HCC cell proliferation, which was decreased by shTMEM9 (Figure 5F and Supplementary Figures S5B–S5D). These results suggest that TMEM9 activates Wnt/β-catenin signaling independently of oncogenic mutations in β-catenin.
Figure 5. Nuclear translocation of β-catenin by TMEM9-downregulated APC.

(A) TMEM9 depletion by shTMEM9 decreases expression of Wnt signaling target genes. 24 h after transfection, Huh-7 cells were analyzed by quantitative reverse transcriptase PCR (qRT-PCR).
(B and C) TMEM9 depletion decreases β-catenin transcriptional activity. Huh-7 and HepG2 cells were transfected with β-catenin reporter plasmids (pMega-TOP/FOP FLASH) for qRT-PCR for AXIN2 (B) and luciferase assays (C).
(D and E) TMEM9 depletion downregulates β-catenin protein in HCC cells. After 24-h transfection, endogenous β-catenin (D) and ectopically expressed β-catenin (wild type [WT] and mutants [S33Y and ΔN], E) were assessed by IB assays.
(F) shTMEM9 reduces WT and mutant β-catenin transcriptional activity. Huh-7 and HepG2 cells were transfected with WT or mutant (ΔN) β-catenin plasmid. Luciferase (TOP/FOP FLASH) was measured to determine β-catenin transcriptional activity.
(G and H) TMEM9 depletion inhibits nuclear translocation of β-catenin. IF staining for β-catenin and APC (G). After 24-h transfection with WT or ΔN β-catenin plasmid, HepG2 cells were fractionated into cytosolic and nuclear fractions, followed by IB (H). Scale bars=20μm.
(I and J) shTMEM9 increases interaction between APC and β-catenin. Illustration of APC-β-catenin binding assay using Duolink PLA (proximity light assay; I, left). Green PLA fluorescence indicates APC-β-catenin interaction (I, right). Quantification of PLA (J). Scale bars=10μm.
(K) Binding between APC and WT or mutant β-catenin. Co-IP analysis.
(L-O) Depletion of TMEM9 restrains nuclear translocation of β-catenin. HepG2 cells were transfected with a tdTomato-3xFLAG-β-catenin plasmid (WT or ΔN) for 24 h. Nuclear fluorescence of β-catenin was bleached for 1000sec, followed by visualization (L and N) and quantification for mean intensity (M and O) by confocal microscopy every 10 s. Quantification was normalized by the nuclear mean intensity of 0 s. R values indicate the velocity of β-catenin nuclear translocation. Scale bars=5μm.
Representative images of three experiments with similar results; error bars show mean ± SD from at least three independent experiments; two-sided unpaired t-test. Vec, empty vector plasmid-transfected control.
The protein destruction complex composed of APC, CK1, AXIN, and GSK3 negatively regulates β-catenin by phosphorylation-mediated degradation of the β-catenin protein (5). Serine/threonine residues of the N-terminus of β-catenin (Ser33, Ser37, Thr41, and Ser45) are sequentially phosphorylated by CK1 and GSK3, which is recognized by a β-TrCP E3 ligase. TMEM9 depletion decreased both WT and mutant β-catenin (S33Y and ΔN), implying that further negative regulator of β-catenin. Indeed, proteasome inhibitor (MG132) upregulated WT and mutant β-catenin in APC KO-HepG2 cells. Also, we found ubiquitination of WT and mutant β-catenin in TMEM9-diminished cells (Supplementary Figures S5E–S5G) resulting in the possibility for APC destruction complex-independent proteasomal β-catenin degradation. Moreover, the downregulation of S33Y and ΔN-β-catenin by TMEM9 depletion might be explained by downstream events such as nuclear translocation of β-catenin or β-catenin’s transcriptional activity. Thus, we asked whether TMEM9 affects the nuclear translocation of β-catenin. Immunofluorescence (IF) staining and cytosol/nuclear fractionation assays showed that endogenous β-catenin was mainly localized in the nuclei of HepG2 cells, and this nuclear localization of β-catenin was decreased by TMEM9 depletion (Figures 5G, 5H, and Supplementary Figure S5H). These results indicate that TMEM9 is required for nuclear translocation of β-catenin independently of mutations in β-catenin.
In addition to its role in β-catenin degradation, APC has been shown to control the level of nuclear β-catenin (28, 29). TMEM9 also downregulates APC via v-ATPase-mediated lysosomal degradation (23). Therefore, we next asked whether TMEM9 depletion increases APC-β-catenin interaction regardless of the mutation status of β-catenin. As expected, the Duolink PLA (proximity ligation assay)(30) revealed that shTMEM9 increased the association between APC and β-catenin in HepG2 cells (Figures 5I and 5J). Co-immunoprecipitation (co-IP) assays also showed the interaction between APC and β-catenin (WT, S33Y, and ΔN; Figure 5K and Supplementary Figures S1F). Because it has been reported that APC induces cytoplasmic retention of β-catenin (31), we examined the effect of shTMEM9 on nuclear localization of WT and mutant β-catenin using fluorescence recovery after photobleaching (FRAP) assay. Intriguingly, shTMEM9 decreased the nuclear import of WT and mutant β-catenin (Figures 5L–5O). These results suggest that TMEM9 increases the nuclear localization of β-catenin through inhibiting APC-induced β-catenin cytoplasmic retention.
TMEM9-induced activation and nuclear translocation of β-catenin by lysosomal degradation of APC
Previously, we found that TMEM9 activates v-ATPase, which subsequently induces vesicular acidification for the lysosomal protein degradation of APC (23). Given the increased APC and the retention of β-catenin by TMEM9 depletion in HCC cells (Figure 5), we tested whether lysosomal protein degradation of APC mediates TMEM9-activated β-catenin using lysosomal inhibitors. Indeed, the lysosomal protease inhibitors CA074 (an inhibitor of cathepsin B [CTB])(32) and SID26681509 (an inhibitor of cathepsin L) (33) decreased levels of both WT and mutant β-catenin protein, AXIN2 expression, luciferase activity, and HCC cell proliferation—but increased the level of APC protein—in Huh-7 and HepG2 cells (Figures 6A, 6B, and Supplementary Figure 6). Likewise, lysosomal protease inhibitors also downregulated the level of ectopically expressed WT and mutant β-catenin (Figure 6C). Because of the cytosolic retention of β-catenin by APC (see Figures 5L–5O), we also assessed the impacts of lysosomal protease inhibitors on the nuclear translocation of β-catenin. Cytosolic and nuclear fractionation followed by immunoblot (IB) and IF assays showed that lysosomal protease inhibitors prevented nuclear translocation of WT and mutant β-catenin (Figures 6D and 6F). We also found that lysosomal protease inhibitors augmented APC-β-catenin interaction in HepG2 cells (PLA; Figures 6G and 6H). Furthermore, we tested whether APC protein is localized in the lysosome. Indeed, PLA assay showed co-localization of APC with LAMP1, a lysosomal marker, and this co-localization was increased by TMEM9 depletion (Figures 6I and 6J) and lysosomal protease inhibitors (Figures 6K and 6L). These results suggest that TMEM9 downregulates APC via lysosomal degradation of APC protein.
Figure 6. TMEM9-induced activation and nuclear translocation of β-catenin by lysosomal degradation of APC.

(A) Lysosomal protease inhibitors downregulate β-catenin protein. HepG2 cells were treated with CA074 (5μM) or SID (SID26681509; 50nM) for 12h. IB assays.
(B) Lysosomal protease inhibitors decrease β-catenin transcriptional activity. qRT-PCR for AXIN2.
(C) Lysosomal protease inhibitors deplete ectopically expressed WT and mutant β-catenin. After transfection with WT, S33Y, or ΔN β-catenin plasmid, HepG2 cells were treated with CA074 or SID.
(D-F) Lysosomal protease inhibitors restrict nuclear translocation of β-catenin. Cytosol/nuclear fractionation (D and E). IF staining for β-catenin and APC (F).
(G and H) Lysosomal protease inhibitors increase interaction between APC and β-catenin. Duolink assays (G) and quantification of PLA (H).
(I and J) TMEM9 depletion upregulates lysosomal APC. Duolink assay using APC and LAMP1 antibodies (I). LAMP1 served as a lysosomal marker. Quantification of APC-LAMP1 co-localization (J).
(K and L) Lysosomal protease inhibitors increase lysosomal APC. Duolink assay (K) and quantification of interaction between APC and LAMP1 (L).
(M) TMEM9 depletion downregulates cathepsin maturation. HepG2 cells were transfected with shTMEM9 or treated with indicated v-ATPase and lysosomal protease inhibitors BAF (bafilomycin A1, 3nM), CMA (concanamycin A, 0.3nM), or KM91104 (10μM).
Representative images of three experiments with similar results; scale bars = 20μm; error bars show mean ± SD from at least three independent experiments; Two-sided unpaired t-test; LE: long exposure; SE: short exposure.
TMEM9 facilitates the assembly of v-ATPase and increases the vesicular acidification, which is essential for lysosome-mediated protein degradation (34, 35). CTB is a widely presented lysosomal cysteine protease, and loss of CTB leads to lysosomal dysfunction (36, 37). CTB is produced from a large precursor form (pro-CTB) to form a mature cathepsin containing a heavy and a light chain. Thus, we examined the impacts of TMEM9 on lysosomal integrity by measuring the amount of mature CTB. In HepG2 cells, TMEM9 depletion and inhibitors of v-ATPase and lysosomal protease decreased the level of mature CTB (Figure 6M), indicating that TMEM9 is required for lysosomal function. These results suggest that TMEM9 activates β-catenin via lysosomal degradation of APC in HCC.
Suppression of hepatic tumorigenesis by blockade of TMEM9-v-ATPase-APC signaling axis
Having determined the oncogenic roles of TMEM9-vATPass signaling axis in liver cancer cell proliferation, next, we tested the impacts of blockade of TMEM9-v-ATPase axis on in vivo tumorigenesis. We subcutaneously injected HepG2 cells (shCtrl, shTMEM9, shTMEM9 + β-catenin, and APC WT vs. KO) into the immunocompromised mice and monitor tumor growth. We found that TMEM9-depleted HepG2 (shTMEM9) cells showed the inhibition of tumor development, compared to the control (shCtrl) HepG2 cells (Figure 7A). Similarly, AXIN2, a β-catenin target gene, expression was reduced by TMEM9 depletion, while APC was upregulated (Figure 7A). Next, we asked whether TMEM9 depletion-induced HCC growth inhibition is due to the decreased Wnt/β-catenin signaling activity by the rescue experiments. Indeed, β-catenin ectopically expressing cells restored in vivo tumor development suppressed by TMEM9 depletion, along with the upregulation of AXIN2 (Figure 7B). However, APC level was not affected by β-catenin ectopic expression (Figure 7B). Additionally, we tested the effects of v-ATPase inhibitor, BAF, on in vivo tumorigenesis. Similar to TMEM9 knock-down using shRNA, BAF treatment inhibited in vivo tumorigenesis, AXIN2 expression, but increased APC (Figure 7C). Next, to test whether the tumor inhibitory effects of BAF is due to APC upregulation, we established APC KO-HepG2 cells (Supplementary Figure 7A and 7B) and tested whether BAF also inhibits tumorigenesis of APC KO cells. Consistent with the in vitro results (Supplementary Figure 7C and 7D), BAF did not suppress in vivo tumorigenesis of APC KO and did not affect AXIN2 expression (Figure 7D). These results strongly suggest the tumorigenic roles of TMEM9-v-ATPase axis in HCC via Wnt/β-catenin signaling hyperactivation.
Figure 7. Inhibition of in vivo hepatic tumorigenesis by blockade of TMEM9-v-ATPase axis.

(A-D) Inhibition of in vivo tumor development by TMEM9 depletion (shTMEM9) or BAF. HepG2 (shCtrl vs. shTMEM9, A; Vector control vs. β-catenin [shTMEM9-HepG2], B; Vehicle vs. BAF, APC WT, C; APC KO, D]) cells were subcutaneously injected into left and right flank of immunocompromised mice (BALB/c nude). Three weeks after injection, tumorigenesis was analyzed by assessing tumor weight, Wnt/β-catenin signaling activity (qRT-PCR for AXIN2), and APC protein expression (IB). BAF (0.5 mg/kg): every 3 days for 21 days; NS: Not significant.
DISCUSSION
Herein, we found that TMEM9 contributes to hepatic regeneration and tumorigenesis via activating the Wnt/β-catenin pathway.
The APC destruction complex downregulates β-catenin via phosphorylation (Ser 34, Ser 37, Thr 41, and Ser 45 of β-catenin)-based proteasomal degradation (5). APC also modulates the nuclear import and export of β-catenin, leading to cytoplasmic retention of β-catenin to inhibit Wnt target gene transactivation (28, 29, 31). In cancer cells, nonsense mutations in APC or missense mutations in β-catenin/CTNNB1 hyperactivate Wnt/β-catenin target gene transactivation, contributing to tumorigenesis. The conventional view on APC loss-activated β-catenin in cancer cells is that inactivation of APC stabilizes the β-catenin protein and subsequent nuclear translocation of β-catenin. However, recent studies suggested that β-catenin can still be inhibited in cells carrying mutations in APC or β-catenin/CTNNB1 (22). In agreement with these studies, we recently reported that mutant APC protein binds to and interferes with β-catenin-mediated gene transactivation (23). Consistent with this, we here found that APC protein induces the cytosolic retention of both WT and mutant β-catenin in HCC cells (Figures 6L–6O), which indicates that APC downregulates Wnt/β-catenin signaling activity via dual regulatory mechanisms: proteasomal degradation and cytosolic retention of β-catenin.
Wnt signaling is activated in pericentral hepatocyte during liver homeostasis and regeneration (10–12). In a CCl4-induced liver injury model using Tmem9 WT and Tmem9 KO mice, we found that TMEM9+ cells were mainly located among the pericentral hepatocytes, and the number of TMEM9+ cells increased upon liver injury. While Tmem9 KO mice are viable without defects in liver development (23), Tmem9 KO showed defects in hepatocyte regeneration with the defects on Wnt signaling activation upon liver injury. Consistent with HCC results, Tmem9 KO liver tissue showed higher expression of APC than did Tmem9 WT liver tissue. Additionally, the CCl4-induced liver injury model showed increased β-catenin levels through APC downregulation. It should also be noted that Tmem9 is not upregulated by PH injury and Tmem9 KO does not affect PH-induced regeneration. These results suggest that TMEM9 downregulates APC to activate Wnt/β-catenin signaling for hepatic regeneration somehow specific to CV injury.
The metabolic zonation, a spatial and functional organization of liver, is controlled by several processes including APC protein (38–42). However, it remains unclear how the level of APC is modulated for metabolic zonation. TMEM9-induced lysosomal degradation of APC might explain the differential gradient of APC protein for zonation. However, despite the upregulation of Apc by Tmem9 genetic ablation (Figure 3L, Supplementary Figure 1A), Tmem9 KO mice displays no aberrant liver defects in development and homeostasis, which might be due to the intrinsic compensatory mechanisms of Wnt/β-catenin signaling (43–45). However, upon CCl4 injury when immediate cell mitogenic and reprogramming occur, Tmem9 KO mice displayed the overall downregulation and delayed expression of Wnt/β-catenin signaling and hepatocyte markers, along with the impaired zonation (Figures 2G, 3A, and Supplementary Figure 1I). Thus, the process that TMEM9 transactivated by β-catenin amplifies Wnt/β-catenin signaling is specifically required for metabolic zonation only in regeneration condition but not during liver development and homeostasis.
v-ATPase inhibitors such as bafilomycin A1, concanamycin A, and KM91104 exhibit tumor-suppressive effects in various human cancers (23, 46–50). Interestingly, these cancers exhibit amplified TMEM9 expression; for instance, HCC cells frequently harbor TMEM9 gene amplification (Figure 4). Thus, it is plausible that v-ATPase inhibition may be an effective therapeutic option for TMEM9- and Wnt/β-catenin signaling-dependent cancers.
In the MVBs, v-ATPase controls vesicle acidification. Among of the serine, aspartic, and lysosomal cysteine proteases, lysosomal cysteine cathepsins such as cathepsin B and L require an acidic environment to be active (34, 35), which suggests that v-ATPase likely plays a crucial role in activating cathepsin in the lysosomes. Indeed, shTMEM9-reduced v-ATPase activity and v-ATPase inhibitors restrained cathepsin maturation (Figure 6M). Because cathepsin B and L are highly expressed in human cancer and associated with cell invasion through matrix metalloproteinase activation (51, 52), the potential roles of TMEM9 in cancer invasion and metastasis need to be addressed in future. Moreover, given that v-ATPase positively controls MVB acidification and lysosomal degradation, other signaling pathways also may be affected by TMEM9. Despite our main focus on Wnt/β-catenin signaling here, other signaling possibly controlled by TMEM9-v-ATPase-lysosome should also be studied.
Together, our results revealed that TMEM9 induces lysosomal degradation of APC through promoting lysosomal protease maturation, which is indispensable for liver regeneration and tumorigenesis. Moreover, we discovered that APC inhibits Wnt signaling by cytosolic retention of β-catenin independently of β-catenin’s oncogenic mutations.
MATERIALS AND METHODS
Constructs
All gene expression plasmids were constructed from cDNA library or open reading frame sources using PCR and cloned into FLAG-pcDNA, FLAG-dTomato-pcDNA, FLAG-pLenti, or FLAG-Tomato-pLenti mammalian expression plasmids. Mutant constructs were generated by site-directed mutagenesis using PCR.
Tmem9 knockout mouse animal model
As previous our study, Tmem9 KO mouse was established (23). All animal procedures were performed based on the guidelines by Association for the Assessment and Accreditation of Laboratory Animal Care (AAALAC), and the Institutional (MD Anderson Cancer Center) approved protocols (IACUC00001141; University of Texas MD Anderson Cancer Center Institutional Animal Care and Use Committee). The study is compliant with all relevant ethical regulations regarding animal research.
Mammalian cell culture
Cell lines (Huh-7, HepG2, and HEK293T) were purchased from American Type Culture Collection and maintained in Dulbecco’s modified Eagle medium (containing 10% fetal bovine serum and 1% Penicillin-Streptomycin). Mycoplasma screening was performed using MycoAlert™ Mycoplasma Detection Kit (Lonza). Lentiviral plasmids encoding shRNAs were purchased from Open Biosystems. To establish cell lines stably expressing shRNAs or genes, each cell line was transduced with lentiviruses, and selected by puromycin (1–2μg/ml) for two days. The following reagents were also used: CCl4 (Sigma), bafilomycin A1 (Wako), concanamycin A (Sigma), KM91104 (Millipore), CA074 (R&D systems), and SID26681509 (R&D systems).
Reporter assays
The reporter plasmids, pMegaTOPFLASH and pMegaFOPFLASH, were transiently transfected with pSV40-Renilla plasmid (internal control) and analyzed using Dual Luciferase assay system (Promega).
APC somatic cell targeting
The APC KO cells were established using the clustered regularly interspaced short palindromic repeat (CRISPR) using a lentiviral CRISPR v2 vector (Addgene). The lentiviral plasmid contains two expression cassettes, hSpCas9 and the chimeric guide RNA (gRNA) where oligos were cloned, based on the protospacer adjacent motif (PAM) on the target site. The lentiCRISPRv2 plasmids were transfected into HEK293T cells along with pCMV-ΔR8.2 dVPR and pCMV-VSVG plasmids for lentiviral packaging. HCC cell lines were then transduced with lentiviruses and selected in puromycin for 72hr. After selection, three clonally selected cell lines were used for analysis. APC KO was confirmed by IB. APC gRNA sequences: #1: 5’- AGGATGGCTGCAGCTTCATA -3’; #2: 5’- GCAAGTTGAGGCACTGAAGA -3’.
Immunofluorescence staining and immunohistochemistry
Using PEI, cells were transiently transfected with plasmids. Cells grown on glass coverslips were washed and fixed in 4% paraformaldehyde for 10min at 4°C. After blocking with 5% goat serum in PBS for 30min, antibodies were treated for immunostaining cells. Liver samples were fixed in 10% neutral buffered formalin overnight and embedded in paraffin. Tissue samples were then sectioned (5μm) and H&E staining was performed following standard procedure. For IHC, slides were deparaffinized, rehydrated, processed for antigen retrieval, blocked, incubated with primary antibody, and fluorescence-conjugated secondary antibody. Next, slides were mounted with DAPI (Invitrogen), sealed, and photographed using an inverted microscope (Zeiss; AxioVision). For comparison among the experiment groups, images were captured with the same exposure time. The detailed information regarding antibodies can be found in Supplementary Table 3.
Gene expression analysis
RNAs were extracted by TRIzol (Invitrogen) and converted to cDNAs using iScript cDNA synthesis kit (Biorad) with 1μg of RNA. For gene expression analysis, semiquantitative RT-PCR or qRT-PCR was performed. qRT PCR results were quantified by comparative 2−ΔΔCt methods (Applied Biosystems). For internal controls, HPRT1 was used. The primer sequences can be found in Supplementary Table 4.
Immunoblotting and immunoprecipitation
Whole-cell lysates of mammalian cells were prepared using NP-40 lysis buffer (0.5% NP-40, 1.5mM MgCl2, 25mM HEPES, 150mM KCl, 10% glycerol, 1mM phenylmethylsulfonyl fluoride, 12.7mM benzamidine HCl, 0.2mM aprotinin, 0.5mM leupeptin and 0.1mM pepstatin A) for 20min at 4°C followed by centrifugation (14,000rpm for 10min). Supernatants were denatured in 5xSDS sample buffer (200mM Tris-HCl pH6.8, 40% glycerol, 8% SDS, 200mM dithiothreitol and 0.08% bromophenol blue) at 95°C for 5min followed by SDS–PAGE. For immunoblot blocking and antibody incubation, 0.1% non-fat dry milk in Tris-buffered saline and Tween-20 (25mM Tris-HCl pH8.0, 125mM NaCl and 0.5% Tween-20) was used. SuperSignal West Pico (Thermo; 34087) and Femto (Thermo; 34095) reagents were used to detect horseradish peroxidase-conjugated secondary antibodies. For immunoprecipitation, cell lysates were incubated with 20μl of magnetic beads (Sigma; M8823) for 2hr. Immunoprecipitates were then washed with cell lysis buffer 3 times, eluted using an SDS sample buffer, and analyzed using immunoblotting. The detailed information regarding antibodies can be found in Supplementary Table 3.
Duolink assays
For the visualization of protein interaction in situ, cells were seeded onto the cover glass. After fixation with 4% paraformaldehyde for 5min, cells were permeabilized with 0.01% Triton-x100 for Duolink assays, as manufacturer’s (Sigma; DUO92101) recommended protocol: blocking, primary antibody reaction, (+) and (−) probe reaction, ligation, polymerization, and amplification.
Acute CCl4 injury mouse model
Male mice (older than eight weeks) were injected with carbon tetrachloride (CCl4; Sigma) for acute liver injury model. CCl4 was dissolved in corn oil (Fisher) at a final concentration of 20% (v/v) for intraperitoneal administration (1 ml/kg). Mice were sacrificed at various time points, and liver tissues were collected for further analyses.
Partial hepatectomy (PH) in mouse model
PH (70% removal of the total liver) or sham control surgery was performed with isoflurane anesthesia. Three to four WT C57BL/B6 and Tmem9 KO (6 months of age) mice were used for PH according to guidelines of the institutional Animal Care and Use Committee of the University of Texas, MD Anderson Cancer Center. Mice were sacrificed at 1 or 3 days after surgery and remnant liver tissue was collected. Flash-frozen liver tissues were processed for RNA isolation, protein extraction, IHC, and mass.
Xenograft assays
Mice (BALB/c nude) were subcutaneously injected with 5 x 10⁶ cells of HepG2 cells (shCtrl vs. shTMEM9; shTMEM9-Vec vs. shTMEM-β-catenin; Ctrl vs. BAF [APC WT and KO]). After 3 weeks for adaptation, tumors were collected for assessment of tumor weight, RNA, IB, and IHC.
Fluorescence recovery after photobleaching (FRAP) assay
HepG2 cells were grown on chambered coverglass (Nunc) and were transfected with dTomato-β-catenin (WT and ΔN). After 24hr transfection in 5% CO2 at 37 °C, images were acquired by using a LSM880-Airyscan confocal (Zeiss). For photobleaching experiments, samples were photobleached with a solid-state laser using LSM880-Airyscan confocal. Nucleus was bleached for 1000s at 100% laser power. The samples were imaged every 5s for 60s with a separate 555nm laser. The average fluorescence mean intensities of nucleus were measured using Zen software (Zeiss). The recovery curves shown are the averages of at least 8 cells from at least three independent experiments.
In silico analysis of TMEM9 expression and genetic alteration
TMEM9 expression in HCC cells was analyzed in the cBioPortal (www.cbioportal.org), and PICB database (www.Picb.ac.cn/PDXliver). The cBioPortal analysis was performed with default options using TCGA (provisional and PanCancer) and AMC data sets for gene alterations (mutations and copy number change).
Chromatin immunoprecipitation assay (ChIP)
Cells were crosslinked with 1% formaldehyde for 15 min at room temperature, and quenched by glycine (0.125 M). After washing with cold PBS, tissues were incubated with lysis buffer (0.5% NP-40, 25mM HEPES, 150mM KCl, 1.5mM MgCl2, 10% glycerol and KOH pH 7.5) containing protease inhibitor for 15 min on ice. Cell lysates were centrifuged (1,677g for 5min), and supernatants were discarded. Cell pellets were subjected to sonication with nuclear lysis buffer (50mM Tris pH8.0, 10mM EDTA, 1% SDS), using Bioruptor Plus sonication device (Diagnode). Supernatant were diluted 20 times in IP buffer (50mM Tris pH8.0, 150mM NaCl, 0.5% NP-40, protease inhibitor mixtures) and subjected to IP with antibody against β-catenin or normal rabbit IgG. Immunoprecipitates were also washed serially with ChIP-RIPA lysis buffer, high salt (50mM Tris, pH8.0; 500mM NaCl; 0.1% SDS, 0.5% deoxycholate, 1% NP-40 and 1mM EDTA), LiCl wash buffer (50mM Tris, pH8.0; 1 mM EDTA, 250mM LiCl; 1% NP-40 and 0.5% deoxycholate) and Tris-EDTA buffer. Finally, immunoprecipitate crosslinking was reversed by incubation at 65 °C overnight and treated with RNase A and proteinase K to extract DNA. The ChIP PCR primer sequences of TMEM9 promoter amplicons was described in a previous paper. GAPDH promoter amplicons served as negative control.
Cell proliferation assays
Using plasmids stably expressing cells, the number of cells was counted using hematocytometer as indicated growth days.
Statistics and reproducibility
The Student’s t-test was used for comparisons of two groups (n≥3). P values less than 0.05 were considered significant. Error bars indicate standard deviation, which indicates standard error of the mean. All experiments were performed three or more times with similar results, independently under identical or similar conditions.
Antibody information
See Supplementary Table 3 for a complete list of antibodies.
Primer information
See Supplementary Table 4 for a complete list of primers.
Supplementary Material
ACKNOWLEDGMENTS
We are grateful to Pierre D. McCrea for constructive comments on the manuscript. This work was supported by grants to the Cancer Prevention and Research Institute of Texas (RP140563 and RP200315 to J.-I.P.), the National Institutes of Health (R01 CA193297–01 to J.-I.P.), the Department of Defense Peer Reviewed Cancer Research Program (CA140572 to J.-I.P.), an Institutional Research Grant (MD Anderson Cancer Center to J.-I.P.), and SPORE in endometrial cancer (P50 CA83639 to J.-I.P.). The core facility (DNA sequencing and Genetically Engineered Moue Facility) was supported by the National Cancer Institute Comprehensive Cancer Center Grant to MD Anderson Cancer Center (P30 CA016672).
Footnotes
DECLARATION OF INTERESTS
The authors declare no competing interests.
REFERENCES
- 1.Schlessinger K, Hall A, Tolwinski N. Wnt signaling pathways meet Rho GTPases. Genes Dev 2009;23:265–277. [DOI] [PubMed] [Google Scholar]
- 2.Ouyang H, Zhuo Y, Zhang K. WNT signaling in stem cell differentiation and tumor formation. J Clin Invest 2013;123:1422–1424. [DOI] [PMC free article] [PubMed] [Google Scholar]
- 3.Russell JO, Monga SP. Wnt/beta-Catenin Signaling in Liver Development, Homeostasis, and Pathobiology. Annu Rev Pathol 2018;13:351–378. [DOI] [PMC free article] [PubMed] [Google Scholar]
- 4.Clevers H, Nusse R. Wnt/beta-catenin signaling and disease. Cell 2012;149:1192–1205. [DOI] [PubMed] [Google Scholar]
- 5.Stamos JL, Weis WI. The beta-catenin destruction complex. Cold Spring Harb Perspect Biol 2013;5:a007898. [DOI] [PMC free article] [PubMed] [Google Scholar]
- 6.Monga SP, Pediaditakis P, Mule K, Stolz DB, Michalopoulos GK. Changes in WNT/beta-catenin pathway during regulated growth in rat liver regeneration. Hepatology 2001;33:1098–1109. [DOI] [PMC free article] [PubMed] [Google Scholar]
- 7.Sekine S, Gutierrez PJ, Lan BY, Feng S, Hebrok M. Liver-specific loss of beta-catenin results in delayed hepatocyte proliferation after partial hepatectomy. Hepatology 2007;45:361–368. [DOI] [PubMed] [Google Scholar]
- 8.Sodhi D, Micsenyi A, Bowen WC, Monga DK, Talavera JC, Monga SP. Morpholino oligonucleotide-triggered beta-catenin knockdown compromises normal liver regeneration. J Hepatol 2005;43:132–141. [DOI] [PubMed] [Google Scholar]
- 9.Tan X, Behari J, Cieply B, Michalopoulos GK, Monga SP. Conditional deletion of beta-catenin reveals its role in liver growth and regeneration. Gastroenterology 2006;131:1561–1572. [DOI] [PubMed] [Google Scholar]
- 10.Wang B, Zhao L, Fish M, Logan CY, Nusse R. Self-renewing diploid Axin2(+) cells fuel homeostatic renewal of the liver. Nature 2015;524:180–185. [DOI] [PMC free article] [PubMed] [Google Scholar]
- 11.Itoh T, Kamiya Y, Okabe M, Tanaka M, Miyajima A. Inducible expression of Wnt genes during adult hepatic stem/progenitor cell response. FEBS Lett 2009;583:777–781. [DOI] [PubMed] [Google Scholar]
- 12.Zhao L, Jin Y, Donahue K, Tsui M, Fish M, Logan CY, Wang B, et al. Tissue Repair in the Mouse Liver Following Acute Carbon Tetrachloride Depends on Injury-Induced Wnt/beta-Catenin Signaling. Hepatology 2019;69:2623–2635. [DOI] [PMC free article] [PubMed] [Google Scholar]
- 13.Nejak-Bowen KN, Monga SP. Beta-catenin signaling, liver regeneration and hepatocellular cancer: sorting the good from the bad. Semin Cancer Biol 2011;21:44–58. [DOI] [PMC free article] [PubMed] [Google Scholar]
- 14.Fukutomi T, Zhou Y, Kawai S, Eguchi H, Wands JR, Li J. Hepatitis C virus core protein stimulates hepatocyte growth: correlation with upregulation of wnt-1 expression. Hepatology 2005;41:1096–1105. [DOI] [PubMed] [Google Scholar]
- 15.de La Coste A, Romagnolo B, Billuart P, Renard CA, Buendia MA, Soubrane O, Fabre M, et al. Somatic mutations of the beta-catenin gene are frequent in mouse and human hepatocellular carcinomas. Proc Natl Acad Sci U S A 1998;95:8847–8851. [DOI] [PMC free article] [PubMed] [Google Scholar]
- 16.Satoh S, Daigo Y, Furukawa Y, Kato T, Miwa N, Nishiwaki T, Kawasoe T, et al. AXIN1 mutations in hepatocellular carcinomas, and growth suppression in cancer cells by virus-mediated transfer of AXIN1. Nat Genet 2000;24:245–250. [DOI] [PubMed] [Google Scholar]
- 17.Monga SP. beta-Catenin Signaling and Roles in Liver Homeostasis, Injury, and Tumorigenesis. Gastroenterology 2015;148:1294–1310. [DOI] [PMC free article] [PubMed] [Google Scholar]
- 18.Vermeulen L, De Sousa EMF, van der Heijden M, Cameron K, de Jong JH, Borovski T, Tuynman JB, et al. Wnt activity defines colon cancer stem cells and is regulated by the microenvironment. Nat Cell Biol 2010;12:468–476. [DOI] [PubMed] [Google Scholar]
- 19.Goentoro L, Kirschner MW. Evidence that fold-change, and not absolute level, of beta-catenin dictates Wnt signaling. Mol Cell 2009;36:872–884. [DOI] [PMC free article] [PubMed] [Google Scholar]
- 20.Koo BK, Spit M, Jordens I, Low TY, Stange DE, van de Wetering M, van Es JH, et al. Tumour suppressor RNF43 is a stem-cell E3 ligase that induces endocytosis of Wnt receptors. Nature 2012;488:665–669. [DOI] [PubMed] [Google Scholar]
- 21.Jung YS, Jun S, Lee SH, Sharma A, Park JI. Wnt2 complements Wnt/beta-catenin signaling in colorectal cancer. Oncotarget 2015;6:37257–37268. [DOI] [PMC free article] [PubMed] [Google Scholar]
- 22.Voloshanenko O, Erdmann G, Dubash TD, Augustin I, Metzig M, Moffa G, Hundsrucker C, et al. Wnt secretion is required to maintain high levels of Wnt activity in colon cancer cells. Nat Commun 2013;4:2610. [DOI] [PMC free article] [PubMed] [Google Scholar]
- 23.Jung YS, Jun S, Kim MJ, Lee SH, Suh HN, Lien EM, Jung HY, et al. TMEM9 promotes intestinal tumorigenesis through vacuolar-ATPase-activated Wnt/beta-catenin signalling. Nat Cell Biol 2018;20:1421–1433. [DOI] [PMC free article] [PubMed] [Google Scholar]
- 24.Kveine M, Tenstad E, Dosen G, Funderud S, Rian E. Characterization of the novel human transmembrane protein 9 (TMEM9) that localizes to lysosomes and late endosomes. Biochem Biophys Res Commun 2002;297:912–917. [DOI] [PubMed] [Google Scholar]
- 25.Boll M, Weber LW, Becker E, Stampfl A. Mechanism of carbon tetrachloride-induced hepatotoxicity. Hepatocellular damage by reactive carbon tetrachloride metabolites. Z Naturforsch C 2001;56:649–659. [DOI] [PubMed] [Google Scholar]
- 26.Fausto N, Campbell JS. The role of hepatocytes and oval cells in liver regeneration and repopulation. Mech Dev 2003;120:117–130. [DOI] [PubMed] [Google Scholar]
- 27.Oh SH, Witek RP, Bae SH, Zheng D, Jung Y, Piscaglia AC, Petersen BE. Bone marrow-derived hepatic oval cells differentiate into hepatocytes in 2-acetylaminofluorene/partial hepatectomy-induced liver regeneration. Gastroenterology 2007;132:1077–1087. [DOI] [PubMed] [Google Scholar]
- 28.Henderson BR, Fagotto F. The ins and outs of APC and beta-catenin nuclear transport. EMBO Rep 2002;3:834–839. [DOI] [PMC free article] [PubMed] [Google Scholar]
- 29.Henderson BR. Nuclear-cytoplasmic shuttling of APC regulates beta-catenin subcellular localization and turnover. Nat Cell Biol 2000;2:653–660. [DOI] [PubMed] [Google Scholar]
- 30.Weibrecht I, Leuchowius KJ, Clausson CM, Conze T, Jarvius M, Howell WM, Kamali-Moghaddam M, et al. Proximity ligation assays: a recent addition to the proteomics toolbox. Expert Rev Proteomics 2010;7:401–409. [DOI] [PubMed] [Google Scholar]
- 31.Wang L, Liu X, Gusev E, Wang C, Fagotto F. Regulation of the phosphorylation and nuclear import and export of beta-catenin by APC and its cancer-related truncated form. J Cell Sci 2014;127:1647–1659. [DOI] [PubMed] [Google Scholar]
- 32.Montaser M, Lalmanach G, Mach L. CA-074, but not its methyl ester CA-074Me, is a selective inhibitor of cathepsin B within living cells. Biol Chem 2002;383:1305–1308. [DOI] [PubMed] [Google Scholar]
- 33.Shah PP, Wang T, Kaletsky RL, Myers MC, Purvis JE, Jing H, Huryn DM, et al. A small-molecule oxocarbazate inhibitor of human cathepsin L blocks severe acute respiratory syndrome and ebola pseudotype virus infection into human embryonic kidney 293T cells. Mol Pharmacol 2010;78:319–324. [DOI] [PMC free article] [PubMed] [Google Scholar]
- 34.Turk V, Stoka V, Vasiljeva O, Renko M, Sun T, Turk B, Turk D. Cysteine cathepsins: from structure, function and regulation to new frontiers. Biochim Biophys Acta 2012;1824:68–88. [DOI] [PMC free article] [PubMed] [Google Scholar]
- 35.Turk B, Turk D, Turk V. Lysosomal cysteine proteases: more than scavengers. Biochim Biophys Acta 2000;1477:98–111. [DOI] [PubMed] [Google Scholar]
- 36.Qi X, Man SM, Malireddi RK, Karki R, Lupfer C, Gurung P, Neale G, et al. Cathepsin B modulates lysosomal biogenesis and host defense against Francisella novicida infection. J Exp Med 2016;213:2081–2097. [DOI] [PMC free article] [PubMed] [Google Scholar]
- 37.Cermak S, Kosicek M, Mladenovic-Djordjevic A, Smiljanic K, Kanazir S, Hecimovic S. Loss of Cathepsin B and L Leads to Lysosomal Dysfunction, NPC-Like Cholesterol Sequestration and Accumulation of the Key Alzheimer’s Proteins. PLoS One 2016;11:e0167428. [DOI] [PMC free article] [PubMed] [Google Scholar]
- 38.Benhamouche S, Decaens T, Godard C, Chambrey R, Rickman DS, Moinard C, Vasseur-Cognet M, et al. Apc tumor suppressor gene is the “zonation-keeper” of mouse liver. Dev Cell 2006;10:759–770. [DOI] [PubMed] [Google Scholar]
- 39.Cheng X, Kim SY, Okamoto H, Xin Y, Yancopoulos GD, Murphy AJ, Gromada J. Glucagon contributes to liver zonation. Proc Natl Acad Sci U S A 2018;115:E4111–E4119. [DOI] [PMC free article] [PubMed] [Google Scholar]
- 40.Kietzmann T Metabolic zonation of the liver: The oxygen gradient revisited. Redox Biol 2017;11:622–630. [DOI] [PMC free article] [PubMed] [Google Scholar]
- 41.Kietzmann T Liver Zonation in Health and Disease: Hypoxia and Hypoxia-Inducible Transcription Factors as Concert Masters. Int J Mol Sci 2019;20. [DOI] [PMC free article] [PubMed] [Google Scholar]
- 42.Matz-Soja M, Hovhannisyan A, Gebhardt R. Hedgehog signalling pathway in adult liver: a major new player in hepatocyte metabolism and zonation? Med Hypotheses 2013;80:589–594. [DOI] [PubMed] [Google Scholar]
- 43.Clevers H Wnt/beta-catenin signaling in development and disease. Cell 2006;127:469–480. [DOI] [PubMed] [Google Scholar]
- 44.MacDonald BT, Tamai K, He X. Wnt/beta-catenin signaling: components, mechanisms, and diseases. Dev Cell 2009;17:9–26. [DOI] [PMC free article] [PubMed] [Google Scholar]
- 45.Rochard L, Monica SD, Ling IT, Kong Y, Roberson S, Harland R, Halpern M, et al. Roles of Wnt pathway genes wls, wnt9a, wnt5b, frzb and gpc4 in regulating convergent-extension during zebrafish palate morphogenesis. Development 2016;143:2541–2547. [DOI] [PMC free article] [PubMed] [Google Scholar]
- 46.Yan Y, Jiang K, Liu P, Zhang X, Dong X, Gao J, Liu Q, et al. Bafilomycin A1 induces caspase-independent cell death in hepatocellular carcinoma cells via targeting of autophagy and MAPK pathways. Sci Rep 2016;6:37052. [DOI] [PMC free article] [PubMed] [Google Scholar]
- 47.Forgac M A new twist to V-ATPases and cancer. Oncotarget 2018;9:31793–31794. [DOI] [PMC free article] [PubMed] [Google Scholar]
- 48.Kulshrestha A, Katara GK, Ibrahim SA, Riehl V, Sahoo M, Dolan J, Meinke KW, et al. Targeting V-ATPase Isoform Restores Cisplatin Activity in Resistant Ovarian Cancer: Inhibition of Autophagy, Endosome Function, and ERK/MEK Pathway. J Oncol 2019;2019:2343876. [DOI] [PMC free article] [PubMed] [Google Scholar]
- 49.Whitton B, Okamoto H, Packham G, Crabb SJ. Vacuolar ATPase as a potential therapeutic target and mediator of treatment resistance in cancer. Cancer Med 2018;7:3800–3811. [DOI] [PMC free article] [PubMed] [Google Scholar]
- 50.Michel V, Licon-Munoz Y, Trujillo K, Bisoffi M, Parra KJ. Inhibitors of vacuolar ATPase proton pumps inhibit human prostate cancer cell invasion and prostate-specific antigen expression and secretion. Int J Cancer 2013;132:E1–10. [DOI] [PMC free article] [PubMed] [Google Scholar]
- 51.Sudhan DR, Siemann DW. Cathepsin L targeting in cancer treatment. Pharmacol Ther 2015;155:105–116. [DOI] [PMC free article] [PubMed] [Google Scholar]
- 52.Aggarwal N, Sloane BF. Cathepsin B: multiple roles in cancer. Proteomics Clin Appl 2014;8:427–437. [DOI] [PMC free article] [PubMed] [Google Scholar]
Associated Data
This section collects any data citations, data availability statements, or supplementary materials included in this article.