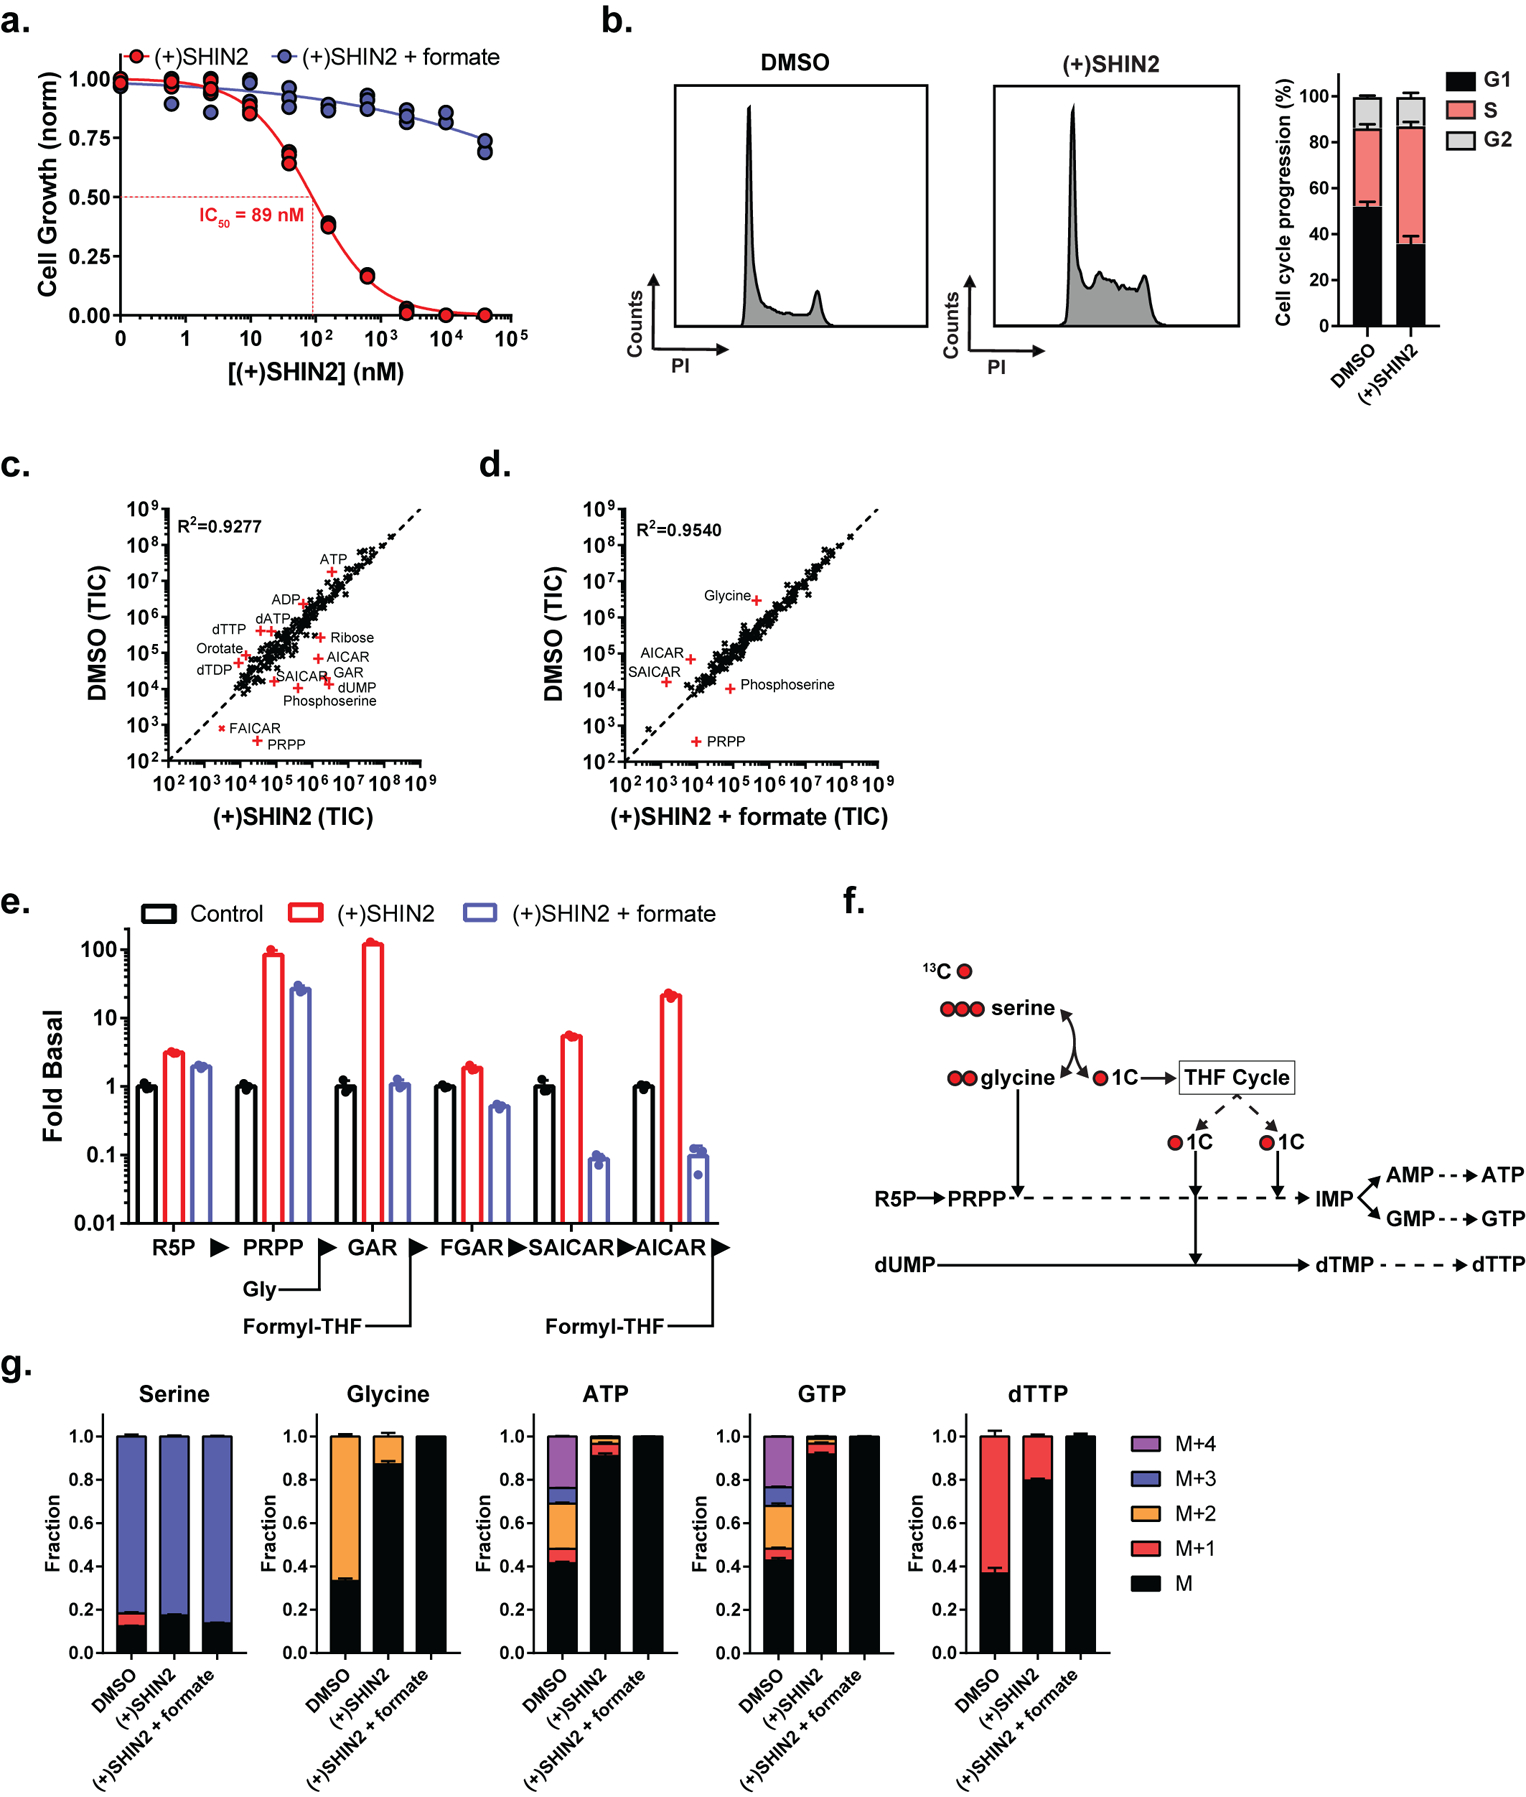
Figure 2. SHIN2 blocks growth of the human T-ALL cell line Molt4 via SHMT inhibition.

(a) Growth of Molt4 cells (n=3). (b) Analysis of (+)SHIN2 effects on cell cycle in Molt4 cells (48 h after treatment). Representative cell cycle histograms are shown on the panels on the left; quantification is shown on the panel on the right (mean ± SD, n=3). (c-e) Metabolite levels in Molt4 cells (24 h drug exposure) (mean, n=3). In c and d, metabolites displaying a fold-change > 4 are highlighted in red. (f) Schematic showing the incorporation of U-13C-serine-derived carbons into downstream products. (g) Metabolite labeling patterns in Molt4 cells after a 6 h incubation with U-13C-serine (mean ± SD, n=3). (+)SHIN2 concentration is 2 μM, formate concentration is 1 mM.
