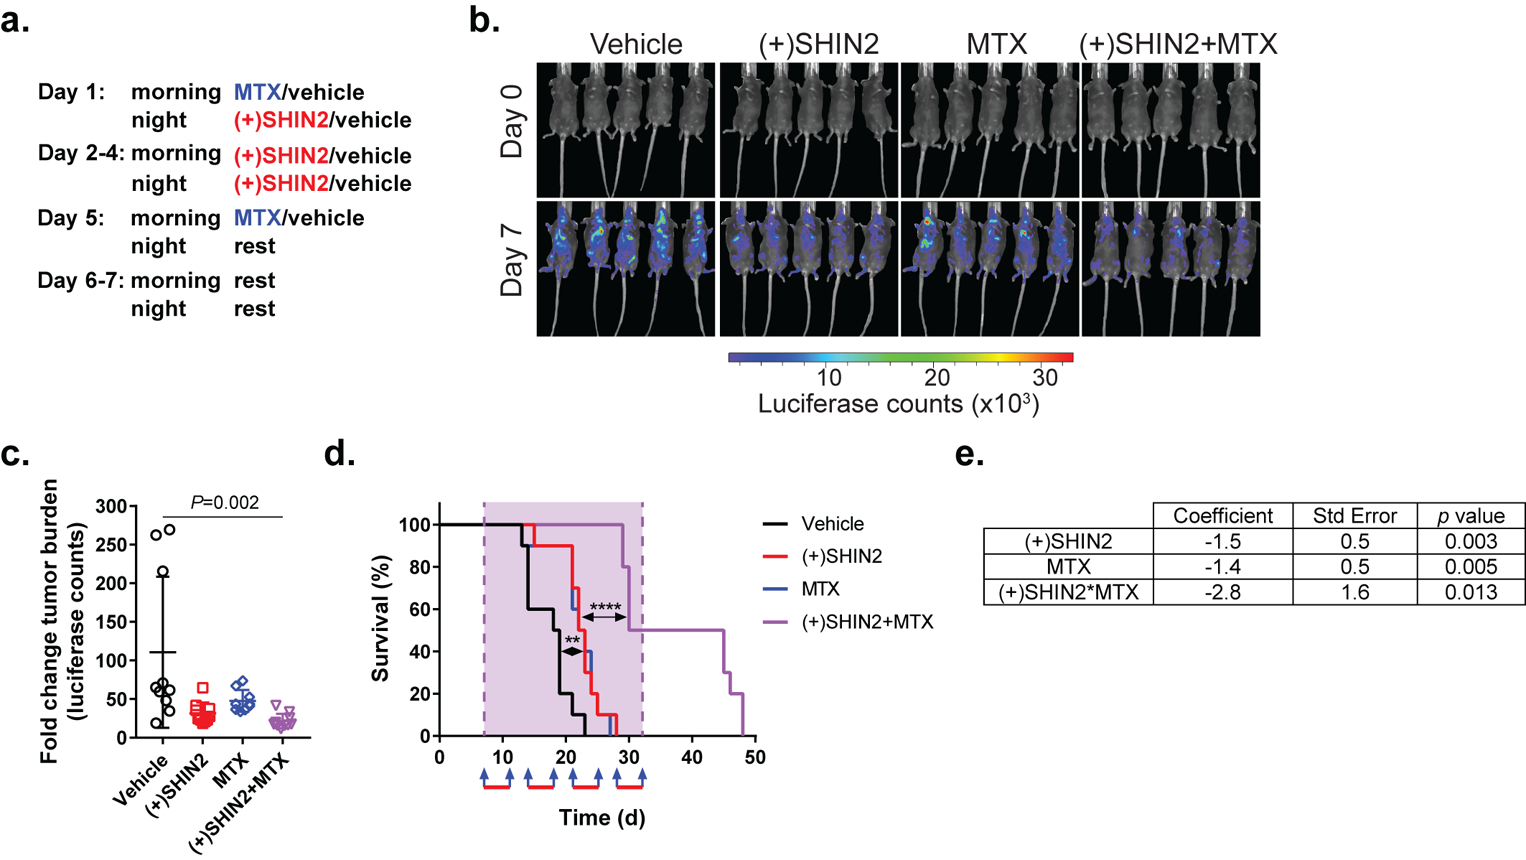
Figure 5. Synergistic in vivo antileukemic effect of SHIN2 and methotrexate in mouse primary leukemia.

. (a) Dosage regimen for each of the 4 cycles of treatment. Methotrexate was administered at 10 mg/kg (IP injection), (+)SHIN2 was administered at 200 mg/kg (IP injection). (b-c) Representative images from five treated mice (b) and quantification (c) of changes in tumor burden as assessed by bioimaging in mice allografted with NOTCH1-induced mouse leukemia cells after one treatment cycle (n=10 for all groups). P value was calculated using one-way ANOVA testing. (d) Kaplan-Meier survival curves (n=10 for all groups, log-rank test; **P<0.01, ****P<0.001). Blue arrows represent methotrexate injection. Red bars represent days under (+)SHIN2 treatment. (e) Results of a Cox regression with Firth’s penalized likelihood including the terms for (+)SHIN2, methotrexate and the interaction between (+)SHIN2 and methotrexate. For each parameter the actual value of the coefficient, the standard error and the p value (null hypothesis coefficient = 0) are shown.
