

Abstract
Advanced hepatitis B virus (HBV)‐related hepatocellular carcinoma HCC with poor prognosis is often associated with chronic inflammation, immune tolerance, and marked heterogeneity. The interleukin‐6 (IL‐6)/JAK/STAT3 signal pathways play multiple regulatory roles in modulating inflammation and immunity in cancers. Polarization of myeloid‐derived suppressor cells (MDSCs) is involved in HBV‐related immunosuppression and CD8+ T‐cell activation through ERK/IL‐6/STAT3. Icaritin is a small molecule that has displayed anticancer activities through IL‐6/JAK/STAT3 pathways in tumor cells and immune cells including CD8+ T cells, MDSCs, neutrophils, and macrophages. This study aimed to confirm icaritin immunomodulation in advanced HBV‐related HCC patients with poor prognosis. Immunomodulation of MDSCs was evaluated in BALB/c mice in vivo. Immunomodulation of serum cytokines and a panel of immune checkpoint proteins were assessed in HBV‐related, histologically confirmed HCC patients. Poor prognostic characteristics included HBV infection, bulky tumors, Child‐Pugh B classification, and metastasis. Clinical end‐points included safety, tumor response, and overall survival (OS). Icaritin treatment‐induced dynamics of serum cytokines IL‐6, IL‐8, IL‐10, and tumor necrosis factor‐α, and soluble immune checkpoint proteins TIM3, LAG3, CD28, CD80, and CTLA‐4 were assessed. No grade III/IV treatment‐related adverse events were observed. Time‐to‐progression was significantly associated with the prognostic factors. Improved survival was observed in the advanced HCC patients with dynamic changes of cytokines, immune checkpoint proteins, and immune cells. Median OS (329‐565 days) was significantly correlated with baseline hepatitis B surface antigen positivity, cytokines, tumor neoantigens, and Stenotrophomonas maltophilia infection. Composite biomarker scores of high‐level α‐fetoprotein and T helper type I (Th1)/Th2 cytokines associated with favorable survival warrant further clinical development of icaritin as an alternative immune‐modulatory regimen to treat advanced HCC patients with poor prognosis.
Keywords: dynamic biomarker, HBV‐related advanced HCC, icaritin anticancer immunomodulation, survival
Advanced hepatitis B virus (HBV)‐related hepatocellular carcinoma (HCC) is often associated with chronic inflammation, liver injury, immune tolerance, and poor clinical outcomes. Due to drug toxicity and side‐effects, current targeted drugs including sorafenib are unfortunately not favorable treatment options, particularly for those advanced HCC patients with poor prognosis. Herbal‐derived natural small molecule icaritin showed anticancer immunomodulatory efficacy with superior safety and improved survival associated with coordinated immune dynamics. Composite biomarkers associated with favorable survival would warrant further clinical development of icaritin as an alternative “natural compound” immune therapy in advanced HBV‐related HCC patients with poor prognosis.

1. INTRODUCTION
More than 50% of worldwide new cases of hepatocellular carcinoma (HCC) and deaths occur in China and other developing countries. In these countries, HCC is often associated with chronic hepatitis B virus (HBV) infection. 1 , 2 In general, monotherapies such as sorafenib have shown limited efficacy, particularly in advanced HCC due to the coexisting HBV infection 3 and immune tolerance. 2 , 4 Hepatitis B virus infection often results in liver dysfunction and is accompanied by chronic inflammation, liver injury, and metabolic and immune disorders. 5 Therefore, more favorable treatments that are less toxic, less expensive, and readily available, and which involve predictive biomarkers, are in high demand, particularly for advanced HCC patients with poor prognosis in developing countries. 6 , 7
Targeted monotherapy trials often show improvements in the marginal tumor response rate (overall response rate less than 10%) and overall survival (OS) 8 in advanced HCC patients compared to other solid tumors. Immune checkpoint inhibitors that include nivolumab have shown promising response and durable survival in advanced HCC. 9 Recently, small molecule‐based immunotherapies have attracted increasing attention as they could offer some advantage over protein‐based therapies. The advantages include high cell permeability, organ specificity, and oral administration. In contrast to protein‐based immune checkpoint inhibitors, small molecule immunotherapy has been underappreciated despite the unique advantages 10 and great potential to treat advanced HBV‐related HCC patients. 1 , 11
The interleukin‐6 (IL‐6)/JAK/STAT3 signal pathways have multiple regulatory roles in modulating the complex networking of antiinflammation and immunity in cancers. 12 These pathways are particularly relevant to chronic inflammation, degree of tumor progression, and immune tolerance in advanced HBV‐related HCC. 1 , 13 , 14 , 15 Interleukin‐6/JAK/STAT3 and nuclear factor‐κB antiinflammatory pathways have attracted increasing attention in cancer immune therapy. 16 , 17 More recent studies showed that the polarization of monocytic myeloid‐derived suppressor cells (MDSCs) is involved in HBV‐related immunosuppression and CD8+ T cell activation through the ERK/IL‐6/STAT3 signal pathways. 15
Cytokines associated with the IL‐6/JAK/Stat3 pathways, 11 , 18 , 19 cross‐talk between immune cells 12 , 16 and immune checkpoints 20 could offer alternative immunomodulatory approaches to treat HBV‐related HCC patients. Antiinflammatory agents such as flavonoids have an array of immunomodulatory anticancer activities that include immune modulation of the balance between T helper type I (Th1) and type II (Th2) cells. 10 , 21 Accumulating evidence has revealed multiple anticancer activities of the novel small molecule icaritin through the IL‐6/JAK//STAT3 pathways, 1 , 22 Th1/Th2‐mediated immunomodulation (Figures 1 and S1) and blocking α‐fetoprotein (AFP) in vitro and in vivo. 23 , 24 , 25 , 26 Immunomodulatory anticancer activities induced by icaritin treatment include promotion of CD8+ T cell infiltration and reduced expression of programmed death‐ligand 1 (PD‐L1) in (MDSCs) and neutrophils, 27 and the modulation of immunosuppressive MDSCs 28 , 29 , 30 and Th1/Th2 associated cytokines (Figure S1).
Figure 1.
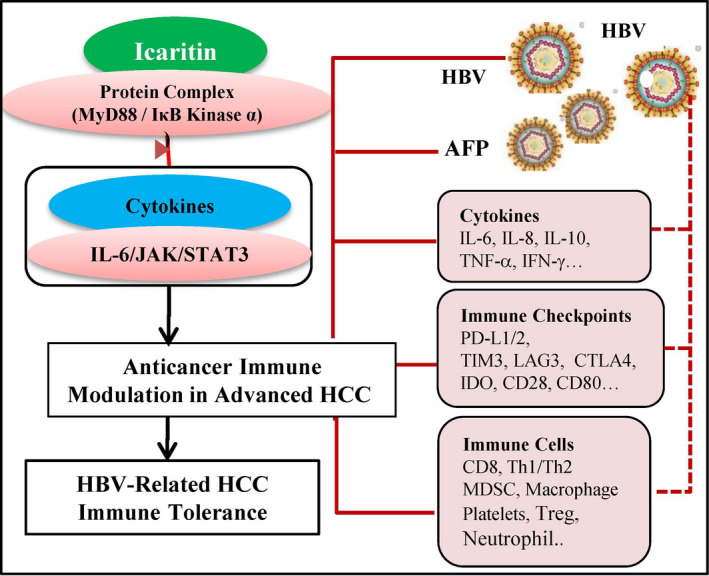
Immunomodulatory anticancer activities of icaritin in advanced hepatitis B virus (HBV)‐related hepatocellular carcinoma (HCC). Icaritin interacts with the protein complex and modulates interleukin‐6 (IL‐6)/JAK/Stat3 associated multiple immunomodulatory anticancer pathways including HBV‐related HCC immune tolerance, cytokines, immune checkpoints, immune cells, and tumor antigen α‐fetoprotein (AFP). CTLA‐4, cytotoxic T‐lymphocyte associated protein 4; IDO, indoleamine 2,3‐dioxygenase; IFN‐γ, interferon‐y; LAG3, lymphocyte‐activation gene‐3; MDSC, myeloid‐derived suppressor cell; PD‐L, programmed cell death‐ligand; Th, T helper; TIM3, T‐cell immunoglobulin mucin‐3; TNF‐α, tumor necrosis factor‐α; Treg, regulatory T cell
Preliminary safety and clinical efficacy were observed in advanced HCC patients after icaritin treatment with two doses of 600 mg and 800 mg b.i.d. 30 In this study, we further explored the anticancer immunomodulatory activities of icaritin with one fixed dose (600 mg b.i.d). Tumor response, OS, and dynamics of immune biomarkers that included cytokines, soluble immune checkpoint proteins, and immune cells were assessed in advanced HBV‐related HCC patients with poor prognosis. The treatment options for such patients are currently limited.
2. MATERIALS AND METHODS
2.1. Patients
This was an open‐label, single‐arm multicenter phase II study of icaritin in advanced refractory HCC patients. From November 2013 to August 2015, 68 HCC patients were enrolled in five research hospitals in China. Most of the patients were advanced with HBV infection (91.2%) and poor prognostic characteristics. The trial was approved by the ethics committee of each hospital. Written informed consent was obtained from all patients before study enrolment. Patient eligibility and safety monitoring were carried out based on clinical protocol. Tumors were assessed with computed tomography (CT) or magnetic resonance imaging (MRI) at baseline and every 2 months thereafter until confirmed disease progression. 31
Eligible patients (age, 18‐75 years) had histologically or cytologically confirmed HCC, at least one lesion of 10 mm or more in the longest diameter with CT according to RECIST 1.1 and no previous systematic treatment history. Advanced HCC patients were not candidates for surgery or any interventional therapy through the hepatic artery, nor had they undergone surgery or any interventional therapy through the hepatic artery more than 4 weeks before enrolment with disease progression. Patients were unlikely the preferred candidates for sorafenib or oxaliplatin (FOLFOX4) doublet chemotherapy and did not have access to immune checkpoint inhibitors during the course of study. Patients were scored as Child‐Pugh class A or B (ie either albumin or hemachrome greater than 2), had an ECOG performance status of 0‐1, and a life expectancy of at least 12 weeks. Patients had not received targeted chemotherapy or immunotherapies. If patients received radiation therapy or underwent surgery, the treatment must have been at least 4 weeks prior to enrolment, and any treatment‐related adverse events (AEs) and wounds must have resolved. If the patient received adjuvant chemotherapy, the treatment course (2 months or more) had to be completed before enrolment. Eligible patients also met the following criteria: hemoglobin, 90 g/dL or higher (no blood transfusion or treatment with blood products or hematopoietic growth factor within 14 days prior to enrolment); neutrophil cell count, 1.5 × 10⁹/L or higher; platelet count, 80 × 109/L or higher; albumin, 29 g/dL or higher (no albumin transfusion or blood products within 14 days prior to enrolment); alanine aminotransferase (ALT) and aspartate aminotransferase (AST) less than five times the upper limit of normal (ULN); total bilirubin and serum creatinine, 1.5 times ULN or less; and HBV‐DNA, less than 104 copies/mL. All enrolled patients received 600 mg icaritin capsule b.i.d. orally. Treatment was continued until disease progression, intolerable toxicity, and/or patient discontinuation. The medication could be continued after confirmed disease progression at the discretion of the treating physician given the extremely limited treatment methods for HCC. The study was carried out in accordance with good clinical practice and complied with the Declaration of Helsinki. The study protocol was approved by an institutional review board or ethical committees, and written informed consent was obtained from all participating patients for enrolment, data collection, human subject tissue sample collection, and data publication.
2.2. Assessments of safety and tumor response
Safety assessments were undertaken continuously during treatment and for up to 30 days after the last dose. The safety analyses included treatment‐emergent AE, which included laboratory abnormalities, skin and subcutaneous tissue disorders, metabolism disorders, and gastrointestinal disorders. Safety evaluations included AE monitoring and reporting by the NCI’s Common Terminology Criteria for Adverse Events (version 4.03) from the time of study drug administration until the end of the study. Adverse events, serious AEs (SAEs), drug‐related AEs, and abnormal laboratory findings were included in the safety analysis. Patients were followed up concerning survival every 3 months.
The investigational assessment of tumor response was undertaken using RECIST 1.1. Tumors were assessed with CT or MRI at baseline and then every 2 months until confirmed disease progression. 31 Each scan was assessed by both an investigator and an expert radiologist. Overall survival was measured from the date of enrolment until death from any cause. Time‐to‐progression (TTP) was defined as the time from the date of enrolment to confirmed disease progression. Kaplan‐Meier survival analysis was undertaken to explore the baseline levels and dynamic changes of biomarkers correlated with immunomodulatory anticancer activities in icaritin‐treated HCC patients. Disease control rate was evaluated by calculating the percentage of subjects showing a complete response (CR), partial response (PR), or stable disease (SD).
2.3. Biomarker analyses of cytokines and immune checkpoint proteins
Tumor biopsies or surgically removed tumor tissues were collected and used for biomarker analyses. These included PD‐L1 immunohistochemistry (SP263 kits; Ventana Medical Systems), next‐generation sequencing, and NanoString gene expression analysis. Baseline levels of serum AFP and HBV surface antigen (HBsAg), and HBV viral DNA loads were collected from clinical laboratory data and analyzed retrospectively. Pre‐ (D0) and post‐treatment (D56) levels of serum cytokines including IL‐6, IL‐8, IL‐10, interferon‐γ (IFN‐γ), tumor necrosis factor‐α (TNF‐α), IL‐1β, IL‐2, IL‐12p70, and IL‐13 were measured by a commercial multispot assay system (Meso Scale Discovery). The commercially available ProcartaPlex Luminex Technology of immunoassays of immunooncology checkpoint panel including B‐ and T‐lymphocyte attenuator (BTLA), glucocorticoid‐induced tumor necrosis factor receptor, herpesvirus entry mediator, indoleamine 2,3‐dioxygenase, lymphocyte‐activation gene 3 (LAG3), programmed cell death protein 1 (PD‐1), PD‐L1, PD‐L2, T‐cell immunoglobulin mucin‐3 (TIM3), CD27, CD28, CD80, 4‐1BB, and CTL‐associated protein 4 (CTLA‐4) were measured according to the manufacturer’s instructions (Thermo Fisher Scientific). Dynamic changes of serum biomarkers and subgroups of advantaged and disadvantaged patients were defined by treatment‐induced dynamics of the changes (increase, decrease, and stable combined with D56 median as the cut‐off) modified according to the method of the immune‐inflammation index predictive model described in advanced HCC. 32 The advantaged patient group was defined as the time of treatment day 56 (D56), serum biomarker level with decreases 30% of baseline or higher, or which remained below median levels after treatment (D56). The disadvantaged patient group was defined as the time point of treatment (D56) serum biomarker level with increase 30% above baseline or higher, or which remained above the median levels of treatment (D56). Peripheral serum biomarkers (AFP, IL‐6, IL‐8, IL‐10, TNF‐α, and IFN‐γ) were included in a composite biomarker score (CBS) as previously described. 33 For each biomarker, a score of 1 was assigned if any respective baseline biomarker level fell within the ranges of AFP (100 ng/mL or higher), IL‐6 (less than 2.2 pg/mL), IL‐8 (less than 28.7 pg/mL), IL‐10 (less than 0.365 pg/mL), TNF‐α (less than 3.5 pg/mL), and IFN‐γ (5.0 pg/mL or higher). Patients with different CBSs were assessed by Kaplan‐Meier survival analysis. The DNA sequence of the microbiome of Stenotrophomonas maltophilia was detected using whole‐genome sequencing (WGS) analysis with the blood DNA followed by PCR assay validation (see Doc. [Link], [Link]).
2.4. Programmed cell death‐ligand 1‐positive MDSC infiltration in vivo
H22 cells were amplified in BALB/c mice by i.p. transplantation of 1 × 10⁵ H22 tumor cells in 0.5 mL PBS for 2 weeks. H22 ascitic cells were collected and suspended followed by s.c. injection of 2 × 10⁵ cells into the right flank area of BALB/c mice. After 5 days of tumor cell transplantation, the tumor‐bearing mice were randomly divided into the treatment group (icaritin, 70 mg/kg) given by an oral gavage once daily and the control group dosed with placebo. 34 The mice were killed when tumors reached a diameter of approximately 1.5 cm or when any signs of pain and distress were noted. Tumors were measured according to volumes and fresh weights (g) in the treatment and control groups. Flow cytometry assays were undertaken to analyze the infiltration of immune cells, such as PD‐L1+ MDSCs, as previously described. 34
2.5. Statistical analyses
Continuous variables are presented as the mean and SD. Categorical variables are presented as frequencies (percentages). The safety profile evaluation was mainly based on the incidence of drug‐related AEs. Subjects showing PR or SD were counted, and percentages were calculated. All P values were based on a two‐sided test and differences of 0.05 or lower were considered statistically significant. Overall survival curves were estimated by the Kaplan‐Meier method and results are presented as the median and 95% confidence intervals (CI). A log‐rank test was used to compare survival curves in different subgroups and aimed to identify biomarkers that could further differentiate treatment effects. All statistical analyses were undertaken using GraphPad Prism, SAS 9.4, and R 3.4.3 (R Foundation for Statistical Computing). We affirm that all authors had access to study data and reviewed and approved the final manuscript.
3. RESULTS
3.1. Patient characteristics, safety, and treatment response
Between 1 November 2013, and 14 July 2015, 68 patients with advanced HCC with or without HBV/hepatitis C virus infection were enrolled and treated with oral icaritin at 600 mg b.i.d. in a phase IIB trial (https://clinicaltrials.gov/ct2/show/NCT01972672, see Figure S1). The cut‐off date for data collection and analysis was 27 February 2017. The baseline characteristics of the advanced HCC with poor prognosis are summarized in Table S1. Most advanced stage HCC patents with a high risk of poor prognosis have no optimal treatment options, or are not considered by their physician to be candidates for sorafenib therapy. The poor prognosis baseline characteristics of the enrolled advanced HCC patients included HBV infection in 91.2% (62 of 68), portal vein tumor thrombus (III/IV) in 25% (17 of 68), bulky tumor in 26.5% (including giant tumor mass (more than 50%) in 18 of 68, Barcelona Clinic Liver Cancer (BCLC) stage C in 92.6% (63 of 68), and extrahepatic metastasis in 85.3% (58 of 68, most with metastasis to lymph node and lung sites) (Table S1). None of the previously treated patients had received sorafenib or any other chemotherapy, and most had a serum AFP level above the ULN (92.6%, 63 of 68). These poor prognosis baseline characteristics of advanced HCC were compared (Table S1) with the Oriental and Reflect studies. 35 , 36 , 37
A total of 59 AEs (86.8%, grade I/II) were observed, along with 18 SAEs (26.5%) and 18 drug‐related AEs (26.5%) (Table S2). Importantly, no grade III/IV treatment‐related AEs occurred in any of the 68 advanced HCC patients. The most common drug‐related AEs included laboratory abnormalities such as increased AST, ALT, and ALP (14 of 68, 20.6%), leukopenia, skin or subcutaneous disorders (2 of 68, 2.9%), and metabolic or nutrition disorders (2 of 68, 2.9%). No immune‐related AEs, such as interstitial lung disease, body mass changes, thyroid dysfunction, or immune checkpoint inhibitor treatment‐related liver injuries and immune hepatitis, 38 , 39 , 40 were observed.
Conventional tumor response assessment (RECIST 1.1) showed only a moderate tumor response in icaritin‐treated advanced HCC patients. Median TTP was two treatment cycles (56 days). Treatment‐induced TTP (days) was significantly correlated with the baseline conditions of degree of portal vein tumor thrombus (hazard ratio [HR] = 0.27; 95% CI, 0.14‐0.51; P < .0001), macroscopic vascular invasion (HR = 0.23; 95% CI, 0.12‐0.43; P < .0001), BCLC stages (HR = 0.29; 95% CI, 0.09‐0.94, P = .029), and AFP less than 400 ng/mL vs 400 ng/mL or higher (HR = 0.44; 95% CI, 0.26‐0.74; P = .0015) (Figure 2). Among the 59 of 68 advanced HCC patients with at least one cycle treatment, a marginal tumor response of one PR (1.7%), 20 SD (33.9%), 35 PD (59.3%), and three not RECIST evaluable (5.1%) were observed. The irRECIST or iRECIST assessments were not carried out to explore immune treatment‐related tumor response during the study.
Figure 2.
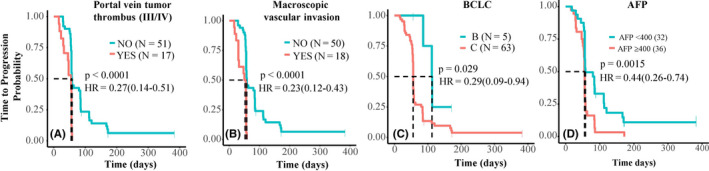
Kaplan‐Meier analysis of icaritin treatment‐induced time‐to‐progression and prognosis factors in advanced hepatitis B virus‐related hepatocellular carcinoma. Kaplan‐Meier analysis of time to progression with poor prognosis characteristics of portal vein tumor thrombus (A), macroscopic vascular invasion (B), Barcelona Clinic Liver Cancer (BCLC) staging (C), and α‐fetoprotein (AFP) (D). HR, hazard ratio
Median OS (mOS) of the intention‐to‐treat subjects (n = 68) without normalization at baseline conditions (91.2% HBV, 27.9% Child‐Pugh B, and 92.6% BCLC stage C) was 186 days. Survival was marginally favorable compared to the advanced Asian HCC subgroup in a phase III Asia‐Pacific trial, with baseline HBV infection of 100% and Child‐Pugh B prevalence of 2.7%. In the subgroup, the mOS was 177 days in the sorafenib arm (n = 106) and 123 days in the placebo arm (n = 59, Figure S2). 37 Normalization of the baseline of Child‐Pugh A patients, for example, produced mOS of 271 days (95% CI, 179‐313 days) compared with mOS 177 days (95% CI, 156‐225days) in sorafenib‐treated HCC patients (more than 95% Child‐Pugh A) (Figure S2). 37
3.2. Dynamics of cytokines and survival
Icaritin treatment‐induced durable survival in advanced HCC patients was significantly correlated with the immunodynamic of serum cytokines. Icaritin treatment‐induced dynamic changes of IL‐6, IL‐8, IL‐10, and TNF‐α in advantaged (blue) vs disadvantaged (red) groups of HCC patients from pretreatment (D0) to posttreatment (D56) were reported. 32 Significantly improved survival of advantaged patients compared to disadvantaged patients were shown with IL‐6 (mOS 328.5 [277‐566] vs 168 [135‐482] days; HR = 0.37, 95% CI = 0.19‐0.74, P = .0033), IL‐8 (mOS 476.5 [344‐795] vs 175 [125‐282] days; HR = 0.22, 95% CI = 0.11‐0.46, P < .0001), IL‐10 (mOS, 344 [282‐565] vs 172 [144‐313] days; HR = 0.46, 95% CI = 0.24‐0.89, P = .019), and TNF‐α (mOS 309 [276‐565] vs 254 [157‐509] days; HR = 0.57, 95% CI = 0.3‐1.09, P = .088) (Figure 3A,B). Alternatively, subjects were categorized according to the dynamic changes of 30% increase or higher, 30% decrease or higher, and stable/minor changes from baseline. Patients showing decreased or minor/stable changes of serum IL‐6 and IL‐8 were more strongly correlated with better survival compared to patients with 30% increases or more (309‐328 vs 172 days and 456‐468 vs 207 days, respectively; Figure S3). Moreover, icaritin treatment‐induced survival was significantly correlated with the baseline level of serum biomarkers of AFP (172 [115‐271] vs 282 [137‐469] days; HR = 0.58; 95% CI, 0.36‐0.92) [Table S3], IL‐6 (207 [157‐313] vs 366.5 [295‐566] days; HR = 0.47; 95% CI, 0.25‐0.91, P = .022), IL‐8 (175 [135‐295] vs 475.5 [309‐NA] days; HR = 0.29, 95% CI, 0.15‐0.58, P = .00024), IL‐10 (164.5 [135‐454] vs 326.5 [282‐566] days; HR = 0.46, 95% CI, 0.24‐0.88, P = .016), and TNF‐α (245 [144‐456] vs 311 [277‐565] days; HR = 0.53, 95% CI, 0.28‐1.02, P = .053) (Figure 3C). Interestingly, the dynamics of AFP Kaplan‐Meier survival analysis revealed a significant survival difference between the advantaged and disadvantaged groups (mOS 313 vs 236 days; HR = 0.46, 95% CI, 0.24‐0.85; P = .012; Figure S3).
Figure 3.
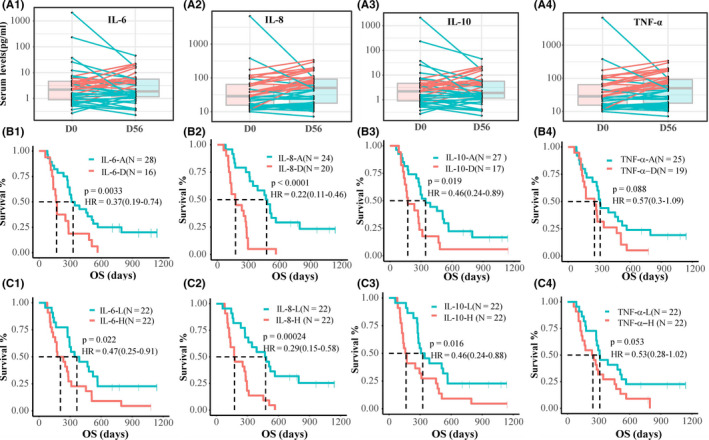
Dynamic changes of cytokines and Kaplan‐Meier analysis of survival in advanced hepatitis B virus‐related hepatocellular carcinoma (HCC). A1‐A4, Icaritin treatment‐induced dynamic changes of interleukin (IL)‐6, IL‐8, IL‐10, and tumor necrosis factor‐α (TNF‐α) at pre‐ (D0) and posttreatment (D56) of HCC patients of the advantage (A) group (blue lines) and the disadvantage (D) group (red lines). B1‐B4, Kaplan‐Meier survival analysis data. C1‐C4, Kaplan‐Meier analysis of overall survival (OS) of baseline levels of serum IL‐6, IL‐8, IL‐10, and TNF‐α. H, high; HR, hazard ratio; L, low
3.3. Dynamics of serum immune checkpoint proteins and survival
Icaritin treatment‐induced durable survival observed in HBV‐related advanced HCC patients was significantly correlated with the dynamic changes of soluble immune checkpoint proteins in the serum. The treatment‐induced survival in the advantaged vs disadvantaged groups of HCC patients 32 were significantly associated with dynamic changes at pre‐ (D0) and posttreatment (D56) of soluble immune checkpoint proteins including TIM3 (mOS 454 days; HR = 0.4; 95% CI, 0.2‐0.81; P = .008); LAG3 (mOS 421.5 days; HR = 0.45; 95% CI, 0.22‐0.92; P = .024), CD28 (mOS, 421.5 days; HR = 0.4; 95% CI, 0.2‐0.79; P = .007), CD80 (mOS 421.5 days; HR = 0.45; 95% CI, 0.22‐0.9; P = .021), and CTLA‐4 (mOS 349 days; HR = 0.47; 95% CI, 0.23‐0.96; P = .034) (Figure 4). Alternatively, subjects were categorized according to the dynamic changes of 30% or more increase, 30% or more decrease, or stable. The survival benefits tended to be more strongly correlated with decreased CD28 levels (mOS 454 vs 236 days; Figure S4), with less correlation observed for TIM3, LAG3, CD80, and CTAL‐4. In addition, advanced HCC patients with low baseline soluble serum immune checkpoint proteins showed significant survival improvements, compared to the survival of patients with high baseline levels of CD137 (mOS 389 vs 144 days; HR = 0.36; 95% CI, 0.19‐0.68; P = .0012), CD27 (mOS 296 vs 178 days; HR = 0.46; 95% CI, 0.24‐0.88, P = .016), and BTLA (mOS 296 vs 164 days; HR = 0.41; 95% CI, 0.21‐0.78, P = .0056) (Figure S4).
Figure 4.
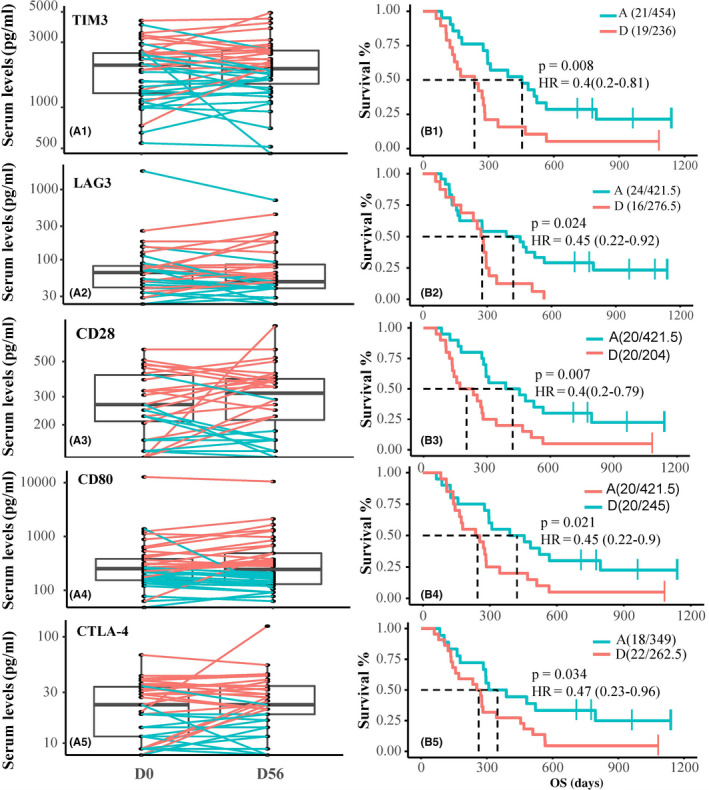
Treatment‐induced dynamics of soluble immune checkpoint proteins and survival in advanced hepatitis B virus‐related hepatocellular carcinoma (HCC). Icaritin treatment‐induced dynamic changes of serum T‐cell immunoglobulin mucin‐3 (TIM3), lymphocyte‐activation gene 3 (LAG3), CD28, CD80, and cytotoxic T‐lymphocyte associated protein 4 (CTLA‐4) at pre‐ (D0) and posttreatment (D56) of HCC patients (A1‐5) of the advantage group (blue lines) and the disadvantage group (red lines), with their Kaplan‐Meier survival analysis data (B1‐5). HR, hazard ratio
3.4. Programmed cell death‐ligand 1‐positive MDSC infiltration, immune cells, and survival
Icaritin treatment‐induced anticancer immunomodulatory activities were evident as significant tumor growth inhibition in H22‐BALB/c mice and the concurrent decrease of infiltration of immunosuppressive PD‐L1+ MDSCs to CD45+ ratio and MDSCs to CD45+ ratio (Figure 5A). Dual immune staining for PD‐L1+ and CD68+ cells showed the predominant expression of PD‐L1 on the surface of macrophages in the tumor microenvironment of a PR case (Figure 5B). Immunohistochemistry analysis also revealed that patients with high expression of PD‐L1 in immune cells tend to have better mOS (469 vs 134 days; HR = 0.59; 95% CI, 0.29‐1.19; P = .14) than that of patients with no expression of PD‐L1 in tumor tissues. Favorable survival was also significantly correlated with high expression of PD‐L1+ in immune cells and with low platelet counts in advanced HCC patients (mOS 537 vs 134 days, P < .001; Figure 5B,). Improved survival was significantly correlated with the dynamic changes of neutrophil‐to‐lymphocyte ratio (NLR) (mOS 320 vs 178 days; HR = 0.56; 95% CI = 0.31‐1.03; P < .058; Figure 5C). Remarkably, icaritin treatment‐induced transient dynamic changes of 30% or more decrease (n = 4, mOS 795 days), minor change or stable (n = 26, mOS 298 days) and 30% or more increase of NLR (n = 19, mOS 172 days) were significantly correlated with survival in advanced HCC (P = .00015) (Figure 5C). Similar findings were evident for decreased and increased platelet‐to‐lymphocyte (mOS 344 vs 205 days; HR = 0.56; 95% CI, 0.32‐1.0; P < .046) (Figure S5).
Figure 5.
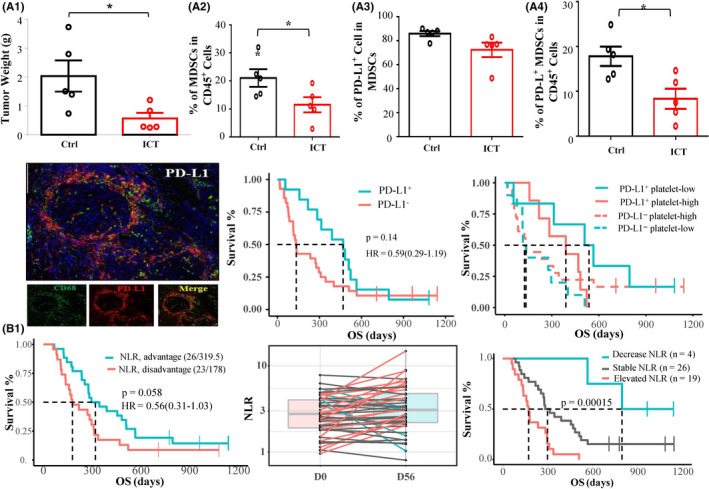
Icaritin inhibited tumor growth, infiltration of programmed cell death‐ligand 1 (PD‐L1)+ myeloid‐derived suppressor cells (MDSC) in vivo, and induced survival in hepatocellular carcinoma patients. A1‐4, Tumor growth inhibition (H22‐BALB/c mice) was correlated with the decreased immune cell infiltration of MDSC to CD45+ ratio (%) and PD‐L1+MDSC to CD45+ ratio (%), but was less correlated with PD‐L1+ MDSC to MDSC ratio (%). B1, Dual staining of PD‐L1 and CD68 in macrophages in a partial response case. B2, Kaplan‐Meier survival analysis of patients with immune cell PD‐L1 expression (cut‐off ≥ 1% tumor/immune cells). B3, Kaplan‐Meier survival analysis of patients with high expression of PD‐L1 with low and high platelet counts. C1, Neutrophil‐to‐lymphocyte ratio (NLR) in the advantage vs disadvantage group. C2, C3, Dynamic changes of NLR of 30% decrease (blue), 30% increase (red), and minor changes/stable (gray) (C2) with Kaplan‐Meier survival analysis (C3). Ctrl, control; ICT, icaritin; HR, hazard ratio; OS, overall survival
The WGS‐based retrospective tumor neoantigen profiling revealed that advanced HCC patients with high and low tumor neoantigens (see Doc. [Link], [Link]) had mOS of 667.5 and 236 days, respectively (P = .017) (Figure S6). NanoString technology‐based gene expression profiling showed that patients with favorable survival had high expression of a gene cluster associated with antiinflammatory and immune‐regulatory pathways, which included MAPK14, NT5E (CD73), CD276, CD8B, CD9, CD244, IFNB1/IFNGR1 and HLA‐DQA1 (Figure S7). Interestingly, WGS also revealed that advanced HCC patients with S. maltophilia‐positive detection had favorable response and survival following icaritin treatment (CR, PR, and SD) (Figure S8) (mOS 565.5 vs 276 days; P = .0058). The potential immunologic roles of S. maltophilia infection in chronic HBV‐related HCC 41 , 42 warrant further exploration.
3.5. Hepatitis B virus DNA, HBsAg positivity, IFN‐γ, TNF‐α, IL‐6, IL‐8, and survival
The baseline serum concentrations of IFN‐γ was significantly (P = .024) correlated with HBV‐DNA titer (copy numbers/mL), but less correlated with baseline TNF‐α (P = .1) (Figure 6A,B). Based on the clinical HBV HBsAg/Ab tests, the advanced HBV‐infected HCC patients were divided into two subgroups for Kaplan‐Meier survival analysis. Group A patients (10 of 43) were HBsAg‐positive, hepatitis B envelope (HBe) antigen‐positive, and hepatitis B core (HBc) Ab‐positive (Figure 6C,D, dark red line). They displayed shorter survival (mOS 204 days) regardless of the baseline levels of biomarkers. Group B patients (33 of 43, 76.7%) were HBsAg‐positive, HBeAb‐positive, or HBcAb‐positive (Figure 6C,D, blue or light red lines). They showed significant survival improvement that was correlated with high baseline IFN‐γ (P = .046) and low‐baseline TNF‐α (P = .0089). The baseline serum concentrations of IL‐6 (P = .075) and IL‐8 (P = .03) were significantly correlated with HBV viral DNA titer (copy numbers/mL) (Figure 6E,F). Nineteen group B patients with low serum concentration (less than median; Figure 6G,H,blue lines) of either IL‐6 or low IL‐8 showed significantly improved survival, with mOS of 344 days (P < .02) and 482 days (P < .0001), respectively. When combined with low platelet counts, 30 of 46 (65%) patients with low serum levels of IL‐6/or IL‐8 also showed significantly improved survival, with mOS of 329 and 344 days, respectively (P < .0001; Figure S9).
Figure 6.
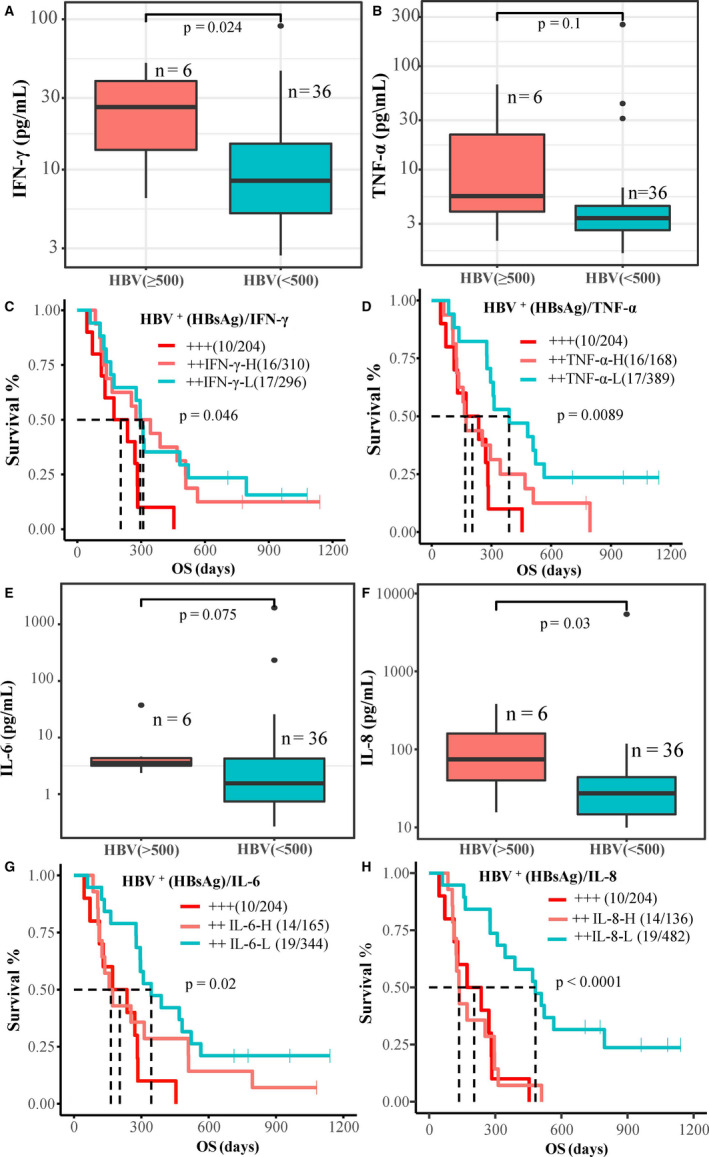
Hepatitis B virus (HBV) infection and cytokines associated with survival in advanced hepatocellular carcinoma. A, B, Correlation of baseline serum γ‐interferon (IFN‐γ), tumor necrosis factor‐α (TNF‐α), and HBV viral DNA copy number. C, D, Kaplan‐Meier survival analysis of subgroups with combination of baseline IFN‐γ/TNF‐α. E, F, Correlation of baseline serum interleukin (IL)‐6 and IL‐8 with HBV viral DNA copy number. G, H, Kaplan‐Meier survival analysis of subgroups with combination of serum IL‐6 and IL‐8. H, high; HBsAg, hepatitis B surface antigen; L, low; OS, overall survival
3.6. Composite biomarkers of AFP, Th1/Th2 cytokines, and survival
Icaritin treatment‐induced OS was significantly correlated with different CBSs in advanced HCC patients. Baseline CBSs were explored with high‐level AFP (100 ng/mL or higher), IL‐6 (less than 2.2 pg/mL), IL‐8 (less than 28.7 pg/mL), IL‐10 (less than 0.365 pg/mL), TNF‐α (less than 3.5 pg/mL), and IFN‐γ (5.0 pg/mL or more). Patients with CBS of 4 and higher, 3 and higher, and 2 and higher of AFP, IL‐6, IL‐8, IL‐10, and TNF‐α displayed improved mOS of 509 days (HR = 0.26; 95% CI, 0.13‐0.54; P = .00011), 389 days (HR = 0.37; 95% CI, 0.19‐0.72; P = .0025), and 302 days (HR = 0.39; 95% CI, 0.19‐0.79; P = .007), respectively, compared to low CBS groups (Figure 7A‐C). Patients with AFP, IL‐6, and TNF‐α CBS of 2 or higher had mOS of 344 days (HR = 0.46; 95% CI, 0.24‐0.89; P = .018) (Figure 7D). Patients with IFN‐γ, IL‐6, and TNF‐α CBS = 3, or IFN‐γ and IL‐6 CBS = 2 had mOS of 522 days (HR = 0.37; 95% CI, 0.15‐0.88; P = .02) and 476 days (HR = 0.44; 95% CI, 0.22‐0.88; P = .017), respectively (Figure 7E,F).
Figure 7.
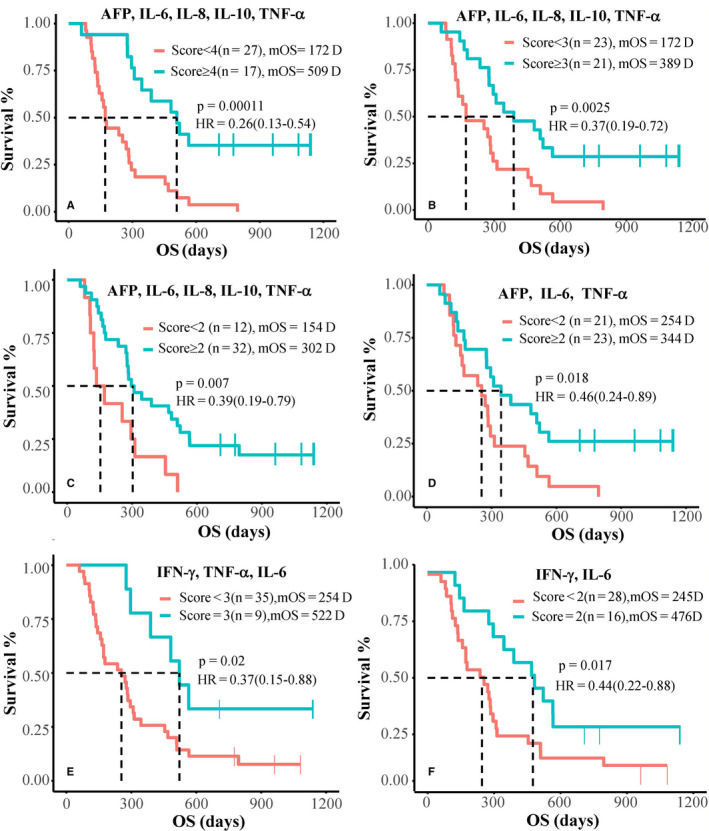
Kaplan‐Meier survival analysis with composite biomarker scoring (CBS) in advanced hepatocellular carcinoma. Kaplan‐Meier survival analysis of subgroups with composition biomarker scores (CBS) of α‐fetoprotein (AFP; ≥100 ng/mL), interleukin‐6 (IL‐6; <2.2 pg/mL), IL‐8 (<28.7 pg/mL), IL‐10 (<0.365pg/mL), tumor necrosis factor‐α (TNF‐α; <3.5pg/mL), and γ‐interferon (IFN‐γ; ≥5.0 pg/mL), with a score of 1 for each. Patients with CBS of AFP, IL‐6, IL‐8, IL‐10, and TNF‐α (A‐C), CBS of AFP, IL‐6, and TNF‐α (D), and CBS of IFN‐γ, TNF‐α, and IL‐6 (E, F)
Postprogression treatment of icaritin‐induced survival was observed in SD and PD advanced HCC patients. Patients with or without postprogression treatment of icaritin for 14 days or more vs less than 14 days had mOS of 366 days (n = 20) and 147 days (n = 48), respectively (P = .0056; Figure S10). Patients with a prolonged period of icaritin posttreatment showed favorable and durable survival. Among the SD patients, icaritin treatment for more than 135 days (long SD) and less than 135 days (short SD) showed mOS of 496 days (95% CI, 389‐NA) and 383.5 days (95% CI, 284‐NA), respectively. On the other hand, an independent study showed that short SD HCC sorafenib‐treated patients with treatment (less than 153 days) had mOS of 216 days (95% CI, 0‐718; n = 24) (Figure S10). 43
4. DISCUSSION
Hepatitis B viral infections often contribute to abnormal immune tolerance 44 , 45 and liver injury, 46 and are negatively correlated with the clinical outcome of sorafenib treatment in advanced HCC. 3 Particularly, advanced HBV‐related HCC patients with poor prognosis characteristics have very limited treatment options, 3 , 37 or lack of optimal or precision treatment. 41 , 47 , 48 Icaritin treatment‐induced anticancer immunomodulation activities through the IL‐6/JAK/STAT3‐associated pathways have been collectively reported in immune‐suppressed MDSCs, 27 , 30 neutrophils, and platelets (Figure S5), 49 and in Th1/Th2 modulation. 23 Here, we further showed the clinical safety and efficacy associated with dynamic changes of immune biomarkers of cytokines, immune checkpoint proteins, and immune cells in advanced HBV‐related HCC with poor prognosis. Our data suggest that icaritin treatment‐induced immunomodulating activities included the coordinated dynamics of cytokines, immune checkpoints, and immune cells through the IL‐6/JAK/STAT3 pathways in the HBV‐related HCC tumor microenvironment 20 (Figure 1), rather than a single target blockade. Immunomodulation of the IL‐6/JAK/STAT3 associated pathways might be an attractive approach to control tumor progression, immune tolerance, and HBV viral reactivation 50 and thus to improve survival with significant reduction of safety concerns for advanced HCC patients.
How a marginal tumor response (RECIST) translates to a clinical survival benefit in advanced HBV‐related HCC patients with poor prognosis is still not well understood. The mechanism of action of small molecule‐based immunomodulation and clinical efficacy or response patterns are different from conventional targeted therapies and immune checkpoint inhibitors. 9 , 35 Indeed, our findings were consistent with previous findings that a marginal tumor response (overall response rate or progression‐free survival) but with durable survival benefit were observed in patients with metastatic melanoma. 51 Both clinical safety and efficacy required further confirmation (NCT03236636 and NCT03236649). Icaritin immunomodulatory clinical activities in advanced HCC were more evident when multiple factors of poor prognosis, such as bulky tumor mass (26% vs 0%), extrahepatic metastases (85.3% vs 61%), Child‐Pugh class B (27.9% vs 1%), HBV (92% vs 50%), and AFP greater than ULN (92.6% vs 77.3%) were normalized (Table S1). 37
Immunodynamic biomarkers are essential to monitor advanced HBV‐related HCC patients during the course of immune treatment, both for safety monitoring and to predict survival outcome. T helper type 1/Th2‐associated cytokines are often suggested to predict progression of HCC 52 or the degree of liver injury, 46 HBV viral reactivation, 53 , 54 and immune disorders. 11 , 55 We first revealed the dynamic changes of serum cytokines including IL‐6, IL‐8, IL‐10, and TNF‐α, and immune checkpoint proteins including TIM3, LAG3, CD28, CD80, and CTLA‐4. Significant correlations with icaritin treatment‐induced survival in HBV‐related HCC were observed (Figures 3, 4, S3, and S4). Due to the disease complexity of chronic inflammation and baseline heterogeneity, we considered four major dynamic change patterns from D0 to D56. They were designated as: a, persistently high; b, high to low; c, low to high; and d, persistently low. According to the method of dynamics of inflammatory and immune index of advanced HCC, 32 we combined the dynamic changes of 30% or more and less than 30% together with the median at posttreatment (D56) to define the advantage and disadvantage groups of HCC patients. The advantage group with 30% or more decrease (from high to low) or persistent low (below median of D56) displayed a favorable response phenotype. The disadvantage group with 30% or more increase (from low to high) and persistent high (above median D56) displayed an unfavorable response phenotype. As low baseline inflammatory cytokines are often associated with prognosis in advanced HCC, persistently low patients might be induced by drug treatment or unknown causes of disease stabilization. There is a potential limitation of the use of the dynamic advantage vs disadvantage method to predict survival in clinical settings. However, using the percentage of dynamic changes (ie 30% or higher) without considering the range of changes (ie median D56) for the survival analysis risks ignoring the pronounced heterogeneity of individual advanced HCC patients. Optimized methods of dynamics analysis of inflammation and immune index are needed for advanced HCC and must be validated before clinical use. Our observations were consistent with previous findings that network inflammatory cytokines 56 and immune checkpoint proteins 57 must be monitored during the course of immunotherapy, 58 , 59 particularly in advanced HCC with poor prognosis. These specific biomarkers at baseline or dynamics associated with the treatment outcomes might allow patient stratification for immune‐combination treatment of advanced HBV‐related HCC.
The pronounced disease complexity and lack of driver gene biomarkers are the obvious barriers to drug development in advanced HCC. The concept of CBS has attracted increasing attention in cancer immunotherapy. 60 , 61 Different from other solid tumors, limited access to tumor tissue specimens, pronounced heterogeneity, and disease complexity in HBV‐related advanced HCC have made CBS of inflammatory and immune indices more attractive in immunomodulatory therapy. 62 Here, we report a pilot example that CBS of elevated AFP and the IL‐6, IL‐8, IL‐10, IFN‐γ, and TNF‐α cytokines were significantly correlated with survival in icaritin immunomodulation treatment in advanced HCC (Figure 7). The CBSs of high‐level AFP and cytokines could be valuable in the delivery of more effective immunomodulation therapy to advanced HCC patients, especially those with a poor prognosis.
ETHICAL APPROVAL AND CONSENT TO PARTICIPATE
All patients provided written informed consent before enrolment. The study was performed in accordance with good clinical practice and the Declaration of Helsinki guidelines. Approval from the appropriate ethics committees and institutional review boards was obtained and documented before the study. (Name of ethics committee: Cancer Hospital, Chinese Academy of Medical Sciences, National GCP Centre for Anticancer Drugs; Ethic approval letter ID: 11‐95/530, Clinical Protocol ID: TG11141CR; Approval date: Nov. 24, 2011). This trial was registered at clinicaltrials.gov (https://clinicaltrials.gov/ct2/show/NCT02496949).
CONSENT FOR PUBLICATION
In addition to the consent form for enrolment, the signed consent form also includes a statement ensuring that enrolled patients agree to allow his/her data generated in this study to be published in an unidentified manner with privacy protection, regardless of the presentation format.
CONFLICT OF INTEREST
SL is an ex‐employee and shareholder of Beijing Shenogen. BY and KM are employees and shareholders of Beijing Shenogen Biomedical Ltd. The other authors have no conflict of interest.
Supporting information
Fig S1‐S10
Table S1
Table S2
Table S3
Doc S1
ACKNOWLEDGEMENTS
We thank all patients, families, and caregivers for their support in this study. We also thank Dr Jian Peng for his kind efforts to facilitate collaborations, Chao Zhang and Zheng Yuan for their efforts in study monitoring, and Dr Hang Liu and Laingfeng Zou for biomarker study contribution. Funding resources include the National Science and Technology Major Project (2012ZX09101215), National Natural Science Foundation of China (81903093), China Postdoctoral Science Foundation (2018M643316), and Beijing Shenogen Biomedical Ltd.
Qin S‐K, Li Q, Ming Xu J, et al. Icaritin‐induced immunomodulatory efficacy in advanced hepatitis B virus‐related hepatocellular carcinoma: Immunodynamic biomarkers and overall survival. Cancer Sci. 2020;111:4218–4231. 10.1111/cas.14641
Presented at the 2018 Annual Meeting of the American Society of Clinical Oncology (DOI: https://doi.org/10.1200/JCO.2018.36.15_suppl.4077).
Qin and Li equally contributed to this study.
DATA AVAILABILITY STATEMENT
Data that support the findings of this study are included in this publication, and the related Supporting information.
REFERENCES
- 1. Llovet JMVA, Lachenmayer A, Finn RS. Advances in targeted therapies for hepatocellular carcinoma in the genomic era. Nat Rev Cli Oncology. 2015;12:436. [DOI] [PubMed] [Google Scholar]
- 2. Chen W, Zheng R, Baade PD, et al. Cancer statistics in China, 2015. CA Cancer J Clin. 2016;66:115‐132. [DOI] [PubMed] [Google Scholar]
- 3. Jackson R, Psarelli EE, Berhane S, Khan H, Johnson P. Impact of viral status on survival in patients receiving Sorafenib for advanced hepatocellular cancer: a meta‐analysis of randomized phase III trials. J Clin Oncol. 2017;35:622‐628. [DOI] [PubMed] [Google Scholar]
- 4. Yang JD, Hainaut P, Gores GJ, Amadou A, Plymoth A, Roberts LR. A global view of hepatocellular carcinoma: trends, risk, prevention and management. Nat Rev Gastroenterol Hepatol. 2019;16:589‐604. [DOI] [PMC free article] [PubMed] [Google Scholar]
- 5. Fanning GC, Zoulim F, Hou J, Bertoletti A. Therapeutic strategies for hepatitis B virus infection: towards a cure. Nat Rev Drug Discov. 2019;18(11):827‐844. [DOI] [PubMed] [Google Scholar]
- 6. Allain JP, Opare‐Sem O. Screening and diagnosis of HBV in low‐income and middle‐income countries. Nat Rev Gastroenterol Hepatol. 2016;13:643‐653. [DOI] [PubMed] [Google Scholar]
- 7. Stanaway JD, Flaxman AD, Naghavi M, et al. The global burden of viral hepatitis from 1990 to 2013: findings from the Global Burden of Disease Study 2013. Lancet. 2016;388:1081‐1088. [DOI] [PMC free article] [PubMed] [Google Scholar]
- 8. Llovet JM, Hernandez‐Gea V. Hepatocellular carcinoma: reasons for phase III failure and novel perspectives on trial design. Clin Cancer Res. 2014;20:2072‐2079. [DOI] [PubMed] [Google Scholar]
- 9. El‐Khoueiry AB, Sangro B, Yau T, et al. Nivolumab in patients with advanced hepatocellular carcinoma (CheckMate 040): an open‐label, non‐comparative, phase 1/2 dose escalation and expansion trial. Lancet. 2017;389:2492‐2502. [DOI] [PMC free article] [PubMed] [Google Scholar]
- 10. Jantan I, Ahmad W, Bukhari SN. Plant‐derived immunomodulators: an insight on their preclinical evaluation and clinical trials. Front Plant Sci. 2015;6:655. [DOI] [PMC free article] [PubMed] [Google Scholar]
- 11. Chen Y, Tian Z. HBV‐induced immune imbalance in the development of HCC. Front Immunol. 2019;10:2048. [DOI] [PMC free article] [PubMed] [Google Scholar]
- 12. Yu H, Kortylewski M, Pardoll D. Crosstalk between cancer and immune cells: role of STAT3 in the tumour microenvironment. Nat Rev Immunol. 2007;7:41‐51. [DOI] [PubMed] [Google Scholar]
- 13. Park EJ, Lee JH, Yu GY, et al. Dietary and genetic obesity promote liver inflammation and tumorigenesis by enhancing IL‐6 and TNF expression. Cell. 2010;140:197‐208. [DOI] [PMC free article] [PubMed] [Google Scholar]
- 14. Gu FM, Li QL, Gao Q, et al. IL‐17 induces AKT‐dependent IL‐6/JAK2/STAT3 activation and tumor progression in hepatocellular carcinoma. Mol Cancer. 2011;10:150. [DOI] [PMC free article] [PubMed] [Google Scholar]
- 15. Fang Z, Li J, Yu X, et al. Polarization of Monocytic myeloid‐derived suppressor cells by hepatitis B surface antigen is mediated via ERK/IL‐6/STAT3 signaling feedback and restrains the activation of T cells in chronic hepatitis B virus infection. J Immunol. 2015;195:4873‐4883. [DOI] [PubMed] [Google Scholar]
- 16. Kitamura H, Ohno Y, Toyoshima Y, et al. Interleukin‐6/STAT3 signaling as a promising target to improve the efficacy of cancer immunotherapy. Cancer Sci. 2017;108:1947‐1952. [DOI] [PMC free article] [PubMed] [Google Scholar]
- 17. O'Shea JJ, Holland SM, Staudt LM. JAKs and STATs in immunity, immunodeficiency, and cancer. N Engl J Med. 2013;368:161‐170. [DOI] [PMC free article] [PubMed] [Google Scholar]
- 18. Lokau J, Schoeder V, Haybaeck J, Garbers C. Jak‐Stat signaling induced by interleukin‐6 family cytokines in hepatocellular carcinoma. Cancers (Basel). 2019;11:1704. [DOI] [PMC free article] [PubMed] [Google Scholar]
- 19. Yu H, Pardoll D, Jove R. STATs in cancer inflammation and immunity: a leading role for STAT3. Nat Rev Cancer. 2009;9:798‐809. [DOI] [PMC free article] [PubMed] [Google Scholar]
- 20. Rebe C, Ghiringhelli F. STAT3, a master regulator of anti‐tumor immune response. Cancers (Basel). 2019;11:1280. [DOI] [PMC free article] [PubMed] [Google Scholar]
- 21. Adams JL, Smothers J, Srinivasan R, Hoos A. Big opportunities for small molecules in immuno‐oncology. Nat Rev Drug Discov. 2015;14:603‐622. [DOI] [PubMed] [Google Scholar]
- 22. Zhao H, Guo Y, Li S, et al. A novel anti‐cancer agent Icaritin suppresses hepatocellular carcinoma initiation and malignant growth through the IL‐6/Jak2/Stat3 pathway. Oncotarget. 2015;6:31927‐31943. [DOI] [PMC free article] [PubMed] [Google Scholar]
- 23. Gandhi GR, Neta M, Sathiyabama RG, et al. Flavonoids as Th1/Th2 cytokines immunomodulators: A systematic review of studies on animal models. Phytomedicine. 2018;44:74‐84. [DOI] [PubMed] [Google Scholar]
- 24. Lippitz BE. Cytokine patterns in patients with cancer: a systematic review. Lancet Oncol. 2013;14:e218‐e228. [DOI] [PubMed] [Google Scholar]
- 25. Zhu J, Li Z, Zhang G, et al. Icaritin shows potent anti‐leukemia activity on chronic myeloid leukemia in vitro and in vivo by regulating MAPK/ERK/JNK and JAK2/STAT3 /AKT signalings. PLoS One. 2011;6:e23720. [DOI] [PMC free article] [PubMed] [Google Scholar]
- 26. Zhang C, Li H, Jiang W, Zhang X, Li G. Icaritin inhibits the expression of alpha‐fetoprotein in hepatitis B virus‐infected hepatoma cell lines through post‐transcriptional regulation. Oncotarget. 2016;7:83755‐83766. [DOI] [PMC free article] [PubMed] [Google Scholar]
- 27. Hao H, Zhang Q, Zhu H, et al. Icaritin promotes tumor T‐cell infiltration and induces antitumor immunity in mice. Eur J Immunol. 2019;49:2235‐2244. [DOI] [PubMed] [Google Scholar]
- 28. Zhou J, Wu J, Chen X, et al. Icariin and its derivative, ICT, exert anti‐inflammatory, anti‐tumor effects, and modulate myeloid derived suppressive cells (MDSCs) functions. Int Immunopharmacol. 2011;11:890‐898. [DOI] [PMC free article] [PubMed] [Google Scholar]
- 29. Liu Y, Shi L, Liu Y, et al. Activation of PPARgamma mediates icaritin‐induced cell cycle arrest and apoptosis in glioblastoma multiforme. Biomed Pharmacother. 2018;100:358‐366. [DOI] [PubMed] [Google Scholar]
- 30. Fan Y, Li S, Ding X, et al. First‐in‐class immune‐modulating small molecule Icaritin in advanced hepatocellular carcinoma: preliminary results of safety, durable survival and immune biomarkers. BMC Cancer. 2019;19:279. [DOI] [PMC free article] [PubMed] [Google Scholar]
- 31. Eisenhauer EA, Therasse P, Bogaerts J, et al. New response evaluation criteria in solid tumours: Revised RECIST guideline (version 1.1). Eur J Cancer. 2009;45:228‐247. [DOI] [PubMed] [Google Scholar]
- 32. Wang BL, Tian L, Gao XH, et al. Dynamic change of the systemic immune inflammation index predicts the prognosis of patients with hepatocellular carcinoma after curative resection. Clin Chem Lab Med. 2016;54:1963‐1969. [DOI] [PubMed] [Google Scholar]
- 33. Voss MH, Chen D, Marker M, et al. Circulating biomarkers and outcome from a randomised phase II trial of sunitinib vs everolimus for patients with metastatic renal cell carcinoma. Br J Cancer. 2016;114:642‐649. [DOI] [PMC free article] [PubMed] [Google Scholar]
- 34. Wu C, Ning H, Liu M, et al. Spleen mediates a distinct hematopoietic progenitor response supporting tumor‐promoting myelopoiesis. J Clin Invest. 2018;128:3425‐3438. [DOI] [PMC free article] [PubMed] [Google Scholar]
- 35. Kudo M, Finn RS, Qin S, et al. Lenvatinib versus sorafenib in first‐line treatment of patients with unresectable hepatocellular carcinoma: a randomised phase 3 non‐inferiority trial. Lancet. 2018;391:1163‐1173. [DOI] [PubMed] [Google Scholar]
- 36. Cheng A‐L, Kang Y‐K, Chen Z, et al. Efficacy and safety of sorafenib in patients in the Asia‐Pacific region with advanced hepatocellular carcinoma: a phase III randomised, double‐blind, placebo‐controlled trial. Lancet Oncol. 2009;10:25‐34. [DOI] [PubMed] [Google Scholar]
- 37. Cheng AL, Guan Z, Chen Z, et al. Efficacy and safety of sorafenib in patients with advanced hepatocellular carcinoma according to baseline status: subset analyses of the phase III Sorafenib Asia‐Pacific trial. Eur J Cancer. 2012;48:1452‐1465. [DOI] [PubMed] [Google Scholar]
- 38. De Martin E, Michot JM, Papouin B, et al. Characterization of liver injury induced by cancer immunotherapy using immune checkpoint inhibitors. J Hepatol. 2018;68:1181‐1190. [DOI] [PubMed] [Google Scholar]
- 39. Boutros C, Tarhini A, Routier E, et al. Safety profiles of anti‐CTLA‐4 and anti‐PD‐1 antibodies alone and in combination. Nat Rev Clin Oncol. 2016;13:473‐486. [DOI] [PubMed] [Google Scholar]
- 40. Martins F, Sofiya L, Sykiotis GP, et al. Adverse effects of immune‐checkpoint inhibitors: epidemiology, management and surveillance. Nat Rev Clin Oncol. 2019;16:563‐580. [DOI] [PubMed] [Google Scholar]
- 41. Yu LX, Ling Y, Wang HY. Role of nonresolving inflammation in hepatocellular carcinoma development and progression. NPJ Precis Oncol. 2018;2:6. [DOI] [PMC free article] [PubMed] [Google Scholar]
- 42. Brooke JS. Stenotrophomonas maltophilia: an emerging global opportunistic pathogen. Clin Microbiol Rev. 2012;25:2‐41. [DOI] [PMC free article] [PubMed] [Google Scholar]
- 43. Arizumi T, Ueshima K, Chishina H, et al. Duration of stable disease is associated with overall survival in patients with advanced hepatocellular carcinoma treated with sorafenib. Digest Dis. 2014;32:705‐710. [DOI] [PubMed] [Google Scholar]
- 44. Kim GA, Lim YS, Han S, et al. High risk of hepatocellular carcinoma and death in patients with immune‐tolerant‐phase chronic hepatitis B. Gut. 2018;67:945‐952. [DOI] [PubMed] [Google Scholar]
- 45. Kennedy PTF, Litwin S, Dolman GE, Bertoletti A. Mason W. Immune tolerant chronic hepatitis B: the unrecognized risks. Viruses. 2017;9(5):96. [DOI] [PMC free article] [PubMed] [Google Scholar]
- 46. Ohta A, Sekimoto M, Sato M, et al. Indispensable role for TNF‐alpha and IFN‐gamma at the effector phase of liver injury mediated by Th1 cells specific to hepatitis B virus surface antigen. J Immunol. 2000;165:956‐961. [DOI] [PubMed] [Google Scholar]
- 47. Chan LK, Ng IO. Joining the dots for better liver cancer treatment. Nat Rev Gastroenterol Hepatol. 2020;17:74‐75. [DOI] [PubMed] [Google Scholar]
- 48. Llovet JM, Montal R, Sia D, Finn RS. Molecular therapies and precision medicine for hepatocellular carcinoma. Nat Rev Clin Oncol. 2018;15:599‐616. [DOI] [PMC free article] [PubMed] [Google Scholar]
- 49. Zhang K, Dai Z, Liu R, et al. Icaritin provokes serum thrombopoietin and downregulates thrombopoietin/MPL of the bone marrow in a mouse model of immune thrombocytopenia. Mediators Inflamm. 2018;2018:7235639. [DOI] [PMC free article] [PubMed] [Google Scholar]
- 50. Loomba R, Liang TJ. Hepatitis B reactivation associated with immune suppressive and biological modifier therapies: current concepts, management strategies, and future directions. Gastroenterology. 2017;152:1297‐1309. [DOI] [PMC free article] [PubMed] [Google Scholar]
- 51. Hodi FS, O'Day SJ, McDermott DF, et al. Improved survival with ipilimumab in patients with metastatic melanoma. N Engl J Med. 2010;363:711‐723. [DOI] [PMC free article] [PubMed] [Google Scholar]
- 52. Chan Stephen L, Wong L‐L, Chan K‐Chee A, et al. Development of a novel inflammation‐based index for hepatocellular carcinoma. Liver Cancer. 2020;9:167‐181. [DOI] [PMC free article] [PubMed] [Google Scholar]
- 53. Tzeng HT, Tsai HF, Chyuan IT, et al. Tumor necrosis factor‐alpha induced by hepatitis B virus core mediating the immune response for hepatitis B viral clearance in mice model. PLoS One. 2014;9:e103008. [DOI] [PMC free article] [PubMed] [Google Scholar]
- 54. Tavakolpour S, Alavian SM, Sali S. Hepatitis B reactivation during immunosuppressive therapy or cancer chemotherapy, management, and prevention: a comprehensive review‐screened. Hepat Mon. 2016;16:e35810. [DOI] [PMC free article] [PubMed] [Google Scholar]
- 55. Lu MY, Huang CI, Dai CY, et al. Elevated on‐treatment levels of serum IFN‐gamma is associated with treatment failure of peginterferon plus ribavirin therapy for chronic hepatitis C. Sci Rep. 2016;6:22995. [DOI] [PMC free article] [PubMed] [Google Scholar]
- 56. Lim CJ, Lee YH, Pan L, et al. Multidimensional analyses reveal distinct immune microenvironment in hepatitis B virus‐related hepatocellular carcinoma. Gut. 2019;68:916‐927. [DOI] [PubMed] [Google Scholar]
- 57. Chen DS, Mellman I. Elements of cancer immunity and the cancer‐immune set point. Nature. 2017;541:321‐330. [DOI] [PubMed] [Google Scholar]
- 58. Smyth MJ, Ngiow SF, Ribas A, Teng MW. Combination cancer immunotherapies tailored to the tumour microenvironment. Nat Rev Clin Oncol. 2016;13:143‐158. [DOI] [PubMed] [Google Scholar]
- 59. Havel JJ, Chowell D, Chan TA. The evolving landscape of biomarkers for checkpoint inhibitor immunotherapy. Nat Rev Cancer. 2019;19:133‐150. [DOI] [PMC free article] [PubMed] [Google Scholar]
- 60. Higgs BW, Morehouse CA, Streicher K, et al. Interferon gamma messenger RNA signature in tumor biopsies predicts outcomes in patients with non‐small cell lung carcinoma or urothelial cancer treated with durvalumab. Clin Cancer Res. 2018;24:3857‐3866. [DOI] [PubMed] [Google Scholar]
- 61. Mehnert JM, Monjazeb AM, Beerthuijzen JMT, Collyar D, Rubinstein L, Harris LN. The challenge for development of valuable immuno‐oncology biomarkers. Clin Cancer Res. 2017;23:4970‐4979. [DOI] [PMC free article] [PubMed] [Google Scholar]
- 62. Teufel M, Seidel H, Kochert K, et al. Biomarkers associated with response to regorafenib in patients with hepatocellular carcinoma. Gastroenterology. 2019;156:1731‐1741. [DOI] [PubMed] [Google Scholar]
Associated Data
This section collects any data citations, data availability statements, or supplementary materials included in this article.
Supplementary Materials
Fig S1‐S10
Table S1
Table S2
Table S3
Doc S1
Data Availability Statement
Data that support the findings of this study are included in this publication, and the related Supporting information.