Abstract
Accumulating evidence has identified long noncoding RNAs (lncRNAs) as regulators in tumor progression and development. Here, we elucidated the function and possible molecular mechanisms of the effect of lncRNA‐PICSAR (p38 inhibited cutaneous squamous cell carcinoma associated lincRNA) on the biological behaviors of HCC. In the present study, we found that PICSAR was upregulated in HCC tissues and cells and correlated with progression and poor prognosis in HCC patients. Gain‐ and loss‐of‐function experiments indicated that PICSAR enhanced cell proliferation, colony formation, and cell cycle progression and inhibited apoptosis of HCC cells. PICSAR could function as a competing endogenous RNA by sponging microRNA (miR)‐588 in HCC cells. Mechanically, miR‐588 inhibited HCC progression and alternation of miR‐588 reversed the promotive effects of PICSAR on HCC cells. In addition, we confirmed that eukaryotic initiation factor 6 (EIF6) was a direct target of miR‐588 in HCC and mediated the biological effects of miR‐588 and PICSAR in HCC, resulting in PI3K/AKT/mTOR pathway activation. Our data identified PICSAR as a novel oncogenic lncRNA associated with malignant clinical outcomes in HCC patients. PICSAR played an oncogenic role by targeting miR‐588 and subsequently promoted EIF6 expression and PI3K/AKT/mTOR activation in HCC. Our results revealed that PICSAR could be a potential prognostic biomarker and therapeutic target for HCC.
Keywords: EIF6, hepatocellular carcinoma, long noncoding RNA, miR‐588, PICSAR
1. INTRODUCTION
Hepatocellular carcinoma (HCC) is the third leading cause of cancer‐related death worldwide, and in China. 1 Although there have been remarkable improvements in therapeutic interventions for HCC, the 5‐year survival rate is still undesirable because of the cancer’s unlimited proliferation and tumor metastasis. 2 , 3 Most HCC patients are diagnosed at advanced stages due to the lack of specific biomarkers, which leads to high mortality and dismal prognosis. 4 Therefore, identifying an early diagnostic and therapeutic biomarker involved in HCC progression is of significant clinical value.
Long noncoding RNAs (lncRNAs) are a class of transcribed RNA molecules with a length more than 200 nucleotides with limited or no protein‐coding capacity. 5 Accumulating studies have reported that lncRNAs play critical roles in cancer progression and development and participate in diverse biological functions such as cell proliferation, apoptosis, stem cell differentiation, and metastasis. 6 , 7 The molecular mechanisms by which lncRNAs exert their biological function are diverse and complex. Long noncoding RNAs often function as competing endogenous RNAs (ceRNAs) to regulate RNA transcripts by competing for binding microRNAs (miRNAs). 8 , 9 MicroRNAs play critical roles in cancer tumorigenesis and progression, including HCC. Our previous studies showed that lncRNA AGAP2‐AS1 functions as a molecular sponge for miR‐16‐5p to promote proliferation and metastasis in HCC. 10 The lncRNA CASC2 suppressed epithelial‐mesenchymal transition of HCC cells through the CASC2/miR‐367/FBXW7 axis. 11 Long noncoding RNA DSCR8 acted as a molecular sponge for miR‐485‐5p to promote Wnt/β‐catenin activation in HCC. 12 Apparently, lncRNAs are important regulators in HCC carcinogenesis. However, the molecular mechanisms underlying the role of lncRNAs in HCC remain largely unknown.
In the present study, we identified a novel lncRNA, p38 inhibited cutaneous squamous cell carcinoma associated lincRNA (PICSAR, also known as LINC00162) through analyzing differentially expressed lncRNAs in HCC based on data from the ENCORI bioinformation platform (http://starbase.sysu.edu.cn/index.php). Long noncoding RNA PICSAR promotes growth of cutaneous squamous cell carcinoma by regulating ERK1/2 activity. Moreover, PICSAR conferred sensitivity to 5‐Aza‐2’‐deoxycytidine through modulation of the RNA splicing protein HNRNPH1 in gastric cancer. However, the clinical significance and biological function of PICSAR in HCC are completely unknown. Here, we show that PICSAR is significantly upregulated in HCC tissues and correlated with malignant prognosis. Functional experiments showed that PICSAR promotes HCC cell proliferation and inhibits apoptosis. Mechanically, PICSAR functions as a ceRNA to regulate the expression and effects of eukaryotic initiation factor 6 (EIF6) through competitively binding with miR‐588. In conclusion, PICSAR exerted an oncogenic role in the development and progression of HCC and could be identified as a valuable biomarker.
2. MATERIALS AND METHODS
2.1. Hepatocellular carcinoma tissues and cell culture
We collected HCC tissues and corresponding adjacent nontumor tissues from our department. None of the patients received therapy before surgery. All patients provided signed informed consent. The patients’ clinicopathological issues and demographic details are described in Table 1. The HCC cells (Hep3B, SMMC‐7721, HepG2, MHCC‐97L, and Huh7) and normal immortalized liver cell L02 were obtained from the Chinese Academy of Sciences. The cells were cultured in DMEM (Thermo Fisher Scientific) containing 10% FBS (Gibco) in a humidified incubator at 37°C with 5% CO2.
TABLE 1.
Clinical correlation of PICSAR expression in hepatocellular carcinoma (n = 101)
| Clinical parameter | Cases (n) | Expression level | P value | |
|---|---|---|---|---|
| PICSARhigh (n = 53) | PICSARlow (n = 48) | |||
| Age (years) | ||||
| <60 | 65 | 35 | 30 | .711 |
| ≥60 | 36 | 18 | 18 | |
| Gender | ||||
| Male | 80 | 41 | 39 | .630 |
| Female | 21 | 12 | 9 | |
| Tumor size (cm) | ||||
| <5 | 72 | 32 | 40 | .011 * |
| ≥5 | 29 | 21 | 8 | |
| Tumor number | ||||
| Solitary | 84 | 42 | 42 | .268 |
| Multiple | 17 | 11 | 6 | |
| Edmondson | ||||
| I+II | 23 | 7 | 16 | .016 * |
| III+IV | 78 | 46 | 32 | |
| TNM stage | ||||
| I+II | 76 | 35 | 41 | .024 * |
| III+IV | 25 | 18 | 7 | |
| Vascular infiltration | ||||
| Present | 16 | 10 | 6 | .381 |
| Absent | 85 | 43 | 42 | |
| AFP (ng/mL) | ||||
| <400 | 24 | 11 | 13 | .456 |
| ≥400 | 77 | 42 | 35 | |
| HBsAg | ||||
| Positive | 91 | 47 | 44 | .616 |
| Negative | 10 | 6 | 4 | |
AFP, α‐fetoprotein; HBsAg, hepatitis B surface antigen.
P < .05.
2.2. Quantitative RT‐PCR
Quantitative RT‐PCR (qRT‐PCR) was carried out as reported previously. 13 , 14 , 15 TRIzol reagent (Invitrogen) was used to extract total RNA from cells. PrimeScript RT Master Mix or TaqMan MicroRNA Reverse Transcription Kit (Applied Biosystems) was used to reverse total RNA into cDNA. Quantitative RT‐PCR was undertaking using SYBR Premix Ex Taq (Takara) and specific primers. The results were calculated by the 2−ΔΔCt method. GAPDH and U6 were utilized as endogenous controls.
2.3. Immunohistochemical staining
The immunohistochemical experiment was carried out as previously described. 14 , 15 The sections were dewaxed, dehydrated, and rehydrated. Citrate buffer was used for antigen retrieval, and hydrogen peroxide (3.0%) was used for blocking the endogenous peroxidase activity. After being blocked by 10% goat plasma, the primary Abs were added to the sections and incubated at 4°C overnight. The biotinylated secondary Abs (Golden Bridge) were applied for detecting the primary Abs.
2.4. Western blot analysis
Detailed assays were carried out as previously reported. 16 , 17 , 18 Briefly, RIPA lysis buffer (Invitrogen) was used to extract total proteins. After examining the protein concentration by BCA Kit (Beyotime Technology), 10% SDS‐PAGE was isolated the proteins and transferred to PVDF membranes. After blocking with 5% milk, membranes were cultured in primary Abs (Cell Signaling Technology) and subsequently probed with secondary Ab. Then the signals were determined using a chemiluminescence system (Thermo Fisher Scientific).
2.5. Colony formation assay
Briefly, the treated cells were diluted and 1000 cells were seeded in 6‐well plates. The cells were cultured in medium with 10% FBS for 14 days. Colonies were fixed with 4% formaldehyde for 10 minutes and stained by Giemsa for 10 minutes.
2.6. Cell proliferation assay
We used an EdU assay to detect the cell proliferation ability by a Click‐iT EdU Imaging Kit (Ribo Biotechnology) according to the manufacturer’s protocols.
2.7. Flow cytometry analysis for cell cycle and apoptosis
The transfected cells were synchronized and fixed with 70% ethanol at 4℃. After washing, cells were stained with propidium iodide (Becton Dickinson) and the cycle was determined by FACSCalibur cytometer (Beckman Coulter). The Annexin V‐FITC/7‐AAD Apoptosis Detection Kit I (Becton Dickinson) was used to detect apoptosis according to the manufacturer’s protocols.
2.8. Luciferase reporter assay
The experiments were carried out in a similar fashion to our previous studies. 12 The 3′‐UTR of PICSAR or EIF6 WT or mutant (MUT) sequences was inserted in pmirGLO dual‐luciferase vector (GeneCopoeia). The cells were cotransfected with miR‐588 or control mimics by Lipofectamine 2000 (Invitrogen) into HCC cells. The Dual Luciferase Reporter Assay System (Promega) was used to analyze the luciferase activity.
2.9. RNA immunoprecipitation assay
We used the EZ‐Magna RIP Kit (Millipore) to conduct the assays. The cells were lysed in RNA immunoprecipitation (RIP) lysis buffer and incubated with magnetic beads of antiAgo2 Ab (Millipore). The mix was then incubated with proteinase K and the immunoprecipitated RNA was examined by real‐time PCR analysis.
2.10. Tumor xenograft experiment
Male BALB/c nude mice (4 weeks old) were obtained from the Center of Laboratory Animals of Xi’an Jiaotong University. Hepatocellular carcinoma cells (5 × 10⁶) transfected with PICSAR or sh‐PICSAR were injected s.c. into the flank of mice. Tumor volume was measured every 4 days and then calculated as length × width2 / 2. This experiment was progressed by the Institutional Animal Care and Use Committee of Xi’an Jiaotong University.
2.11. Statistical analysis
All data are expressed as the mean ± SD; statistical analyses were carried out using GraphPad Prism 6.0. All experiments were undertaken at least three times. Survival analysis was plotted by the Kaplan‐Meier method and log rank test. The relationship between PICSAR and clinical features was evaluated by the χ2‐test. The variance was analyzed by Student’s two‐sided t test. Difference with P value less than .05 was considered as significant.
3. RESULTS
3.1. PICSAR is upregulated in HCC and is associated with poor prognosis
First, we determined the expression of PICSAR between HCC and normal liver tissues on the ENCORI platform. The data showed that PICSAR expression was significantly higher in HCC than in normal liver tissues (P = .0075; Figure 1A). Similar results were confirmed in our HCC cohort (P < .05; Figure 1B). Moreover, PICSAR expression was upregulated in HCC cells compared to normal hepatic L02 cells (P < .05; Figure 1C). To assess the clinical significance of PICSAR overexpression in HCC, we evaluated the correlation between PICSAR expression and clinical features of patients. We divided HCC patients into two subgroups (low/high PICSAR level) by using the median of the cohort as a cut‐off value. In Table 1, our data indicated that high PICSAR was markedly associated with large tumor size (P = .011), high histological grade (P = .016), and advanced tumor stage (P = .024). Moreover, the patients with higher PICSAR had shorter overall survival (OS) and disease‐free survival (DFS) than those with lower PICSAR (P < .05; Figure 1D). In addition, PICSAR was an independent factor for predicting 5‐year OS and DFS in HCC patients (P = .013 and 0.019, respectively; Table S1). Notably, survival analysis of the HCC cohort from ENCORI consistently showed that high PICSAR in HCC predicted a remarkably poor prognosis of patients (P = .00034; Figure 1E). These data identified PICSAR as an oncogene that was correlated with malignant clinical prognosis of HCC.
FIGURE 1.
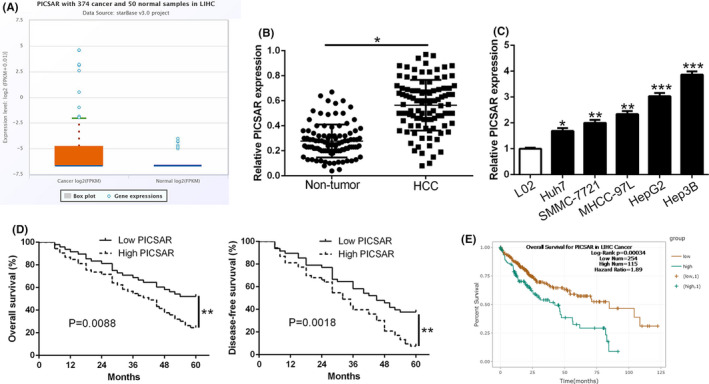
PICSAR is upregulated in hepatocellular carcinoma (HCC) and is associated with poor prognosis. A, The ENCORI platform database indicated that the expression of PICSAR was prominently higher in HCC tissues compared with normal liver tissues. B, Real‐time PCR data from our patient’s cohort revealed that PICSAR was significantly upregulated in HCC tissues compared to normal tissues. C, PICSAR expression in human normal hepatocyte cell line L02 and HCC cell lines was examined using quantitative RT‐PCR. D, Kaplan‐Meier survival curves of overall survival and disease‐free survival in our patients’ cohort. Patients were assigned into two subgroups according to the median expression of PICSAR. E, The ENCORI platform database showed that high PICSAR expression also indicated poor survival of HCC patients. *P < .05, **P < .01, ***P < .001
3.2. PICSAR promotes cell growth and inhibits apoptosis of HCC cells in vitro
To investigate whether PICSAR contributed to HCC progression, we knocked down or overexpressed PICSAR with shRNA or plasmid (pEN‐TER‐PICSAR) in HCC cells (P < .05; Figure 2A). The EdU and colony formation assays revealed that PICSAR overexpression enhanced cell proliferation and colony formation ability (P < .05; Figure 2B,C). PICSAR overexpression increased the cell cycle from G1 to S phase (P < .05; Figure 2D) and decreased apoptosis (P < .05; Figure 2E). Moreover, western analysis blot confirmed that PICSAR overexpression clearly promoted Cyclin D1 and Bcl‐2 expression, and inhibited p21 and Bax (P < .05; Figure 2F). In contrast, PICSAR knockdown inhibited cell proliferation, colony formation, and cycle progression and induced apoptosis of Hep3B cells (P < .05; Figure 2B‐F). Therefore, these results suggest that PICSAR regulated HCC progression in cell growth.
FIGURE 2.
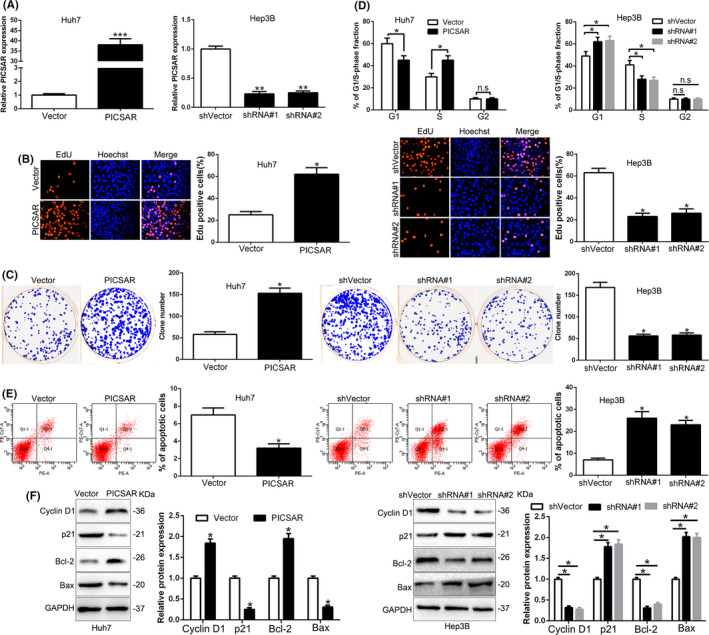
PICSAR promotes cell proliferation, colony formation, and cell cycle progression and inhibits apoptosis in hepatocellular carcinoma cells in vitro. A, Huh7 and Hep3B cells that were transfected with corresponding vectors were subjected to quantitative RT‐PCR for PICSAR expression. Overexpression of PICSAR promoted cell proliferation (B), colony formation (C), and cell cycle progression (D) and inhibited apoptosis (E) in Huh7 cells. Downregulation of PICSAR inhibited cell proliferation (B), colony formation (C), and cell cycle progression (D) and promoted apoptosis (E) in Hep3B cells. F, Western blot analysis of cycle regulator Cyclin D1 and p21 and apoptosis‐related protein Bcl2/Bax expression in the presence and absence of PICSAR. n = three independent experiments. *P < .05, **P < .01
3.3. PICSAR promotes HCC growth in vivo
We used an s.c. tumor model to examine the efficacy of PICSAR on tumorigenicity. PICSAR overexpression clearly increased the tumor growth; PICSAR knockdown inhibited the volume progression of HCC cells (P < .05; Figure 3A). Next, Ki‐67 and TUNEL staining were used to evaluate cell proliferation and apoptosis in vivo. PICSAR overexpression increased the Ki‐67‐positive rate and decreased the proportion of apoptotic cells (P < .05; Figure 3B,C). PICSAR knockdown showed the opposite effects (P < .05; Figure 3B,C). The above data suggest that PICSAR promotes tumor growth of HCC in vivo.
FIGURE 3.
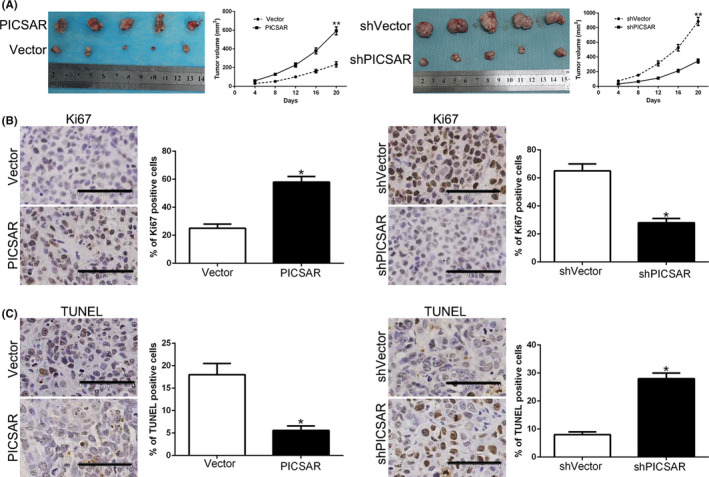
PICSAR promotes hepatocellular carcinoma growth in vivo. A, Tumor nodes with PICSAR clones had larger tumor volume (left panels) than those with vectors. Tumor nodes with shVector‐Hep3B had larger tumor volume (right panels) than these with sh‐PICSAR. B, C, Immunohistochemical staining in the xenografted tissues for Ki‐67 in tumor nodule tissues showed that PICSAR clones increased (B), whereas sh‐PICSAR decreased the percentage of Ki‐67‐positive cells (B). TUNEL assay in the xenografted tissues showed that PICSAR clone reduced the proportion of apoptotic cells (C), whereas sh‐PICSAR increased the percentage (C). Bar = 73 µM. *P < .05, **P < .01
3.4. PICSAR acts as a molecular sponge for miR‐588 in HCC cells
An increasing number of studies have reported that lncRNAs can modulate gene expression by acting as a ceRNA for miRNA. 19 , 20 To confirm whether PICSAR could act as a ceRNA, we used the bioinformatics platforms starBase version 3.0 and LncBase version 2 to search for miRNAs that potentially interact with PICSAR (Figure 4A). Three miRNAs (has‐miR‐588, has‐miR‐197‐3p, and has‐miR‐4701‐5p) showed a strong relationship with PICSAR in both software. Quantitative RT‐PCR was used to further examine the targets of PICSAR among candidates; among them, miR‐588 was markedly regulated by PICSAR (P < .05; Figure 4B). Thus, we focused on miR‐588. MicroRNA‐588 was markedly downregulated in HCC tissues compared to nontumor tissues (P < .05; Figure 4C). Low miR‐588 expression predicted poor prognosis of HCC patients based on data from Kaplan‐Meier Plotter (https://kmplot.com/analysis/) (P < .05; Figure S1A). Moreover, miR‐588 was downregulated in HCC cells compared with L02 cells (P < .05; Figure S1B). MicroRNA‐588 suppressed cell proliferation, cell cycle, and colony formation and induced apoptosis of HCC cells (P < .05; Figure S1C‐H). In HCC tissues, Pearson’s correlation analysis indicated that PICSAR expression was negatively related to miR‐588 expression (r = −0.7635, P < .01; Figure 4D). Interestingly, PICSAR expression was negatively regulated by miR‐588 (P < .05; Figure 4E). Furthermore, luciferase reporter assay showed that miR‐588 negatively regulated the luciferase activity of PICSAR‐WT‐3′‐UTR compared to 3′‐UTR of PICSAR‐MUT (Figure 4F). Argonaute 2 (AGO2) is a critical component of the RISC complexes and regulates miRNA effects. We undertook anti‐AGO2 RIP in HCC cells and the data showed that both PICSAR and miR‐588 were enriched in pulled down AGO2 protein (Figure 4G). Moreover, PICSAR was pulled down by biotin‐labelled miR‐588, however, the PICSAR binding site mutagenesis abolished the interaction between PICSAR and miR‐588 (P < .05; Figure 4H). Taken together, these data indicated that miR‐588 was a downstream target of PICSAR in HCC cells.
FIGURE 4.

PICSAR functions as a sponge for microRNA (miR)‐588. A, LncBase and starBase were used to predict miRNAs that can bind to PICSAR. A total of three miRNAs, common to both databases, were identified. B, Quantitative RT‐PCR shows that miR‐588 expression was significantly upregulated among three selected miRNAs after PICSAR knockdown in Hep3B cells, whereas miR‐588 was downregulated after PICSAR overexpression in Huh7 cells. C, Expression of miR‐588 in tumor tissues was significantly lower than that in adjacent non‐tumor tissues. D, Pearson’s correlation analysis revealed a negative association between miR‐588 and PICSAR in hepatocellular carcinoma tissues. E, Expression of PICSAR was negatively regulated by miR‐588. F, Luciferase reporter gene assays showed that miR‐588 negatively regulated the luciferase activity of PICSAR‐WT‐3′‐UTR, rather than mutant PICSAR‐MUT‐3′‐UTR. G, Anti‐Ago2 RIPA with miR‐588 mimics showed that both miR‐588 and PICSAR were enriched in Ago2 precipitate compared to IgG. H, PICSAR was highly enriched in the sample pulled down by biotinylated WT miR‐588 rather than MUT miR‐588. n = three independent experiments. *P < .05, **P < .01
To study whether miR‐588 mediated the function of PICSAR in HCC cells, we cotransfected sh‐PICSAR with miR‐588 inhibitors into HCC cells. The rescue experiments revealed that miR‐588 overexpression vectors diminished the promotion effect of PICSAR on cell proliferation, colony formation, and the cell cycle and reversed the inhibitory effect of PICSAR on cell apoptosis (Figure S2). Moreover, miR‐588 inhibitors reversed the inhibitory effect of sh‐PICSAR on cell proliferation, colony formation, and the cell cycle and reduced the promotion effect on apoptosis (Figure S2). Therefore, these data suggest that PICSAR promoted HCC cell growth, at least in part, by repressing miR‐588 function.
3.5. MicroRNA‐588 inhibits PI3K/AKT/mTOR signal pathway by directly targeting EIF6 in HCC cells
To investigate the mechanisms by which miR‐588 exerted its effect on HCC progression, we used miRNA target‐prediction platforms (TargetScan, PicTar, and miRDB) to predict the potential targets. We showed that EIF6 3′‐UTR contains the binding sites of miR‐588 (Figure 5A). To explore the role of EIF6 in HCC, we first confirmed that EIF6 was upregulated in HCC tissues compared to normal tissues (P < .05; Figure S3A), which was similar to data from UALCAN (http://ualcan.path.uab.edu/index.html; Figure S3B), ENCORI (Figure S3C), and GEPIA (http://gepia.cancer‐pku.cn/; Figure S3D) databases. Furthermore, data from UALCAN (Figure S3E), ENCORI (Figure S3F), GEPIA (Figure S3G), and Kaplan‐Meier Plotter (Figure S3H) showed that high EIF6 expression also indicated poor survival of HCC patients. In addition, EIF6 was upregulated in HCC cells compared to L02 cells (P < .05; Figure S4A). Eukaryotic initiation factor 6 promoted cell proliferation, colony formation, and the cell cycle and inhibited apoptosis of HCC cells (P < .05; Figure S4B‐F). To confirm EIF6 was a target of miR‐588 in HCC cells, we used luciferase reporter assays to show that miR‐588 overexpression decreased, whereas miR‐588 knockdown increased, the luciferase activity of WT EIF6 3′‐UTR but not the MUT EIF6 3′‐UTR (P < .05; Figure 5B). In addition, miR‐588 overexpression clearly suppressed the EIF6 mRNA and protein in Hep3B cells, whereas miR‐588 knockdown showed opposite effects in Huh7 cells (P < .05; Figure 5C,D). In HCC tissues, we confirmed an obvious inverse correlation between miR‐588 and EIF6 mRNA (P < .05; Figure 5E). Previous studies showed that EIF6 is involved in the initiation step of protein translation and is linked to the PI3K/AKT/mTOR pathway. 21 , 22 Moreover, we found that miR‐588 decreased the phosphorylation levels of PI3K, AKT, and mTOR (P < .05; Figure 5F). Thus, we conclude that miR‐588 directly targets EIF6 to inhibit the PI3K/AKT/mTOR signal pathway in HCC cells.
FIGURE 5.
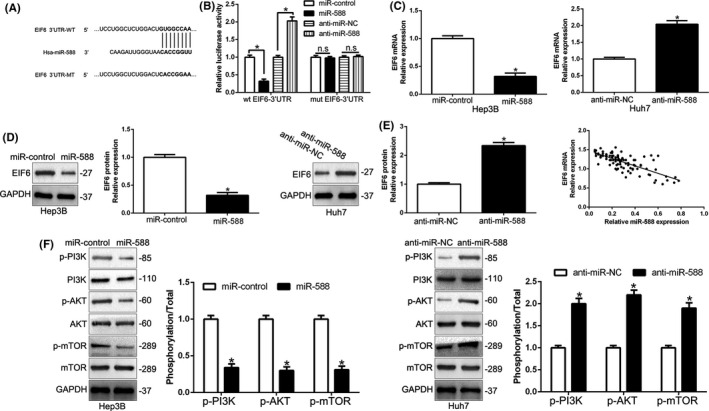
MicroRNA (miR)‐588 inhibits the PI3K/AKT/mTOR pathway by directly targeting eukaryotic initiation factor 6 (EIF6). A, Data from bioinformatics tools (microRNA.org, TargetScan, and miRDB) showed that there were putative binding sites between 3′‐UTR of EIF6‐WT and miR‐588. B, Luciferase reporter gene assays revealed that miR‐588 negatively regulated the luciferase activity of EIF6‐WT‐3′‐UTR, rather than EIF6‐MUT‐3′‐UTR. C, D, The mRNA (C) and protein (D) expression of EIF6 was negatively regulated by miR‐588. E, An inverse correlation between the levels of miR‐588 and EIF6 mRNA was observed in hepatocellular carcinoma tissues. n = three repeats with similar results. *P < .05. EIF6‐MUT, mutation of binding sites in 3′‐UTR of EIF6.
3.6. Alteration of EIF6 reversed the effects of miR‐588 and PICSAR on HCC cells
To confirm whether EIF6 mediated the function of miR‐588 and PICSAR on HCC cells, we restored EIF6 in miR‐588‐overexpressing or PICSAR‐knockdown Hep3B cells and inhibited EIF6 by shRNA in miR‐588‐suppressive or PICSAR‐overexpressing Huh7 cells (P < .05; Figure 6A). Restoration of EIF6 reversed the suppressive effects of miR‐588‐overexpressing or PICSAR‐knockdown Hep3B cells on proliferation, colony formation, cell cycle, and apoptosis (P < .05; Figure 6B‐F). Moreover, EIF6 knockdown abolished the promotive effects of miR‐588‐knockdown or PICSAR‐overexpressing Huh7 cells (P < .05; Figure 6B‐F). Notably, an obvious positive correlation between the levels of PICSAR and EIF6 mRNA was revealed by Spearman’s correlation analysis in HCC tissues (r = 0.4705. P < .001; Figure S5). The above data suggest that EIF6 is a functional mediator of the PICSAR/miR‐588 axis in HCC cells.
FIGURE 6.
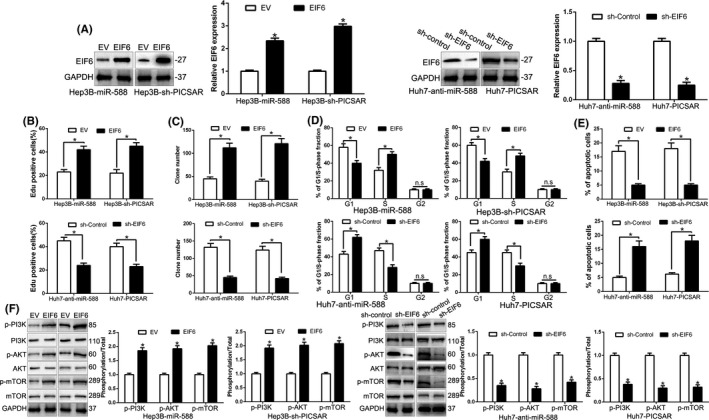
Modulation of eukaryotic initiation factor 6 (EIF6) partially abolishes PICSAR or microRNA (miR)‐588‐mediated cellular processes in hepatocellular carcinoma. A, miR‐588‐overexpressing or PICSAR‐suppressive Hep3B cells that were transfected with empty vector (EV) or EIF6 overexpression plasmid were subjected to western blot for EIF6. B‐F, miR‐588‐suppressive or PICSAR‐overexpressing Huh7 cells that were transfected with scrambled shRNA or EIF6 shRNA were subjected to western blot for EIF6. EIF6 restoration abrogated the effects of miR‐588 overexpression or PICSAR knockdown on cell proliferation (B), colony formation (C), cell cycle progression (D), apoptosis (E) and PI3K/AKT/mTOR (F) of Hep3B cells. EIF6 knockdown reversed the promotive effects of miR‐588 knockdown or PICSAR overexpression in Huh7 cells (B‐F). *P < .05
3.7. Phosphorylation of AKT is critical for the biological effects downstream of PICSAR in HCC cells
Next, we investigated whether AKT phosphorylation mediated the function of PICSAR. Inhibition of AKT phosphorylation by MK2206 in PICSAR‐overexpressing Huh7 cells significantly decreased cell proliferation, colony formation, and the cell cycle and induced apoptosis (P < .05; Figure 7A‐D). In addition, MK2206 obviously reversed the increase of Cyclin D1 and Bcl‐2 expression and the decrease of p21 and Bax expression induced by PICSAR overexpression (P < .05; Figure 7E). These results showed that AKT phosphorylation exerts an important role in PICSAR‐induced HCC progression.
FIGURE 7.
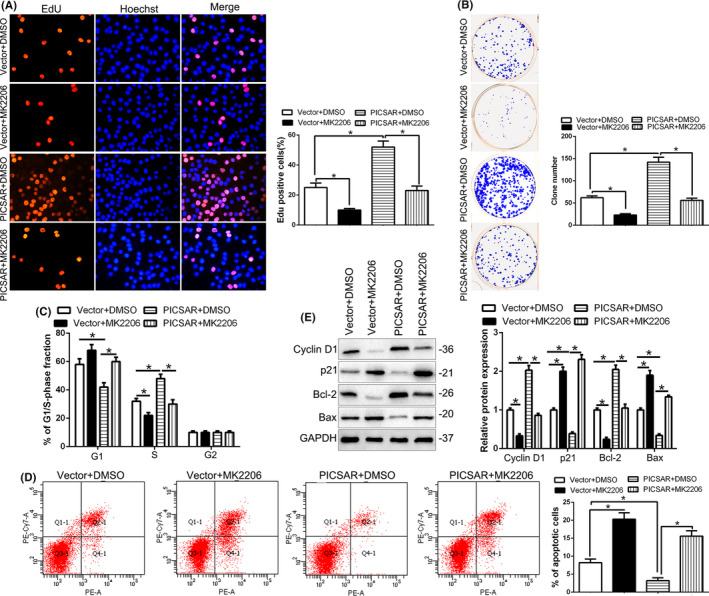
Phosphorylation of AKT is essential for the biological function of PICSAR in hepatocellular carcinoma (HCC). AKT inhibitor MK2206 abolished the cell proliferation (A), colony formation (B), cell cycle progression (C), apoptosis (D), and cycle‐ and apoptosis‐related factors (E) of HCC cells that were transduced of PICSAR vectors. *P < .05
4. DISCUSSION
Emerging studies have confirmed that lncRNAs regulate multiple biological processes of cancers, such as transcription, sponging miRNA as ceRNAs, and binding protein. 23 , 24 , 25 Long noncoding RNAs have been identified as novel diagnostic biomarkers, prognostic indicators, and therapeutic targets of HCC. 26 , 27 In the present research, we showed for the first time that lncRNA PICSAR was significantly upregulated in HCC tissues and cells, which was consistent with data from public datasets. Moreover, high PICSAR was remarkably associated with the large tumor size, high histological grade, and advanced tumor stage. PICSAR overexpression correlated with worse prognosis for 5‐year OS and DFS in HCC patients, which was consistent in other cohorts of HCC patients. These findings confirmed that PICSAR serves as an oncogene in HCC and plays a critical role in the progression of HCC.
Next, our data showed that PICSAR promoted cell proliferation, colony formation, and cell cycle progression and inhibited apoptosis of HCC cells in vitro by gain‐ and loss‐of‐function experiment. In vivo experiments found that PICSAR promoted HCC tumor growth in mice. Previous studies showed that lncRNA PICSAR promotes growth of cutaneous squamous cell carcinoma by regulating ERK1/2 activity. 28 PICSAR decreased adhesion and promotes migration of squamous carcinoma cells by downregulating α2β1 and α5β1 integrin expression. 29 These studies imply that PICSAR might be involved in other HCC malignant behaviors, such as invasion, 30 which needs to be further confirmed.
Accumulating evidence has indicated that lncRNAs modulate target RNA by binding and titrating them off their binding sites on protein‐coding messengers. 31 , 32 Bioinformatics analysis, luciferase reporter assays, and RNA pull‐down assays revealed that miR‐588 is a target of PICSAR and PICSAR acted as molecular sponge for miR‐588. MicroRNA‐588 expression was regulated by PICSAR in HCC cells. However, the importance of miR‐588 in HCC remains unknown. Here, we confirmed that miR‐588 inhibited cell proliferation, colony formation, and cell cycle progression and induced apoptosis in HCC. An inverse correlation between PICSAR and miR‐588 expression was confirmed in HCC tissues. Transcriptional expression of lncRNAs in HCC is modulated through transcription factors, or epigenetically by aberrant histone acetylation or DNA methylation, and posttranscriptionally by lncRNA transcript stability modulated by miRNAs and RNA‐binding proteins. Many reports have confirmed the mutual regulation of lncRNA and miRNA. Long noncoding RNAs have been shown to function as “sponges” coordinating miRNA function. Long noncoding RNA acts as a sponge by harboring multiple miRNA binding sites, and it is also cleaved through a miRNA‐AGO mediated mechanism. 33 These results suggest that PICSAR exerts oncogenic roles, partly by sponging miR‐588 in HCC.
To investigate the miR‐588 target, we first searched bioinformatics platforms and confirmed the candidate target by luciferase assay. We showed that EIF6 was a direct target and regulated by miR‐588. A translation factor, EIF6 plays an important role in cancer progression, metastasis, cell proliferation, and apoptosis. 34 , 35 Here, EIF6 was identified as a direct target of miR‐588 and mediated the effects of miR‐588 and PICSAR in HCC. MicroRNA‐588 was inversely correlated with the expression of EIF6 in HCC tissues. The database and our data showed that EIF6 was overexpressed in HCC and correlated with a worse prognosis of HCC patients. Moreover, the downstream of EIF6, AKT phosphorylation, mediated the effects of PICSAR. Taken together, these results indicated that PICSAR exerts an oncogenic role through miR‐588/EIF6 and activates the PI3K/AKT/mTOR axis in HCC.
In conclusion, we identified that a novel lncRNA, PICSAR, was upregulated in HCC and correlated with malignant prognosis of HCC patients. PICSAR overexpression promoted the proliferation, colony formation, and cell cycle progression and inhibited apoptosis of HCC cells. Moreover, PICSAR promoted tumor growth of HCC in vivo. Mechanistically, PICSAR functioned as an oncogenic lncRNA by acting as a ceRNA to sponge miR‐588 and promoted EIF6 expression, subsequently activating the PI3K/AKT/mTOR signaling pathway. Our data indicated that PICSAR was a potential prognostic biomarker and therapeutic target for HCC.
CONFLICT OF INTEREST
No conflicts of interest exist.
Supporting information
Figure S1
Figure S2
Figure S3
Figure S4
Figure S5
Table S1
ACKNOWLEDGMENTS
This study was supported by grants from the Natural Science Basic Research Program of Shaanxi (Program Nos. 2020JQ‐498 and 2020JQ‐496), Institutional Foundation of the First Affiliated Hospital of Xi’an Jiaotong University (2019QN‐24), and Key Research and Development Program in Shaanxi Province of China (2018SF‐ 058).
Liu Z, Mo H, Sun L, et al. Long noncoding RNA PICSAR/miR‐588/EIF6 axis regulates tumorigenesis of hepatocellular carcinoma by activating PI3K/AKT/mTOR signaling pathway. Cancer Sci. 2020;111:4118–4128. 10.1111/cas.14631
Funding information
Natural Science Basic Research Program of Shaanxi, Grant/Award Numbers 2020JQ‐498 and 2020JQ‐496; Institutional Foundation of the First Affiliated Hospital of Xi’an Jiaotong University, Grant/Award Number 2019QN‐24; Key Research and Development Program in Shaanxi Province of China, Grant/Award Number 2018SF‐ 058.
Contributor Information
Qiuran Xu, Email: windway626@sina.com.
Nan Yang, Email: nan_yang@xjtufh.edu.cn.
REFERENCES
- 1. Siegel RL, Miller KD, Jemal A. Cancer Statistics, 2017. CA Cancer J Clin. 2017;67:7‐30. [DOI] [PubMed] [Google Scholar]
- 2. Maluccio M, Covey A. Recent progress in understanding, diagnosing, and treating hepatocellular carcinoma. CA Cancer J Clin. 2012;62:394‐399. [DOI] [PubMed] [Google Scholar]
- 3. Donadon M, Solbiati L, Dawson L, et al. Hepatocellular Carcinoma: The Role of Interventional Oncology. Liver Cancer. 2016;6:34‐43. [DOI] [PMC free article] [PubMed] [Google Scholar]
- 4. El‐Serag HB, Rudolph KL. Hepatocellular carcinoma: epidemiology and molecular carcinogenesis. Gastroenterology. 2007;132:2557‐2576. [DOI] [PubMed] [Google Scholar]
- 5. Guttman M, Amit I, Garber M, et al. Chromatin signature reveals over a thousand highly conserved large non‐coding RNAs in mammals. Nature. 2009;458:223‐227. [DOI] [PMC free article] [PubMed] [Google Scholar]
- 6. Sun L, Wang L, Chen T, et al. LncRNA RUNX1‐IT1 which is downregulated by hypoxia‐driven histone deacetylase 3 represses proliferation and cancer stem‐like properties in hepatocellular carcinoma cells. Cell Death Dis. 2020;11:95. [DOI] [PMC free article] [PubMed] [Google Scholar]
- 7. Yang J, Qiu Q, Qian X, et al. Long noncoding RNA LCAT1 functions as a ceRNA to regulate RAC1 function by sponging miR‐4715‐5p in lung cancer. Mol Cancer. 2019;18:171. [DOI] [PMC free article] [PubMed] [Google Scholar]
- 8. Nagano T, Fraser P. No‐nonsense functions for long noncoding RNAs. Cell. 2011;145:178‐181. [DOI] [PubMed] [Google Scholar]
- 9. Ponting CP, Oliver PL, Reik W. Evolution and functions of long noncoding RNAs. Cell. 2009;136:629‐641. [DOI] [PubMed] [Google Scholar]
- 10. Liu Z, Wang Y, Wang L, et al. Long non‐coding RNA AGAP2‐AS1, functioning as a competitive endogenous RNA, upregulates ANXA11 expression by sponging miR‐16‐5p and promotes proliferation and metastasis in hepatocellular carcinoma. J Exp Clin Cancer Res. 2019;38:194. [DOI] [PMC free article] [PubMed] [Google Scholar] [Retracted]
- 11. Wang Y, Liu Z, Yao B, et al. Long non‐coding RNA CASC2 suppresses epithelial‐mesenchymal transition of hepatocellular carcinoma cells through CASC2/miR‐367/FBXW7 axis. Mol Cancer. 2017;16:123. [DOI] [PMC free article] [PubMed] [Google Scholar]
- 12. Wang Y, Sun L, Wang L, et al. Long non‐coding RNA DSCR8 acts as a molecular sponge for miR‐485‐5p to activate Wnt/beta‐catenin signal pathway in hepatocellular carcinoma. Cell Death Dis. 2018;9:851. [DOI] [PMC free article] [PubMed] [Google Scholar]
- 13. Liu Z, Wang Y, Dou C, et al. MicroRNA‐1468 promotes tumor progression by activating PPAR‐gamma‐mediated AKT signaling in human hepatocellular carcinoma. J Exp Clin Cancer Res. 2018;37:49. [DOI] [PMC free article] [PubMed] [Google Scholar] [Retracted]
- 14. Liu Z, Wang Y, Dou C, et al. Hypoxia‐induced up‐regulation of VASP promotes invasiveness and metastasis of hepatocellular carcinoma. Theranostics. 2018;8:4649‐4663. [DOI] [PMC free article] [PubMed] [Google Scholar]
- 15. Sun L, Wang L, Chen T, et al. microRNA‐1914, which is regulated by lncRNA DUXAP10, inhibits cell proliferation by targeting the GPR39‐mediated PI3K/AKT/mTOR pathway in HCC. J Cell Mol Med. 2019;23:8292‐8304. [DOI] [PMC free article] [PubMed] [Google Scholar]
- 16. Yao B, Li Y, Wang L, et al. MicroRNA‐3194‐3p inhibits metastasis and epithelial‐mesenchymal transition of hepatocellular carcinoma by decreasing Wnt/beta‐catenin signaling through targeting BCL9. Artif Cells Blood Substit Immobil Biotechnol. 2019;47:3885‐3895. [DOI] [PubMed] [Google Scholar]
- 17. Wang L, Sun L, Wang Y, et al. miR‐1204 promotes hepatocellular carcinoma progression through activating MAPK and c‐Jun/AP1 signaling by targeting ZNF418. Int J Biol Sci. 2019;15:1514‐1522. [DOI] [PMC free article] [PubMed] [Google Scholar] [Retracted]
- 18. Liu Z, Li C, Kang N, Malhi H, Shah VH, Maiers JL. Transforming growth factor beta (TGFbeta) cross‐talk with the unfolded protein response is critical for hepatic stellate cell activation. J Biol Chem. 2019;294:3137‐3151. [DOI] [PMC free article] [PubMed] [Google Scholar]
- 19. Ulitsky I, Bartel DP. lincRNAs: genomics, evolution, and mechanisms. Cell. 2013;154:26‐46. [DOI] [PMC free article] [PubMed] [Google Scholar]
- 20. Wang Y, Yang L, Chen T, et al. A novel lncRNA MCM3AP‐AS1 promotes the growth of hepatocellular carcinoma by targeting miR‐194‐5p/FOXA1 axis. Mol Cancer. 2019;18:28. [DOI] [PMC free article] [PubMed] [Google Scholar]
- 21. Golob‐Schwarzl N, Krassnig S, Toeglhofer AM, et al. New liver cancer biomarkers: PI3K/AKT/mTOR pathway members and eukaryotic translation initiation factors. Eur J Cancer. 2017;83:56‐70. [DOI] [PubMed] [Google Scholar]
- 22. Lin J, Yu X, Xie L, et al. eIF6 Promotes Colorectal Cancer Proliferation and Invasion by Regulating AKT‐Related Signaling Pathways. J Biomed Nanotechnol. 2019;15:1556‐1567. [DOI] [PubMed] [Google Scholar]
- 23. Yarmishyn AA, Kurochkin IV. Long noncoding RNAs: a potential novel class of cancer biomarkers. Front Genet. 2015;6:145. [DOI] [PMC free article] [PubMed] [Google Scholar]
- 24. Fatica A, Bozzoni I. Long non‐coding RNAs: new players in cell differentiation and development. Nat Rev Genet. 2014;15:7‐21. [DOI] [PubMed] [Google Scholar]
- 25. Wapinski O, Chang HY. Long noncoding RNAs and human disease. Trends Cell Biol. 2011;21:354‐361.21550244 [Google Scholar]
- 26. Jiang C, Li X, Zhao H, Liu H. Long non‐coding RNAs: potential new biomarkers for predicting tumor invasion and metastasis. Mol Cancer. 2016;15:62. [DOI] [PMC free article] [PubMed] [Google Scholar]
- 27. Mattick JS, Rinn JL. Discovery and annotation of long noncoding RNAs. Nat Struct Mol Biol. 2015;22:5‐7. [DOI] [PubMed] [Google Scholar]
- 28. Piipponen M, Nissinen L, Farshchian M, et al. Long Noncoding RNA PICSAR Promotes Growth of Cutaneous Squamous Cell Carcinoma by Regulating ERK1/2 Activity. J Invest Dermatol. 2016;136:1701‐1710. [DOI] [PubMed] [Google Scholar]
- 29. Piipponen M, Heino J, Kahari VM, Nissinen L. Long non‐coding RNA PICSAR decreases adhesion and promotes migration of squamous carcinoma cells by downregulating alpha2beta1 and alpha5beta1 integrin expression. Biol Open. 2018;7;bio037044. [DOI] [PMC free article] [PubMed] [Google Scholar]
- 30. Luo Y, Morgan SL, Wang KC. PICSAR: Long Noncoding RNA in Cutaneous Squamous Cell Carcinoma. J Invest Dermatol. 2016;136:1541‐1542. [DOI] [PMC free article] [PubMed] [Google Scholar]
- 31. Wang W, Hu W, Wang YA, et al. Long non‐coding RNA UCA1 promotes malignant phenotypes of renal cancer cells by modulating the miR‐182‐5p/DLL4 axis as a ceRNA. Mol Cancer. 2020;19:18. [DOI] [PMC free article] [PubMed] [Google Scholar]
- 32. Salmena L, Poliseno L, Tay Y, Kats L, Pandolfi PP. A ceRNA hypothesis: the Rosetta Stone of a hidden RNA language? Cell. 2011;146:353‐358. [DOI] [PMC free article] [PubMed] [Google Scholar]
- 33. Paraskevopoulou MD, Hatzigeorgiou AG. Analyzing MiRNA‐LncRNA Interactions. Methods Mol Biol. 2016;1402:271‐286. [DOI] [PubMed] [Google Scholar]
- 34. De Marco N, Iannone L, Carotenuto R, Biffo S, Vitale A, Campanella C. p27(BBP)/eIF6 acts as an anti‐apoptotic factor upstream of Bcl‐2 during Xenopus laevis development. Cell Death Differ. 2010;17:360‐372. [DOI] [PubMed] [Google Scholar]
- 35. Ji Y, Shah S, Soanes K, et al. Eukaryotic initiation factor 6 selectively regulates Wnt signaling and beta‐catenin protein synthesis. Oncogene. 2008;27:755‐762. [DOI] [PubMed] [Google Scholar]
Associated Data
This section collects any data citations, data availability statements, or supplementary materials included in this article.
Supplementary Materials
Figure S1
Figure S2
Figure S3
Figure S4
Figure S5
Table S1


