

Abstract
A blood–brain barrier (BBB) opening induced by focused ultrasound (FUS) has been widely studied as an effective way of treating brain diseases. We investigate the effect of ultrasound’s incidence angle at caudate putamen (Cp) and thalamus (Th) of the rat brain by inducing the same power of focused ultrasound that corresponds to the acoustic pressure of 0.65 MPa in free field. The BBB permeability (Ktrans) was quantitatively evaluated with dynamic contrast-enhanced magnetic resonance imaging. The group averaged (n = 11) maximum Ktrans at Cp (0.021 ± 0.012 min−1) was 1.39 times smaller than the Ktrans of Th (0.029 ± 0.01 min−1) with p = 0.00343. The group averaged (n = 6) ultrasound’s incidence angles measured using the computed tomography image of rat skulls were compared with the maximum Ktrans and showed a negatively linear relation R2 = 0.7972). The maximum acoustic pressure computed from the acoustic simulation showed higher average acoustic pressures at Th (0.37 ± 0.02 MPa) compared to pressures at Cp (0.32 ± 0.01 MPa) with p = 0.138 × 10⁻¹¹. More red blood cell were observed at the Th region compared to the Cp region in the tissue staining. These results indicate that localized characteristics of the sonication target within the subject should be considered for safer and more efficient BBB disruption induced by FUS.
Subject terms: Blood-brain barrier, Biomedical engineering
Introduction
Despite the increasing number of potent neurologically active substances and drugs, the treatment of central nervous system (CNS) disorders is still very challenging as the delivery of therapeutic agents is limited by the blood–brain barrier (BBB)1–6. BBB, unique properties of the microvasculature of the CNS, is known to prevent the transportation of molecules from the circulating blood into the brain parenchyma. As a result, more than 98% of the therapeutic agent normally cannot penetrate BBB, limiting the treatment of brain disorders, such as Alzheimer’s disease, Parkinson’s disease, strokes, and tumours7,8.
A non-invasive, localized BBB disruption (BBBD) using a short burst of focused ultrasound (FUS) incorporated with the intravenously injected microbubbles has been previously reported to overcome these limitations9–11. In addition, pre-clinical studies reported the successful delivery of several chemotherapeutic drugs, such as doxorubicin (DOX), cytarabine, and 1,3-bis (2-chloroethyl)-1-nitrosourea (BCNU) in rodent brain disease models12–14. Based on these promising pre-clinical results, clinical trials are ongoing to verify the efficacy of the FUS-induced BBBD for brain tumours (NCT03551249, NCT03714243, NCT03616860), Alzheimer’s disease (NCT03119961, NCT03671889, NCT03739905), and Parkinson’s disease (NCT03608553).
The effect of sonication parameters, including ultrasound frequency, acoustic pressure, amplitude, pulse length, sonication duration, and the dose and size of the microbubbles on the degree of BBBD has been widely studied, and their correlations are well established for better control of BBBD14–18. A previous pre-clinical study by Treat et al.14 reported a location dependence of the FUS threshold for the consist BBBD at anterior quadrants and the posterior quadrants of rat brain. Similar trends were also reported in a pre-clinical study13, where higher acoustic power was used at the anterior quadrant regions compared to the posterior quadrant regions to achieve a consistent degree of BBBD in the rat model. Additionally, previous ex-vivo studies have reported a linear dependency of the ultrasound transmission on animal body mass6,19, as the thickness of the skull increases with the body mass of the healthy subject. These results emphasize the importance of individual physiological characteristics of FUS-induced BBBD. However, the effect of localized differences on BBB permeability after FUS treatment has not been quantitatively reported.
This study investigates the correlation between the degree of BBBD using dynamic contrast-enhanced MRI (DCE-MRI) and ultrasound’s incidence angle by inducing the same level of FUS on two different regions of a rat brain (caudate putamen; Cp, thalamus; Th). In addition, acoustic simulations based on computed tomography (CT) images and haematoxylin and eosin (H&E) tissue staining were performed to analyse the difference of acoustic pressure and tissue damages on the two target regions, respectively.
Result
BBB permeability
BBB permeability (Ktrans) of each region of interest (ROI) after BBB disruption at the Cp (R1 ~ R4) and Th (R5 ~ R8) regions were computed using DCE-MRI. Figure 1a shows representative DCE-MR images at 0, 2, 4, 6, and 8 min. An MR contrast agent (CA) Gd-DTPA (Magnevist, Bayer HealthCare Pharmaceuticals, Germany), was injected at 1 min. The red and black box indicates each of four ROIs in the Cp and Th regions of the brain. The corresponding averaged signal intensity within each box, according to the time, is depicted in Fig. 1b. The signal intensity rapidly increases during the first half-minute after contrast agent injection and saturates around six minutes. The spatially averaged signal intensity after the saturation was increased 1.5 and 1.7 times at Cp and Th after CA injection, respectively. The temporal variation of the signal intensity at the artery (marked circle in Fig. 1a) was measured to derive the individual arterial input function (Fig. 1c). The increased signal intensity rapidly decreased after 30 s at the artery owing to CA washout. Figure 1d shows the corresponding Ktrans map. The averaged Ktrans was 0.030 ± 0.025 min−1 at the Th and 0.059 ± 0.039 min−1 at the Cp.
Figure 1.

(a) A representative DCE image of a rat brain before and 2, 4, 6 and 8 min after sonication. Black and red box indicate Cp and Th, respectively. An arterial input function was measured at an artery near the sonication site marked as a white circle. A scale bar indicates 1 cm. An average signal intensity of (b) Cp (triangle), Th (circle), and (c) arterial input function according to time. (d) A Ktrans map after FUS induced sonication. (e) Group averaged (n = 11) maximum Ktrans of each ROI, where grey and blank bar indicates ROI at Cp and Th, respectively. (f) A averaged maximum Ktrans of Cp (triangle) and Th (circle). (g) A box plot grouped Cp_in (R2, R4) Cp_out (R1, R3), Th_in (R6, R8) and Th_out (R5, R7) marked with a triangle, empty triangle, circle, and empty circle, respectively. A representative DCE case is marked with a square.
The group averaged maximum Ktrans (n = 11) of each ROI is shown in Fig. 1e. Values at R1–R8 were 0.017 ± 0.005, 0.026 ± 0.008, 0.015 ± 0.003, 0.023 ± 0.005, 0.023 ± 0.007, 0.031 ± 0.007, 0.029 ± 0.006, and 0.032 ± 0.009 min−1, respectively. The highest and lowest groups averaged maximum Ktrans was found at R8 and R3, respectively, and the group averaged maximum Ktrans of Cp (0.021 ± 0.012 min−1) was 1.39 times smaller than the Ktrans of Th (0.029 ± 0.014 min−1), with p = 0.00343 (Fig. 1f). In general, medial ROI (even number) showed higher maximum Ktrans compared to the corresponding lateral ones (odd number). The group averaged maximum Ktrans of medial ROI (0.024 ± 0.013 min−1) at Cp were 1.51 times higher than the lateral ROI at Cp (0.016 ± 0.009 min−1) with p = 0.0204. Meanwhile, the group averaged maximum Ktrans of medial ROI (0.027 ± 0.013 min−1) at Th were 1.41 times higher than the lateral ROI at Th (0.019 ± 0.012 min−1), with p = 0.232 as shown in Fig. 1g.
The incidence angle of the ultrasound beam
A group averaged (n = 6) sagittal, axial, and incidence angle of each ROI are shown in Fig. 2. The group averaged angle of Cp (11.14 ± 2.52°) was 2.7 times higher than that of Th (4.13 ± 1.95°), with p = 0.667 × 10⁻¹⁵ (Fig. 2a) in the sagittal view, indicating that the rat skull was slightly pitched forward when fixed on the stereotactic frame used in this study. In addition, the group averaged sagittal angle of lateral ROI (13.64 ± 2.52°) was 1.96 times higher than that of the medial ROI (6.96 ± 1.66°) in Cp, with p = 2.167 × 10⁻⁷, while the group averaged angle of lateral ROI (14.11 ± 2.51°) was 1.95 times higher than that of the medial ROI (7.24 ± 2.25°) in Th, with p = 8.269 × 10⁻⁷ (Fig. 2b). The higher angle of lateral ROI in the axial view indicates the hemispheroidal anatomy of the rat skull. The averaged incidence angle at Cp (14.65 ± 3.38°) was 1.38 times higher than the averaged angle at Th (10.56 ± 3.79°), with p = 0.891 × 10⁻⁵ (Fig. 2c). Highest incidence angle was found at R1 (20.34 ± 0.96°), and the lowest was at R8 (9.74 ± 0.81°).
Figure 2.
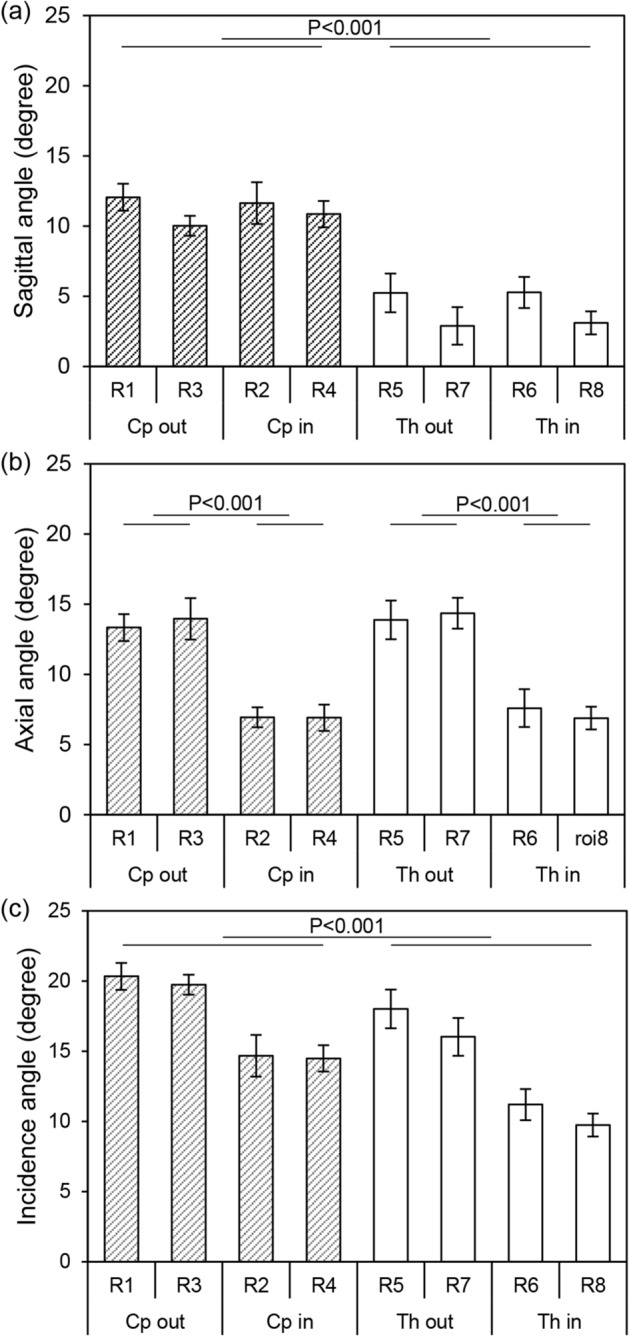
A group averaged angle (n = 6) of each ROI measured at (a) sagittal view, (b) axial view, and (c) incidence angle from 3D reconstructed surface. Grey and blank bar indicate Cp and Th, respectively.
Acoustic simulation
Figure 3 shows the representative acoustic simulation result and group averaged (n = 6) maximum acoustic pressure based on the rat skull anatomy reconstructed from the CT images. A maximum acoustic pressure field of each ROI was superimposed in the coronal (Fig. 3a) and two sagittal (Fig. 3b: medial and Fig. 3c: lateral) views. In the sagittal view, the Th region shows higher acoustic pressure, both in the lateral (Fig. 3b) and medial (Fig. 3c) cut planes. An average group (n = 6) simulation result, which compares the average maximum acoustic pressure of Cp (0.32 ± 0.01 MPa) and Th (0.37 ± 0.02 MPa), is shown in Fig. 4d. The average maximum acoustic pressure of Th was 1.16 times higher than that of Cp, with p = 0.138 × 10⁻¹¹.
Figure 3.
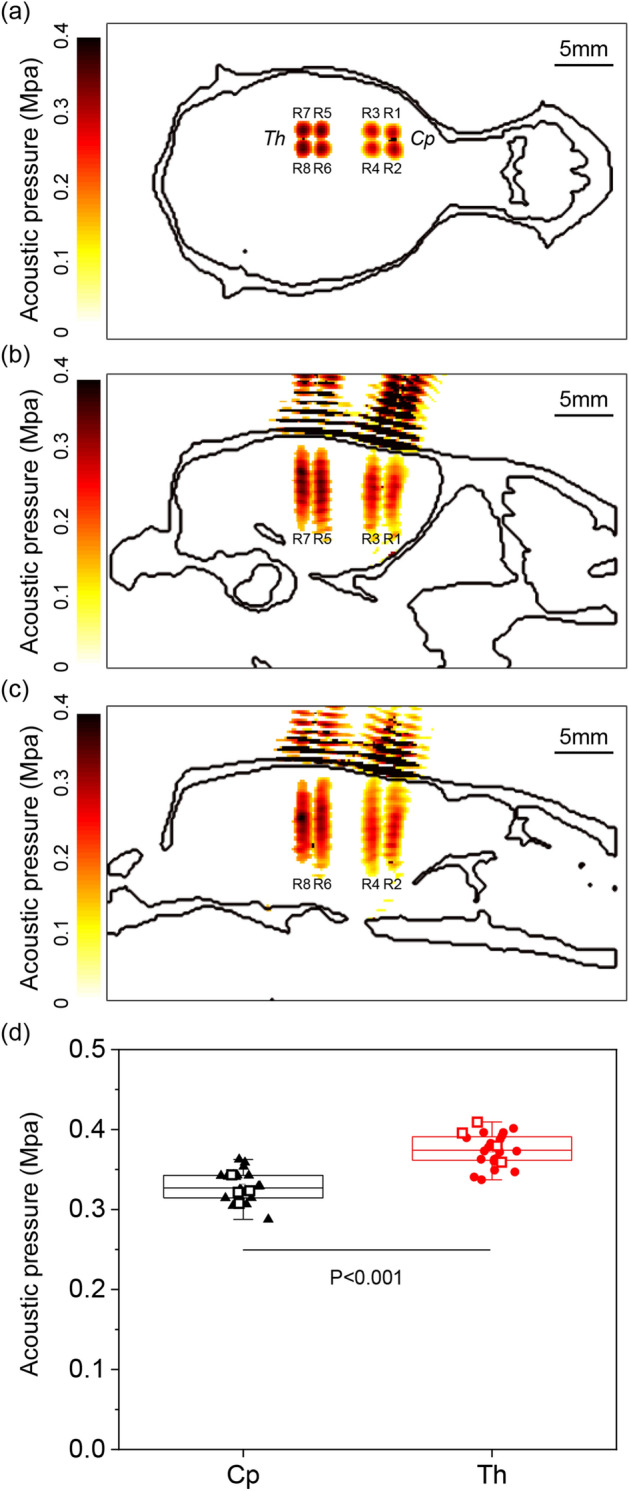
A representative acoustic pressure field simulation based on CT images on (a) coronal view, (b) lateral sagittal view, and (c) medial sagittal view. (d) Average acoustic pressure of Cp (triangle) and Th (circle). A representative simulation case is marked with a square. Images were generated using MATLAB R2017b (The Mathworks, USA).
Figure 4.

(a) BBB permeability Ktrans and corresponding incidence angle of ROI. (b) BBB permeability Ktrans and corresponding acoustic pressure of ROI. The dotted line represents linear fitting. The error bar in the x and y directions indicate standard deviation. Numbers indicate target regions, where 1 and 3 are in the lateral Cp, 2 and 4 are in the medial Cp, 5 and 7 are in the lateral Th and 6 and 8 are in the medial Th.
Correlation between BBB permeability, incidence angle and acoustic pressure
The BBB permeability (Ktrans) of eight different ROIs calculated from the DCE-MRI (n = 11) group was compared with the incidence angle and the acoustic pressure measured and simulated from the CT (n = 6) group as depicted in Fig. 4a and b, respectively. The Ktrans decreases as the incidence angle increases with R2 = 0.7972 and increases as the acoustic pressure increases (R2 = 0.4152). The red dot marked ROIs in Th regions. ROIs were distinctively grouped according to the brain region and the relative location (medial and lateral). The largest incidence angle group showed the lowest Ktrans (R1 and R3; Cp_out), while the smallest incidence angle group showed the highest Ktrans (R6 an R8; Th_in). R2 and R4; Cp_in, R5, and R7; Th_out were also grouped and positioned in the mid-range of the incidence angle and Ktrans. A correlation between Ktrans and sagittal or axial angles showed a similar negative relationship with an R2 of 0.6941 and 0.3498, respectively. In addition, the average group mean Ktrans (means of 5 slices in which Ktrans was measured) linearly decreases with an increase in the incidence angle (R2 = 0.7664), similar to the maximum Ktrans. (Supplementary information S.1).
Tissue staining
Two different observers scored H&E histopathological images from a randomly selected case in the DCE-MRI group (n = 11), as described in the Methods—Histology section, by counting the red blood cell (RBC) at eight different ROIs (Fig. 5a). A representative H&E staining result of Cp (R1) and Th (R8) shows no significant region cavities (Fig. 5b,c, respectively). A few RBCs were observed, but no RBC clusters (n > 5) were found in Cp (R1 ~ R4). A few RBC clusters were observed in Th (R5 ~ R8). The average H&E score of Cp was 1.1 ± 0.89 and was 20% smaller than the average H&E score of Th (2.11 ± 0.79), with p = 0.000184 as shown in Fig. 5d. Here, R8 showed the highest H&E score of 2.37 ± 0.49, and R3 showed the lowest score of 0.43 ± 0.31. In addition, the H&E images were scored higher when Ktrans was high, with R2 values of 0.4503 as shown in Fig. 5e.
Figure 5.

(a) A representative H&E staining image of eight different ROIs and 20 × magnified images of (b) R1 and (c) R8, respectively. A subset image shows the clusters of RBC. (d) The averaged H&E score of each ROI. (e) A correlation between the averaged H&E score and the corresponding Ktrans. Dashed line indicates the linear fitting curve with R2 = 0.4503. Cp and Th are marked with a triangle and circle, respectively.
Discussion
This study aimed to investigate the degree of local permeability differences after FUS-induced BBBD at two representative ROIs in the rat brain (Caudate putamen and Thalamus). These two regions are widely used in pre-clinical rodent BBB experiments, as the Cp region (or striatum) involves motor function, and therefore has a possible application for Huntington’s and Parkinson’s disease treatment7,8. Meanwhile, the Th region located dorsal to the hippocampus is a potential target for Alzheimer’s disease treatment13,20. Recent advances in acoustic monitoring and feedback-controlled sonication demonstrated in a pre-clinical and clinical study may mitigate location-specific variability and safely control the BBB permeability21–25. Yet even with the feedback-controlled sonication, inter- and intra-subject variation was reported, hence understanding the sources of variability is important21,26.
In this study, a fixed acoustic power of corresponds to 0.65 MPa was used to sonicate the Cp and Th regions, yet the averaged Ktrans of Cp was 33.1% smaller than the averaged Ktrans of Th, as shown in Fig. 1f. In the previous study14, Cp and Th regions also had different MRI signal enhancement and leakage of trypan blue when sonicated under the same acoustic pressure, which indicates a difference in the level of BBB disruption. Considering these local differences, several previous pre-clinical studies13,27 used a higher level of acoustic power at Cp to achieve a similar level of BBB disruption, which resulted in a similar (around twofold) increase of chemotherapeutic substance DOX delivery compared to the contralateral hemisphere of both Cp and Th. The local concentration of DOX delivered to the sonication target was linearly correlated with the MRI signal enhancement and the BBB permeability Ktrans14,28. In addition, several attempts were made to enhance the local delivery of the chemotherapeutic agents by using multiple sonications29 or additional sonication without microbubbles before the main sonication27 and resulted in 26.08% (double sonication) and 75% (triple sonication) of DOX delivery increment. When compared to these attempts, a 33.1% difference in Ktrans induced by the target’s characteristic reported in this study cannot be neglected as the following outcomes of the chemotherapeutic treatment may vary due to the DOX delivery difference30.
As shown in the H&E staining results (Fig. 5), no tissue damage except a few extravasated RBCs near blood vessels was found in the Cp region. When scored by two different observers, the average score measured in a representative sample between Cp and Th was statistically significant (p < 0.001) and linearly correlated with the BBB permeability measured in the sonication group at given ROIs (n = 11). Although enhanced BBB permeability can improve the delivery of the target substances, excessive acoustic energy can induce damages, such as extravasation, intracerebral haemorrhages, tissue damages, and edema11,31. Additionally, a recent study by Kovacs et al.32 demonstrated possible inflammation after the pulsed FUS treatment. As shown in Figs. 1 and 2, the regional differences in BBB permeability, as well as the incidence angle of Cp and Th, were statistically significant regardless of the variation between the individual ROIs and subjects. Differences in the degree of BBBD can be explained by the transmission of ultrasound energy, as shown in this study acoustic simulation’ results, where the averaged acoustic pressure of the focal area was lower at the Cp region compared to the Th region (Fig. 3). In our previous study, a free field ultrasound pressure distribution was measured using the Acoustic Intensity Measurement System (AIMS III, ONDA, USA) with and without a rat skullcap, in which the rodent skull insertion loss was 53.84 ± 0.91%. Using the identical transducer and experimental system, the group average acoustic pressure simulated in the current study was 50.58 ± 2.83 and 57.59 ± 0.13% of insertion loss at Cp and Th, respectively which are comparable with the previous study19. Moreover, the Ktrnas and incidence angle of individual ROIs showed a strong correlation (R2 = 0.7972) (Fig. 4a). However, it is important to note that these measurements were not made on the same animal, hence inter-subject variation may exist. In addition, the skull’s inhomogeneity was not reflected in the current acoustic simulation, which is known to affect the precision of the ultrasound wave propagation especially in the human model7,8. However, the ultrasound wavelength (2.52 mm in the skull) of 1.113 MHz used in this study is larger than the typical rat skull’s thickness (less than 1 mm). The effect of homogeneous assumption may not be significant here than in the human skull (6.5 ~ 7.1 mm).
According to a previous study by Park et al.33, the averaged reflection coefficient inherited by the angle of incidence showed an inverse-linear relationship with acoustic pressure. In addition, another previous study by White et al.34 reported a decrease of the acoustic power transmitted via the skull of up to 30° of incidence angle, depending on the frequency. They also reported that there is a shear mode conversion during trans-human skull ultrasound propagation, especially in the high incidence angle. Thickness and curvature of the rat skull differ from the human skull, and the incidence angle in this study ranged from 9.73 ± 0.81 ~ 20.33 ± 0.96°. Current simulation results did not consider the shear mode conversion to simplify the simulation, and therefore warrants further studies. It is evident that the increased reflection owing to the incidence angle reduces the acoustic pressure and results in a decreased Ktrans. Some studies reported that an increase in the incidence angle might also affect the formation of the standing wave, especially in the small-animal pre-clinical models owing to their small cavity size. Acoustic simulation case was additionally repeated with a skullcap (bottom half removed) to analyse the standing wave formation and its effect on the acoustic pressure field. The formation of standing waves was noticeable in the acoustic pressure map compared to simulation case with the whole skull cavity. The maximum acoustic pressure in Cp and Th were increased 6.31 ± 3.87% and 6.95 ± 1.78%, respectively compare to the bottom half removed case. This suggests that the standing wave formation may also effect the local differences in BBB, especially for the small cavity subjects. (Supplementary information S.2).
Regardless of the high correlation between the permeability and incidence angles, this study has a few limitations that should be considered in future work. First, the comparison was not done on the same animal and the same transducer-skull registration, but from the same regions measured in different animal groups. However, the ear and tooth of the rat were tightly fixed to the stereotactic frame, and MR and CT images were sliced parallel to the animal bed, which fixes the transducer-skull orientation. In addition, regional differences in the permeability and incidence angles were statistically significant within the study group, which explains the correlation between these two parameters. Second, there could be another physiochemical effect that has not been considered in this study. Skull thickness is also known to affect the overall acoustic transmission in small animal models. Similar to this study, Gerstenmayer, et al.6 reported that the front part (Cp region of this study) showed a higher transmission rate compared to the middle part (Th region). Meanwhile, skull thickness in those two regions was identical within the subject. The size and density of the microvessel may also play an important role, as the FUS treatment involves the cavitation forces from the microbubble within the microvessel of the targeted area. According to a previous study, the interdependency of local capillary density in rat brains showed 460 ± 12.1 capillary sections per mm2 in Th and 363 ± 10.1/mm2 in Cp35. However, this aspect was not addressed in this study. In addition, chemotherapeutic agent delivery was not performed in this study, as it is previously known to be linearly related to BBB permeability. Although a wide range of incidence angles should be tested, for an easier and robust experiment the incidence angles of only two different ROIs were used in this study. Other parameters, such as tissue attenuation and local microbubble distribution attributed from the local differences in the size and density of micro-vessel were not controlled in this study, and their effect should be validated in future studies.
In conclusion, this study demonstrates a negative linear relationship between the incidence angle and the degree of permeability in vivo, mainly owing to the decrease in the acoustic power in a healthy rodent model. As the degree of permeability increases, a few extravasated RBCs near blood vessels were observed, but without any significant tissue damage. Even though the incidence angle is a primary source of the local differences in pre-clinical rodent experiments, tissue properties, including attenuation coefficient, capillary size, and density, may affect the degree of BBBD. Further studies on these will be beneficial for accurate and safe control of BBBD.
Methods
Animals
All experiments were conducted following procedures approved by the Daegu-Gyeongbuk Medical Innovation Foundation (DGMIF) Institutional Animal Care and Use Committee (IACUC, DGMIF-19100701-00). All procedures and animal handling were carried out following the ethical guidelines for animal research, with no pain or suffering of the animal. Animals (18 male Sprague–Dawley rats; eight weeks old; weighing 330 ± 28 g, Orient Bio Inc., Seongnam, Korea) were anesthetized with a mixture of Zoletil (35 mg/kg) and Rompun (5 mg/kg) before all experiments. The rats used in this study were randomly divided into two different experimental groups for measuring BBB permeability (n = 11) and incidence angle (n = 6).
Focused ultrasound sonication
A 10 ms burst sonication at a 0.65 MPa peak rarefaction focal pressure (PRFP) measured in a free water condition with 1 Hz pulse repetition frequency (PRF) for 120 s was delivered to the targeted area (Cp and Th) of rat brains in a supine position as shown in Fig. 6a. The ultrasound system and the experimental setup used in this experiment were identical to the previous study, where the free field ultrasound pressure distribution was measured using the Acoustic Intensity Measurement System (AIMS III, ONDA, USA)36. In brief, rat brains for BBB disruption were sonicated using a pre-clinical MRI guided Focused Ultrasound (MRgFUS) system (RK-100, FUS Instruments, Toronto, Canada). A spherically curved single-element piezoelectric transducer (FUS Instrument, Toronto, Canada) with a diameter of 75 mm, focal length of 60 mm, and a resonant frequency of 1.113 MHz was used for the sonication. Every four locations in the Cp (R1 ~ R4) and Th (R5 ~ R8) regions in the right hemisphere were set as the sonication targets, where the centres of targets were 1.5 mm apart from each other at each region of the brain. The reference region for Cp (R2) was 1.5 mm right and 1.5 mm anterior to the bregma, while the reference region for Th (R6) was 1.5 mm right and 3.5 mm anterior to the lambda (Fig. 6b). Focal spots were located 5 mm under the brain skull. Each sonication was applied synchronously to an intravenous injection of microbubble (Definity, Lantheus Medical Imaging, N.Billerica, MA), which consists of a C3D8 gas encapsulated by an outer phospholipid shell. The solution was diluted 50-fold in saline and intravenously injected at a dose of 10 μL/kg. Microbubbles with less than two hours of activation were used (manufacturer’s guidelines < 12 h) to assure a similar level of microbubble concentration for each experiment. The order of the sonication group was randomized (4 targets sonicated in Cp followed by 4 targets in Th and vice versa) in order to minimize the experimental bias. A five-minute delay was allowed between sonication to clear the bubble from the system and minimize the increase of microbubble concentration during the second exposure based on previous studies37,38.
Figure 6.

(a) A schematic of focused ultrasound blood brain barrier disruption system. (b) A T1-weighted MR image that represents 8 different sonication regions (Cp: R1 ~ R4, Th: R1 ~ R4). (c) An experimental protocol, which includes anaesthesia, sonication target guide by MRI (T2-weighted image), sonication, dynamic contrast-enhanced MRI, and sacrifice. (d) 3D volume rendering of a rat skull and the sagittal (dashed) and axial (dotted) plane for the angle measurement. Yellow and green dotted lines indicate Cp and Th, while red and blue dashed lines indicate medial and lateral ROIs, respectively. (e) Angle between the surface normal (solid line) derived from the surface tangential (dotted line) and the sonication path (dashed line) were measured as the sagittal and axial angles. 3D volume rendering image was generated using RadiAnt DICOM viewer 4.6.5 64-bit (Medixant Company, Poland).
Magnetic resonance imaging
The imaging was performed using the 9.4 T pre-clinical MRI system (BioSpec 94/20 USR, Bruker, Ettlingen, Germany). An 86 mm inner diameter volume coil was used for RF transmission and signal reception. A 2D rapid-acquisition with relaxation enhancement (RARE) T1-weighted pulse sequence (echo time; TE = 6.5 ms, repetition time; TR = 1500 ms, field of view; FOV = 40 × 40 mm2, matrix size = 256 × 256, bandwidth = 100,000 Hz, RARE factor = 4 and slice thickness = 1.5 mm) in coronal view was used to detect the local BBB disruption. A 2D RARE T2-weighted pulse sequence (echo time; TE = 33 ms, repetition time; TR = 2500 ms field of view; FOV = 40 × 40 mm2, matrix size = 256 × 256, bandwidth = 36,765 Hz, RARE factor = 8 and slice thickness = 1.5 mm) in coronal view was used to guide the sonication procedure, similar to previous studies13,27,28,36.
A RARE with variable repetition time TR (RARE VTR) pulse sequence (TE = 7.5 ms, TR = 160, 180, 200, 250, 300, 400, 500, 600, 700, 800, 900, 1000, 1200, 1500, 1800, 2000, 2500, 3000, 3500, 4000, 6000, and 12,000 ms, FOV = 40 × 40 mm2, matrix size = 128 × 128, bandwidth = 78,125 Hz, RARE factor = 1, and slice thickness = 1.5 mm) in coronal view was used for the T1 mapping before sonication. Ten pre-contrast sets of fast low-angle shot (FLASH) DCE-MRI (TE = 1.3 ms, TR = 24.4 ms, FOV = 40 × 40 mm2, matrix size = 128 × 128, bandwidth = 85,227 Hz, slice thickness = 1.5 mm) followed by an additional 90 sets under the intravenous administration of CA were acquired in a coronal view with a temporal resolution of 6 s for ten minutes to calculate the BBB permeability. A total of five slices with a 1.5 mm gap were used for T1 mapping and DCE-MRI, while the middle slice (3rd) was positioned at the focal area of the sonication (~ 5 mm under the skull). The permeability (Ktrans) of eight individual sonicated areas at five different slices, which mostly covered the brain tissue (4-pixel circle diameter corresponding to the 1.5 mm focal area of the transducer (3.2 pixels/mm), was calculated using the Patlak model39 (Eq. 1).
| 1 |
Here, t, τ, Vp Ct(t) and Cp(t) indicate the time step, variable of integration, plasma volume, and temporal variation of the contrast agent concentration in the tissue and the plasma, respectively. The Cp(t), also known as the arterial input function (AIF), was individually measured in a feeding vessel close to the ROI40, and the capillary haematocrit level was adjusted to 45%41. The maximum Ktrans in this study represents the maximum value of the five slices of the volume of interest (1.5 × 1.5 × 7.5 mm3), while the mean Ktrans indicates the average of Ktrans measured in the five different MRI slices. An overall experimental protocol includes anaesthesia, sonication target guide by MRI (T2 image), sonication, dynamic contrast-enhanced MRI, and sacrifice as shown in Fig. 6c.
Computational rat model and acoustic simulation
For the acoustic simulation, the computational rat model used in this study was obtained using a pre-clinical micro-CT (R_mCT2, Rigaku, Japan) images of rats (n = 6) with a spatial resolution of 0.082 mm/pixel. A volume of interest was set parallel to the transducer in order to replicate the orientation of the transducer with respect to the rodent skull reconstructed in 3D. The relative orientation was confirmed using a clinical CT (Siemens Biograph mCT, Germany) image of the entire sonication system including the water chamber, transducer, animal bed, and animal fixed on a stereotaxic frame. The computation model was constructed as three parts (skin, skull, and brain) and was extracted using CT Hounsfield units of the micro-CT images. Physical properties of the medium used in the simulation are given in Table 1.
Table 1.
Acoustic properties of computational rat model.
Acoustic simulations with the same transducer positions and targets used in the BBB opening experiment (guided by the bregma and lambda of 3D reconstructed rat skull) were performed to investigate the acoustic pressures and the focusing effects at the target in the brain. A commercial acoustic simulation software (Sim4Life, ZMT, Switzerland) was used to numerically solve the linear acoustic pressure wave equation (Eq. 2)
| 2 |
where ρ, p, c, and α are the local density, acoustic pressure, speed of sound, and absorption, respectively, and t is the time. This simulation software was numerically and experimentally validated in free water as well as the transcranial conditions (sheep skull) using the ‘Gamma-method’ to judge the quality of simulation and measurement agreement43–45. The domain of the acoustic simulation performed in this study was 603 × 603 × 716 grid points, with a spatial discretization of ten points per wavelength (i.e., 0.133 mm). The pulse duration of sonication was set at 89 µs to reduce the computation time, and a time step of 27.3 ns was used to compute the simulation. The two sagittal (dashed) and four axial (dotted) views that pass each sonication region were computed using a multi-planar reconstruction (MPR) of the 3D skull feature (Fig. 6d). The angle between the surface normal and the transducer beam path was measured as sagittal and axial angles (Fig. 6e). The intra- and inter-observer variation of the incidence angle measurement was small (R2 = 0.8841 and 0.8197, respectively). The incidence angle calculated from the observer’s measurements showed good agreement (R2 = 0.7895) with the incidence angle directly measured from the 3D skull feature by averaging the normal vectors within the ultrasound focal area (1 mm2).
Histology
A brain of a rat was extracted and embedded in paraffin for the 4 μm sectioning in the axial view (perpendicular to the direction of ultrasound beam propagation) to evaluate the histological effects of the sonicated region. Three representative planes, including the focal area of the ultrasound, were stained with haematoxylin and eosin. Histological scoring was performed on eight different sonicated regions as well as its contralateral area of the opposite hemisphere. Each section was scored between 1 (0 < n < 5), 2 (5 < n < 10), and 3 (n > 10) according to the number of red blood cells by two different observers. The inter-observer variation was minimal, with the bias of − 0.126 and the 95% limit of agreement of 0.391 and − 0.647 (R2 = 0.9394).
Statistical analysis
The statistical analysis was performed using SPSS software (IBM SPSS Statistics; IBM Corp., Armonk, NY, USA) by two researchers blind to the animal assignment. All data was presented as the mean ± standard deviation and analysed with the equal variance two-tailed t-test.
Supplementary information
Acknowledgements
This research was supported by the National Research Foundation of Korea (NRF), funded by the Ministry of Science, ICT & Future Planning [Grant Number NRF-2016M3C7A1913933, NRF-2019M3E5D1A02069399, and NRF-2019R1C1C1011615]. The funder had no role in study design, data collection, analysis, decision to publish, or preparation of the manuscript. We also thank to Zurich MedTech ZMT for providing free license of Sim4Life used in this study.
Author contributions
H.H.: Conceptualization, validation, writing-original manuscript and editing. T.P.: Acoustic simulation, writing-original manuscript. H.S.: Acoustic simulation, data analysis, writing-draft. M.H.: Animal experiments, data analysis, writing-draft. B.J.: Animal experiments, data analysis. H.C.: Tissue staining, data analysis. E.L.: Tissue staining, data analysis. K.P.: Acoustic simulation. H.K.: Supervision, editing. J.P.: Funding acquisition, supervision, writing-original manuscript and editing.
Competing interests
The authors declare no competing interests.
Footnotes
Publisher's note
Springer Nature remains neutral with regard to jurisdictional claims in published maps and institutional affiliations.
Contributor Information
Hyungmin Kim, Email: hk@kist.re.kr.
Juyoung Park, Email: jyp@dgmif.re.kr.
Supplementary information
is available for this paper at 10.1038/s41598-020-76259-z.
References
- 1.Eichler AF, et al. The biology of brain metastases-translation to new therapies. Nat. Rev. Clin. Oncol. 2011;8:344–356. doi: 10.1038/nrclinonc.2011.58. [DOI] [PMC free article] [PubMed] [Google Scholar]
- 2.Abbott NJ, Romero IA. Transporting therapeutics across the blood-brain barrier. Mol. Med. Today. 1996;2:106–113. doi: 10.1016/1357-4310(96)88720-X. [DOI] [PubMed] [Google Scholar]
- 3.Groothuis DR. The blood-brain and blood-tumor barriers: a review of strategies for increasing drug delivery. Neuro-oncology. 2000;2:45–59. doi: 10.1093/neuonc/2.1.45. [DOI] [PMC free article] [PubMed] [Google Scholar]
- 4.Zlokovic BV. Neurovascular pathways to neurodegeneration in Alzheimer's disease and other disorders. Nat. Rev. Neurosci. 2011;12:723–738. doi: 10.1038/nrn3114. [DOI] [PMC free article] [PubMed] [Google Scholar]
- 5.Kalaria RN. Vascular basis for brain degeneration: faltering controls and risk factors for dementia. Nutr. Rev. 2010;68:1753–4887. doi: 10.1111/j.1753-4887.2010.00352.x. [DOI] [PMC free article] [PubMed] [Google Scholar]
- 6.Gerstenmayer M, Fellah B, Magnin R, Selingue E, Larrat B. Acoustic transmission factor through the rat skull as a function of body mass, frequency and position. Ultrasound Med. Biol. 2018;44:2336–2344. doi: 10.1016/j.ultrasmedbio.2018.06.005. [DOI] [PubMed] [Google Scholar]
- 7.Pardridge WM. The blood-brain barrier: bottleneck in brain drug development. NeuroRx. 2005;2:3–14. doi: 10.1602/neurorx.2.1.3. [DOI] [PMC free article] [PubMed] [Google Scholar]
- 8.Dong X. Current strategies for brain drug delivery. Theranostics. 2018;8:1481–1493. doi: 10.7150/thno.21254. [DOI] [PMC free article] [PubMed] [Google Scholar]
- 9.Hynynen K, McDannold N, Vykhodtseva N, Jolesz FA. Noninvasive MR imaging-guided focal opening of the blood-brain barrier in rabbits. Radiology. 2001;220:640–646. doi: 10.1148/radiol.2202001804. [DOI] [PubMed] [Google Scholar]
- 10.Hynynen K, et al. Focal disruption of the blood-brain barrier due to 260-kHz ultrasound bursts: a method for molecular imaging and targeted drug delivery. J. Neurosurg. 2006;105:445–454. doi: 10.3171/jns.2006.105.3.445. [DOI] [PubMed] [Google Scholar]
- 11.McDannold N, Vykhodtseva N, Raymond S, Jolesz FA, Hynynen K. MRI-guided targeted blood-brain barrier disruption with focused ultrasound: histological findings in rabbits. Ultrasound Med. Biol. 2005;31:1527–1537. doi: 10.1016/j.ultrasmedbio.2005.07.010. [DOI] [PubMed] [Google Scholar]
- 12.Liu HL, Yang HW, Hua MY, Wei KC. Enhanced therapeutic agent delivery through magnetic resonance imaging-monitored focused ultrasound blood-brain barrier disruption for brain tumor treatment: an overview of the current preclinical status. Neurosurg. Focus. 2012;32:E4. doi: 10.3171/2011.10.focus11238. [DOI] [PubMed] [Google Scholar]
- 13.Park J, Zhang Y, Vykhodtseva N, Jolesz FA, McDannold NJ. The kinetics of blood brain barrier permeability and targeted doxorubicin delivery into brain induced by focused ultrasound. J. Control. Release. 2012;162:134–142. doi: 10.1016/j.jconrel.2012.06.012. [DOI] [PMC free article] [PubMed] [Google Scholar]
- 14.Treat LH, et al. Targeted delivery of doxorubicin to the rat brain at therapeutic levels using MRI-guided focused ultrasound. Int. J. Cancer. 2007;121:901–907. doi: 10.1002/ijc.22732. [DOI] [PubMed] [Google Scholar]
- 15.McDannold N, Vykhodtseva N, Hynynen K. Effects of acoustic parameters and ultrasound contrast agent dose on focused-ultrasound induced blood-brain barrier disruption. Ultrasound Med. Biol. 2008;34:930–937. doi: 10.1016/j.ultrasmedbio.2007.11.009. [DOI] [PMC free article] [PubMed] [Google Scholar]
- 16.McDannold N, Vykhodtseva N, Hynynen K. Blood-brain barrier disruption induced by focused ultrasound and circulating preformed microbubbles appears to be characterized by the mechanical index. Ultrasound Med. Biol. 2008;34:834–840. doi: 10.1016/j.ultrasmedbio.2007.10.016. [DOI] [PMC free article] [PubMed] [Google Scholar]
- 17.Yang F-Y, Fu W-M, Chen W-S, Yeh W-L, Lin W-L. Quantitative evaluation of the use of microbubbles with transcranial focused ultrasound on blood–brain-barrier disruption. Ultrason. Sonochem. 2008;15:636–643. doi: 10.1016/j.ultsonch.2007.08.003. [DOI] [PubMed] [Google Scholar]
- 18.Yang F-Y, et al. Quantitative evaluation of focused ultrasound with a contrast agent on blood-brain barrier disruption. Ultrasound Med. Biol. 2007;33:1421–1427. doi: 10.1016/j.ultrasmedbio.2007.04.006. [DOI] [PubMed] [Google Scholar]
- 19.O’Reilly MA, Muller A, Hynynen K. Ultrasound insertion loss of rat parietal bone appears to be proportional to animal mass at submegahertz frequencies. Ultrasound Med. Biol. 2011;37:1930–1937. doi: 10.1016/j.ultrasmedbio.2011.08.001. [DOI] [PMC free article] [PubMed] [Google Scholar]
- 20.Burgess A, et al. Alzheimer disease in a mouse model: MR imaging–guided focused ultrasound targeted to the hippocampus opens the blood-brain barrier and improves pathologic abnormalities and behavior. Radiology. 2014;273:736–745. doi: 10.1148/radiol.14140245. [DOI] [PMC free article] [PubMed] [Google Scholar]
- 21.Jones RM, et al. Three-dimensional transcranial microbubble imaging for guiding volumetric ultrasound-mediated blood-brain barrier opening. Theranostics. 2018;8:2909. doi: 10.7150/thno.24911. [DOI] [PMC free article] [PubMed] [Google Scholar]
- 22.O’Reilly MA, Hynynen K. Blood-brain barrier: Real-time feedback-controlled focused ultrasound disruption by using an acoustic emissions–based controller. Radiology. 2012;263:96–106. doi: 10.1148/radiol.11111417. [DOI] [PMC free article] [PubMed] [Google Scholar]
- 23.Sun T, et al. Closed-loop control of targeted ultrasound drug delivery across the blood–brain/tumor barriers in a rat glioma model. Proc. Natl. Acad. Sci. 2017;114:E10281–E10290. doi: 10.1073/pnas.1713328114. [DOI] [PMC free article] [PubMed] [Google Scholar]
- 24.Jones RM, Hynynen K. Advances in acoustic monitoring and control of focused ultrasound-mediated increases in blood-brain barrier permeability. Br. J. Radiol. 2019;92:20180601. doi: 10.1259/bjr.20180601. [DOI] [PMC free article] [PubMed] [Google Scholar]
- 25.Lipsman N, et al. Blood–brain barrier opening in Alzheimer’s disease using MR-guided focused ultrasound. Nat. Commun. 2018;9:1–8. doi: 10.1038/s41467-018-04529-6. [DOI] [PMC free article] [PubMed] [Google Scholar]
- 26.O'Reilly MA, et al. Investigation of the safety of focused ultrasound-induced blood-brain barrier opening in a natural canine model of aging. Theranostics. 2017;7:3573. doi: 10.7150/thno.20621. [DOI] [PMC free article] [PubMed] [Google Scholar]
- 27.Jung B, Huh H, Lee E-H, Han M, Park J. An advanced focused ultrasound protocol improves the blood-brain barrier permeability and doxorubicin delivery into the rat brain. J. Control. Release. 2019;315:55–64. doi: 10.1016/j.jconrel.2019.10.044. [DOI] [PubMed] [Google Scholar]
- 28.Park J, Aryal M, Vykhodtseva N, Zhang Y-Z, McDannold N. Evaluation of permeability, doxorubicin delivery, and drug retention in a rat brain tumor model after ultrasound-induced blood-tumor barrier disruption. J. Control. Release. 2017;250:77–85. doi: 10.1016/j.jconrel.2016.10.011. [DOI] [PMC free article] [PubMed] [Google Scholar]
- 29.Nhan T, Burgess A, Lilge L, Hynynen K. Modeling localized delivery of Doxorubicin to the brain following focused ultrasound enhanced blood-brain barrier permeability. Phys. Med. Biol. 2014;59:5987. doi: 10.1088/0031-9155/59/20/5987. [DOI] [PubMed] [Google Scholar]
- 30.Speth P, Van Hoesel Q, Haanen C. Clinical pharmacokinetics of doxorubicin. Clin. Pharmacokinet. 1988;15:15–31. doi: 10.2165/00003088-198815010-00002. [DOI] [PubMed] [Google Scholar]
- 31.Hynynen K, McDannold N, Sheikov NA, Jolesz FA, Vykhodtseva N. Local and reversible blood–brain barrier disruption by noninvasive focused ultrasound at frequencies suitable for trans-skull sonications. Neuroimage. 2005;24:12–20. doi: 10.1016/j.neuroimage.2004.06.046. [DOI] [PubMed] [Google Scholar]
- 32.Kovacs ZI, et al. Disrupting the blood–brain barrier by focused ultrasound induces sterile inflammation. Proc. Natl. Acad. Sci. 2017;114:E75–E84. doi: 10.1073/pnas.1614777114. [DOI] [PMC free article] [PubMed] [Google Scholar]
- 33.Park TY, Pahk KJ, Kim H. Method to optimize the placement of a single-element transducer for transcranial focused ultrasound. Comput. Methods Programs Biomed. 2019;179:104982. doi: 10.1016/j.cmpb.2019.104982. [DOI] [PubMed] [Google Scholar]
- 34.White P, Clement G, Hynynen K. Longitudinal and shear mode ultrasound propagation in human skull bone. Ultrasound Med. Biol. 2006;32:1085–1096. doi: 10.1016/j.ultrasmedbio.2006.03.015. [DOI] [PMC free article] [PubMed] [Google Scholar]
- 35.Klein B, Kuschinsky W, Schrock H, Vetterlein F. Interdependency of local capillary density, blood flow, and metabolism in rat brains. Am. J. Physiol. Heart Circul. Physiol. 1986;251:H1333–H1340. doi: 10.1152/ajpheart.1986.251.6.H1333. [DOI] [PubMed] [Google Scholar]
- 36.Cho H, et al. Localized down-regulation of P-glycoprotein by Focused ultrasound and microbubbles induced blood-brain barrier disruption in rat brain. Sci. Rep. 2016;6:31201. doi: 10.1038/srep31201. [DOI] [PMC free article] [PubMed] [Google Scholar]
- 37.O’Reilly MA, Waspe AC, Ganguly M, Hynynen K. Focused-ultrasound disruption of the blood-brain barrier using closely-timed short pulses: influence of sonication parameters and injection rate. Ultrasound Med. Biol. 2011;37:587–594. doi: 10.1016/j.ultrasmedbio.2011.01.008. [DOI] [PMC free article] [PubMed] [Google Scholar]
- 38.Wu S-K, et al. Characterization of different microbubbles in assisting focused ultrasound-induced blood-brain barrier opening. Sci. Rep. 2017;7:46689. doi: 10.1038/srep46689. [DOI] [PMC free article] [PubMed] [Google Scholar]
- 39.Patlak CS, Blasberg RG, Fenstermacher JD. Graphical evaluation of blood-to-brain transfer constants from multiple-time uptake data. J. Cereb. Blood Flow Metab. 1983;3:1–7. doi: 10.1038/jcbfm.1983.1. [DOI] [PubMed] [Google Scholar]
- 40.Sourbron S, Ingrisch M, Siefert A, Reiser M, Herrmann K. Quantification of cerebral blood flow, cerebral blood volume, and blood–brain-barrier leakage with DCE-MRI. Magn. Reson. Med. 2009;62:205–217. doi: 10.1002/mrm.22005. [DOI] [PubMed] [Google Scholar]
- 41.Barboriak, D. et al. in International Society for Magnetic Resonance in Medicine Workshop on MR in Drug Development: From Discovery to Clinical Therapeutic Trials.
- 42.Hernández, D. et al. in 2017 Global Medical Engineering Physics Exchanges/Pan American Health Care Exchanges (GMEPE/PAHCE). 1–5 (IEEE).
- 43.Kyriakou, A. Multi-physics computational modeling of focused ultrasound therapies, ETH Zurich (2015).
- 44.Neufeld E, Kyriacou A, Kainz W, Kuster N. Approach to validate simulation-based distribution predictions combining the gamma-method and uncertainty assessment: application to focused ultrasound. J. Verif. Valid. Uncertain. Quant. 2016;1:1–10. [Google Scholar]
- 45.Montanaro, H. et al. in 18th International Symposium for Therapeutic Ultrasound (ISTU 2018).
Associated Data
This section collects any data citations, data availability statements, or supplementary materials included in this article.