Abstract
Dopamine (DA) plays a critical role in the brain, and the ability to directly measure dopaminergic activity is essential for understanding its physiological functions. We therefore developed red fluorescent GPCR-activation–based DA (GRABDA) sensors and optimized versions of green fluorescent GRABDA sensors. In response to extracellular DA, both the red and green GRABDA sensors exhibit a large increase in fluorescence, with subcellular resolution, subsecond kinetics, and nanomolar to submicromolar affinity. Moreover, the GRABDA sensors resolve evoked DA release in mouse brain slices, detect evoked compartmental DA release from a single neuron in live flies, and report optogenetically elicited nigrostriatal DA release as well as mesoaccumbens dopaminergic activity during sexual behavior in freely behaving mice. Co-expressing red GRABDA with either green GRABDA or the calcium indicator GCaMP6s allows simultaneously tracking neuronal activity and dopaminergic signaling in distinct circuits in vivo.
Dopamine (DA) is an essential monoamine neuromodulator produced primarily in the midbrain and released throughout the central nervous system. A multitude of brain functions are regulated by DA, including motor control, motivation, learning and memory, and emotional control1,2. Consistent with these key physiological roles, altered DA signaling has been implicated in a variety of brain disorders, including Parkinson’s disease, addiction, schizophrenia, attention deficit hyperactivity disorder, and posttraumatic stress disorder3. Thus, tools that can sense changes in DA concentration with high spatiotemporal resolution, high specificity, and high sensitivity will facilitate studying the diverse functions that the dopaminergic system plays under both physiological and pathological conditions.
Techniques and tools for measuring DA dynamics such as microdialysis, electrochemical probes, reporter cells, gene expression–based assays and synthetic carbon nano-material–based probes show limitations in spatiotemporal resolution and/or molecular specificity4–10. Recently, we and others independently developed two series of genetically encoded, G-protein–coupled receptor (GPCR)–based DA sensors called GRABDA and dLight, respectively11, 12. Taking advantage of naturally occurring DA receptors, these sensors convert a ligand–stabilized conformational change in the DA receptor into an optical response via a conformation-sensitive fluorescent protein inserted in the receptor’s third intracellular loop. Our first-generation DA receptor–based sensors called GRABDA1m and GRABDA1h were used to detect cell type–specific DA dynamics in several organisms, including Drosophila, zebrafish, mice, and zebra finches11,13–15. Here, we employed semi-rational engineering to modify the green fluorescent protein. The resulting second-generation sensors called GRABDA2m and GRABDA2h (abbreviated DA2m and DA2h, respectively) have a 2–3-fold higher dynamic range and improved in vivo performance in comparison to the corresponding first-generation sensors.
Red fluorescent sensors have distinct and well-separated spectra from those of green fluorescent protein (GFP)–based sensors and blue light–excitable channelrhodopsin 2 (ChR2), thus enabling the orthogonal readout of distinct neurochemical events, or simultaneous monitoring of neurotransmitter release and blue light–mediated control of neuronal activity. Moreover, red fluorescent sensors require excitation with a relatively longer wavelength, providing additional advantages over GFP, including reduced phototoxicity, reduced background, and deeper tissue penetration16,17. Starting with the dopamine D2 receptor (D2R) and the conformation-sensitive red fluorescent protein cpmApple18, we generated red fluorescent DA sensors called rGRABDA1m and rGRABDA1h (abbreviated rDA1m and rDA1h, respectively), with a dynamic range similar to the corresponding first-generation green DA sensors.
Results
Development and in vitro characterization of DA sensors.
To develop red fluorescent DA sensors, we inserted cpmApple into the third intracellular loop of D2R and systematically optimized the insertion site, the linker sequences, and the cpmApple module18–21 (Extended Data Fig. 1, Extended Data Fig. 2), using both brightness and DA–induced change in fluorescence (ΔF/F0) as our selection criteria. Screening over 2000 sensor variants revealed the sensor with the highest fluorescence response; we called this sensor rDA0.5. Next, we used a rational strategy to introduce an iterative series of mutations in the D2R module of rDA0.5, generating versions with different apparent affinities to DA. The chosen sites for mutagenesis were implicated in affinity tuning22,23 or located on the linkers or putative interface between the receptor backbone and cpmApple, which may be essential for the structural coupling18. We generated the medium-affinity sensor rDA1m by introducing the K4726.29L mutation in rDA0.5, and the high-affinity sensor rDA1h by introducing the T2055.54M mutation in rDA1m. Finally, we generated a DA–insensitive version (rDA-mut) by introducing the C1183.36A and S1935.42N mutations in rDA1h (Extended Data Fig. 1a,b, Fig. 1, Extended Data Fig. 2a, Extended Data Fig. 3). All three versions localized well on the cell membrane when expressed in HEK293T cells (Fig. 1a). rDA1m and rDA1h had a half-maximal effective concentration (EC50) of 95 nM and 4 nM, respectively (Fig. 1b). Moreover, the application of 100 μM DA elicited a 150% and 100% increase in fluorescence of rDA1m and rDA1h, respectively, which was blocked by the D2R antagonist haloperidol (Halo) (Fig. 1a,b). As expected, DA had no effect in cells expressing rDA-mut, even at the highest concentration tested (Fig. 1a,b).
Fig. 1 |. Development of red fluorescent DA sensors and second-generation green fluorescent DA sensors.
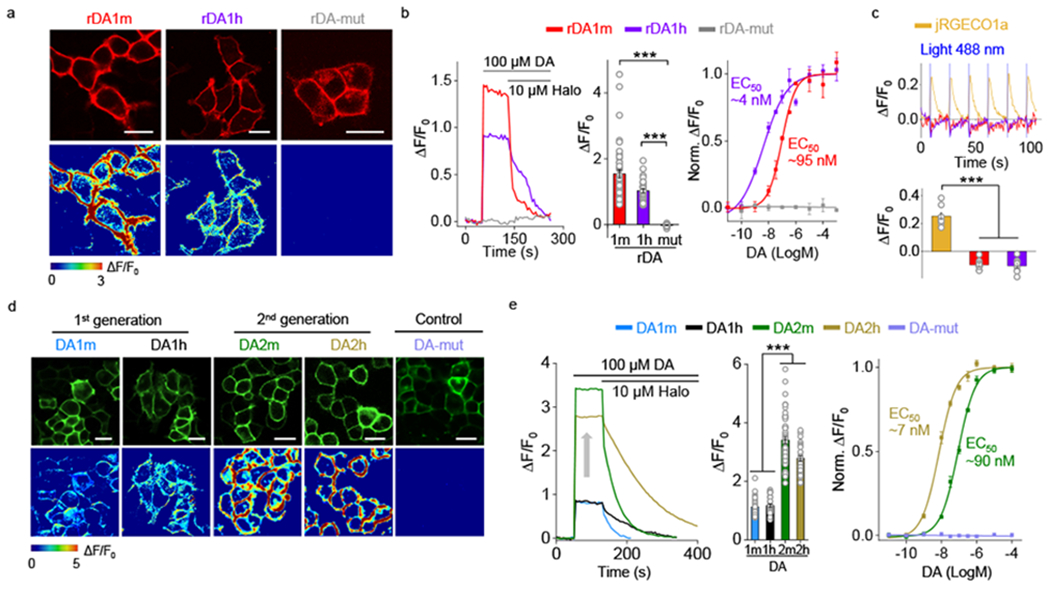
a, Representative images of sensor expression (top) and response to 100 μM DA (bottom) in HEK293T cells expressing the indicated sensor variants. Similar results were observed for more than 10 cells. Scale bars, 20 μm.
b, Representative traces (left), group summary of peak ΔF/F0 in response 100 μM DA (center), and normalized dose-response curves (right) in response to DA. Center, n=46, 32, 17 cells for rDA1m, rDA1h, rDA-mut. Right, n=3 wells with 200–400 cells/well. Two-tailed Student’s t-test was performed. p=3.52×10⁻¹⁰ (***) between rDA1m and rDA-mut; p=4.79×10⁻¹⁸ (***) between rDA1h and rDA-mut.
c, Representative traces (top) and group summary of ΔF/F0 in response to blue light in cells expressing jRGECO1a, rDA1m, or rDA1h. Bottom, n=8, 9, 8 cells for jRGECO1a, rDA1m, rDA1h. Two-tailed Student’s t-test was performed. p=1.23×10⁻⁹ (***) between jRGECO1a and rDA1m; p=1.56×10⁻⁸ (***) between jRGECO1a and rDA1h.
d, Representative images of sensor expression (top) and response to 100 μM DA (bottom) in HEK293T cells expressing the indicated sensor variants. Similar results were observed for more than 20 cells. Scale bars, 20 μm.
e, Representative traces (left), group summary of peak ΔF/F0 in response 100 μM DA (center), and normalized dose-response curves in response to DA (right). Center, n=66, 36, 52, 33 cells for DA1m, DA1h, DA2m, DA2h. Right, n=3 wells with 200–500 cells/well. Two-tailed Student’s t-test was performed. p=2.15×10−41 (***) between DA1m and DA2m; p=8.34×10−39 (***) between DA1m and DA2h; p=9.90×10⁻²⁶ (***) between DA1h and DA2m; p=4.66×10⁻²⁴ (***) between DA1h and DA2h.
Data are presented as the mean ± s.e.m. in b (center and right), c (bottom), e (center and right).
Next, we asked whether the red DA sensors undergo photoactivation when expressed in HEK293T cells. Previous studies showed that cpmApple–based sensors can undergo photoactivation when illuminated with blue light24,25, preventing the combined use of these sensors with ChR2. We found that although the cpmApple–based red fluorescent calcium indicator jRGECO1a25 had a ~25% increase in fluorescence upon blue light illumination (Fig. 1c), blue light elicited a small decrease (~10%) in the fluorescence of rDA1m and rDA1h, which is opposite to the ON response and consequently less likely to interfere with DA detection. Moreover, we found that photostability of the red DA sensors was similar to or better than the photostability of several commonly used red fluorescent proteins when expressed in HEK293T cells (Extended Data Fig. 3j).
In parallel, we optimized our first-generation green fluorescent DA sensors by performing random mutagenesis at 32 sites in the cpEGFP module (Extended Data Fig. 1c, Extended Data Fig. 2b). We chose these sites for the potential capability of improving the folding ability, brightness or structural coupling26–29. Screening ~1000 variants yielded DA2h, a high-affinity green fluorescent DA sensor. We then used this sensor to generate the medium-affinity DA2m and DA–insensitive DA-mut versions (Extended Data Fig. 1d, Extended Data Fig. 2b, Extended Data Fig. 3g). Compared to their corresponding first-generation DA1m and DA1h sensors, the second-generation green fluorescent DA sensors expressed in HEK293T cells had a 2–3 fold higher fluorescence increase (ΔF/F0 ~340% for DA2m and ~280% for DA2h) to 100 μM DA while maintaining their apparent affinity to DA, with EC50 values of 90 nM and 7 nM for DA2m and DA2h, respectively (Fig. 1d,e). Finally, the DA–insensitive DA-mut sensor localized well on the cell membrane of HEK293T cells but did not respond to DA (Fig. 1d,e).
We further characterized the specificity, kinetics, and downstream coupling of our DA sensors in HEK293T cells. With respect to specificity, the DA–induced signals of both the red and green DA sensors were blocked by the D2R–specific antagonists Halo and eticlopride, but not the D1R antagonist SCH-23390. The four DA sensors exhibited negligible responses to a variety of tested neurotransmitters and neuromodulators (serotonin, histamine, glutamate, GABA, adenosine, acetylcholine, octopamine, glycine, L-DOPA) (Fig. 2a, Extended Data Fig. 4). Although norepinephrine (NE) is structurally similar to DA, both the red and green DA sensors were 10–20 fold more selective for DA over NE (Fig. 2a, Extended Data Fig. 4), suggesting good selectivity for DA of our sensors at physiologically relevant concentrations.
Fig. 2 |. Characterization of GRABDA sensors in HEK293T cells and cultured rat cortical neurons.
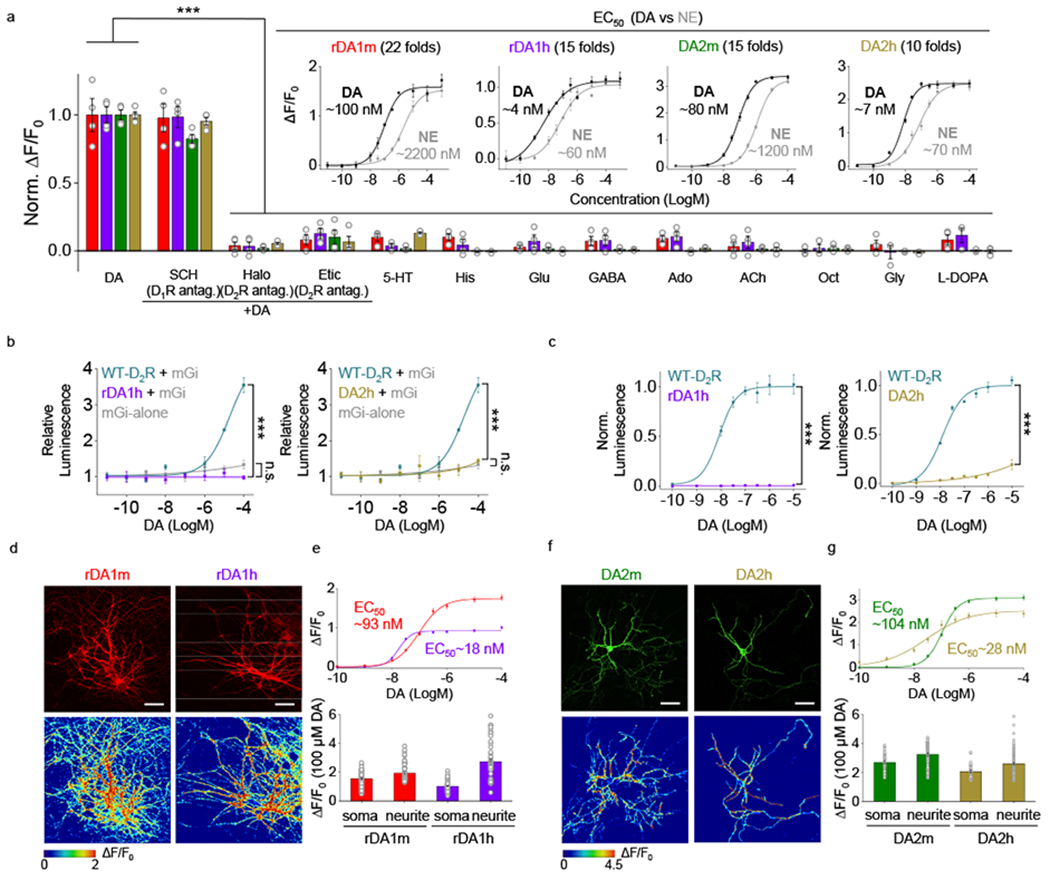
a, Normalized ΔF/F0 in sensor-expressing HEK293T cells following the application of DA alone, DA+SCH-23390 (SCH), DA+haloperidol (Halo), DA+eticlopride (Etic), serotonin (5-HT), histamine (His), glutamate (Glu), gamma-aminobutyric acid (GABA), adenosine (Ado), acetylcholine (ACh), octopamine (Oct), glycine (Gly), or L-DOPA (all applied at 1 μM). n=3 wells for rDA1h in response to 5-HT, Oct, Gly and L-DOPA. n=4 wells for the others. Each well contains 200-1200 cells. The insets show dose-response curves for DA and norepinephrine (NE); n=3 wells with 200–800 cells/well each. Two-tailed Student’s t-test was performed. rDA1m, p=0.8816 (n.s.), 0.0001 (***), 0.0002 (***), 0.0002 (***), 0.0002 (***), 8.94×10⁻⁵ (***), 0.0001 (***), 0.0001 (***), 0.0001 (***), 7.65×10⁻⁵ (***), 0.0001 (***), 0.0002 (***) between DA and DA+SCH, DA+Halo, DA+Etic, 5-HT, His, Glu, GABA, Ado, ACh, Oct, Gly, L-DOPA, respectively. rDA1h, p=0.8648 (n.s.), 4.12×10⁻⁶ (***), 7.94×10⁻⁶ (***), 2.34×10⁻⁵ (***), 5.13×10⁻⁶ (***), 7.89×10⁻⁶ (***), 5.77×10⁻⁶ (***), 6.37×10⁻⁶ (***), 7.45×10⁻⁶ (***), 2.63×10⁻⁵ (***), 3.86×10⁻⁵ (***), 8.60×10⁻⁵ (***) between DA and DA+SCH, DA+Halo, DA+Etic, 5-HT, His, Glu, GABA, Ado, ACh, Oct, Gly, L-DOPA, respectively. DA2m, p=0.0105 (*), 1.99×10⁻⁷ (***), 7.18×10⁻⁶ (***), 1.92×10⁻⁷ (***), 1.54×10⁻⁷ (***), 2.00×10⁻⁷ (***), 1.77×10⁻⁷ (***), 1.55×10⁻⁷ (***), 1.80×10⁻⁷ (***), 2.46×10⁻⁷ (***), 1.50×10⁻⁷ (***), 1.62×10⁻⁷ (***) between DA and DA+SCH, DA+Halo, DA+Etic, 5-HT, His, Glu, GABA, Ado, ACh, Oct, Gly, L-DOPA, respectively. DA2h, p=0.2613 (n.s.), 2.90×10⁻⁸ (***), 1.15×10⁻⁶ (***), 4.20×10⁻⁸ (***), 1.50×10⁻⁸ (***), 1.83×10⁻⁸ (***), 1.61×10⁻⁸ (***), 1.80×10⁻⁸ (***), 3.51×10⁻⁸ (***), 1.87×10⁻⁸ (***), 1.46×10⁻⁸ (***), 2.83×10⁻⁸ (***) between DA and DA+SCH, DA+Halo, DA+Etic, 5-HT, His, Glu, GABA, Ado, ACh, Oct, Gly, L-DOPA, respectively.
b, Luciferase complementation assay for assessing Gi coupling. n=3 wells each. The luminescence signals are normalized against the luminescence signals measured in the control buffer-treated cells. Cells expressing mGi alone serve as the control. Two-tailed Student’s t-test was performed. p=9.87×10⁻⁵ (***) between rDA1h and WT-D2R; p=0.1124 (n.s.) between rDA1h and mGi-alone; p=0.0001 (***) between DA2h and WT-D2R; p=0.2836 (n.s.) between DA2h and mGi-alone.
c, TANGO assay for measuring β-arrestin coupling. n=3 wells each. The maximum luminescence signals of WT-D2R are normalized to 1. Two-tailed Student’s t-test was performed. p=0.0004 (***) between rDA1h and WT-D2R; p=0.0001 (***) between DA2h and WT-D2R.
d, Representative images of sensor expression (top) and response to 100 μM DA (bottom) in neurons expressing the indicated sensors. Similar results were observed for more than 30 neurons. Scale bars, 10 μm.
e, Dose-response curves (top) and group summary (bottom) of the responses measured in the soma and neurites of sensor-expressing neurons. Top, n=34, 14 neurons for rDA1m, rDA1h. Bottom, n=59, 68 ROIs from 59 neurons for rDA1m (soma), rDA1m (neurite); n=58, 58 ROIs from 58 neurons for rDA1h (soma), rDA1h (neurite).
f, Representative images of sensor expression (top) and response to 100 μM DA (bottom) in neurons expressing the indicated sensors. Similar results were observed for more than 20 neurons. Scale bars, 10 μm.
g, Dose-response curves (top) and group summary (bottom) of the responses measured in the soma and neurites of sensor-expressing neurons. Top, n=32, 21 neurons for DA2m and DA2h. Bottom, n=54, 85 ROIs from 54 neurons for DA2m (soma), DA2m (neurite); n=30, 145 ROIs from 30 neurons for DA2h (soma), DA2h (neurite).
Data are presented as the mean ± s.e.m. in a, b, c, e, g.
We next characterized the kinetics of the DA sensors using rapid line-scanning in response to a local puff of DA (to measure τon) followed by Halo (to measure τoff) to sensor-expressing HEK293T cells. τon was <100 ms for all four DA sensors while the high-affinity versions had relatively slower off kinetics compared to their corresponding medium-affinity counterparts (Extended Data Fig. 3a–f).
To examine whether our DA sensors couple to signaling pathways downstream of the DA receptors the sensors are based on, we used the luciferase complementation assay30 and TANGO assay31 to measure activation of the Gi and β-arrestin pathways, respectively (Fig. 2b, c). When expressed in HEK293T cells, both the rDA1h and DA2h sensors exhibited minimal downstream coupling in both assays (Fig. 2b, c). In contrast, wild-type D2R as a control showed robust coupling (Fig. 2b,c). Furthermore, GTPγS treatment did not alter the EC50 to DA for rDA1h and DA2h sensors (Extended Data Fig. 5a,b). When imaging for 2 hours or 1 hour in sensor-expressing cultured rat cortical neurons or transgenic flies, respectively, we did not observe a substantial fluorescent decrease, indicating minimal desensitization in both cases (Extended Data Fig. 5c–m). Taken together, these results indicate that our DA sensors show minimal coupling to downstream signaling pathways.
In cultured neurons, both the red and green DA sensors readily localized to the cell membrane and responded well to DA (Fig. 2d–g).
Lastly, we compared the properties of the second-generation green fluorescent DA2m sensor with D1R–based dLight1.1, dLight1.2, and dLight1.3b sensors (Extended Data Fig. 6a–m). When expressed in cultured cells, DA2m had a higher apparent affinity to DA, higher basal and maximal brightness, and higher ΔF/F0 than dLight series, except that dLight1.3b has a larger maximal ΔF/F0. However, DA2m has a higher ΔF/F0 at <1 μM DA concentration and exhibits overall higher signal-to-noise ratio (SNR). On the other hand, the D1R–based dLight series have faster off kinetics12.
Imaging of DA release in acute mouse brain slices.
Next, we examined whether our DA sensors can be used to measure the release of endogenous DA in acute brain slices (Fig. 3). We injected AAVs for expressing rDA1m, rDA1h, or DA2m into the nucleus accumbens (NAc), which receives strong innervation from midbrain dopaminergic neurons (Fig. 3a,b). Two weeks after injection, we prepared acute brain slices and used 2-photon imaging combined with electrical stimulation to measure stimulus–evoked DA release (Fig. 3a). Electrical stimuli delivered at 20 Hz induced fluorescence responses in the NAc, which scaled with the number of pulses delivered and which were blocked by Halo (Fig. 3c,e). We also measured the sensors’ kinetics while applying 10 pulses at 100 Hz. The τon and τoff values for the three sensors were in the range of 0.08–0.15 s and 5.2–11.8 s, respectively (Fig. 3d).
Fig. 3 |. GRABDA sensors can be used to measure DA release in acute mouse brain slices.
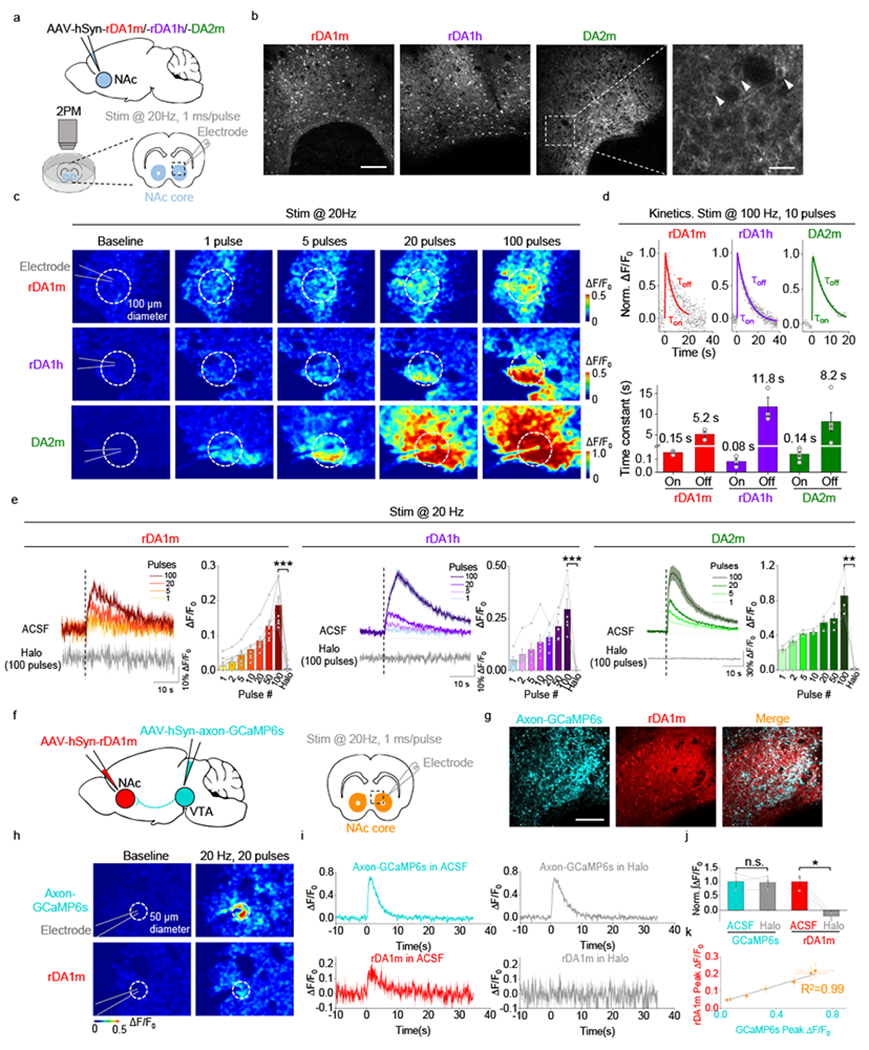
a, Schematic illustration depicting the experimental design for panels b-e.
b, Representative fluorescence images showing the expression of sensors in the NAc. The arrowheads indicate the somas of individual neurons. Similar results were observed for 3-4 mice. Scale bar, 100 μm (left) and 20 µm (right).
c, Responses to electrical stimulation measured in sensor-expressing brain slices. The dashed circles indicate the ROIs used to analyze the signals.
d, Representative traces showing the normalized ΔF/F0 (top) and group summary of τon and τoff (bottom) in response to 10 electrical stimuli applied at 100 Hz. The data were processed with 2×binning. Each trace was fitted with a single-exponential function to determine τon and τoff. n=3 slices from 2 mice for rDA1m, n=3 slices from 2 mice for rDA1h, n=5 slices from 3 mice for DA2m.
e, Representative traces and group summary of the ΔF/F0 in response to electrical stimulation. n=7 slices from 4 mice for rDA1m, n=6 slices from 4 mice for rDA1h, n=3 slices from 2 mice for DA2m. Two-tailed Student’s t-test was performed. p=2.97×10⁻⁵ (***), 0.0002 (***), 0.0061 (**) for rDA1m, rDA1h, DA2m.
f, Schematic illustration depicting the experimental design for panels g-j.
g, Representative fluorescence images showing the expression of GCaMP6s and rDA1m in the NAc. Similar results were observed for 3 mice. Scale bar, 100 μm.
h, Response images of axon-GCaMP6s and rDA1m following electrical stimulation. The dashed circles indicate the ROIs used to analyze the signals.
i-j, Representative traces (i) and group summary (j) of the ΔF/F0 in response to electrical stimulation. n=3 slices from 3 mice. Two-tailed Student’s t-test was performed. p=0.8361 (n.s.), 0.0244 (*) for GCaMP6s, rDA1m.
k, The peak ΔF/F0 of rDA1m plotted against the peak ΔF/F0 of axon-GCaMP6s in response to various numbers of pulses applied at 20 Hz. The data were fitted to a linear function. n=8 slices from 3 mice.
Average traces shaded with ± s.e.m. from one slice are shown for representation in e, i.
Data are presented as the mean ± s.e.m. in d (bottom), e, j, k.
To test whether the red fluorescent DA sensor is spectrally compatible with a green fluorescent calcium sensor, we co-expressed axon–targeted GCaMP6s32 in the ventral tegmental area (VTA) and rDA1m in the NAc, then simultaneously imaged calcium and DA in the NAc during 20 Hz electrical stimulation (Fig. 3f,g). The electrical stimulation evoked robust fluorescence increases of both GCaMP6s and rDA1m and the magnitudes of increases were highly correlated (Fig. 3k). Application of the D2R antagonist Halo blocked the rDA1m response but had no effect on the GCaMP6s response (Fig. 3h–j). Taken together, these data indicate that the rDA1m, rDA1h, and DA2m sensors can detect dopaminergic activity in brain slices. Moreover, our results confirm that the red fluorescent DA sensors are spectrally compatible with green fluorescent probes, allowing dual-color imaging.
In vivo imaging of DA in Drosophila.
In Drosophila, dopaminergic activity in the mushroom body (MB) is both necessary and sufficient for associative learning of an odor and an aversive experience, e.g. body shock33–36. We generated transgenic Drosophila expressing rDA1m in Kenyon cells (KCs) in the MB and measured the fluorescence level of the rDA1m sensor using in vivo 2-photon imaging while presenting physiologically relevant stimuli (Fig. 4a,b). When we delivered either the odorant or body shock, we observed a time–locked fluorescence increase in the MB medial lobe; this increase was blocked by pretreating the animals with Halo (Fig. 4c,d, Supplementary Video 1) and was not observed in flies expressing the DA–insensitive rDA-mut sensor. The endogenous signal did not saturate the rDA1m sensor’s response, as application of 100 μM DA caused a substantially larger, sustained increase in fluorescence (Fig. 4e).
Fig. 4 |. In vivo 2-photon imaging of DA dynamics in Drosophila using GRABDA sensors.
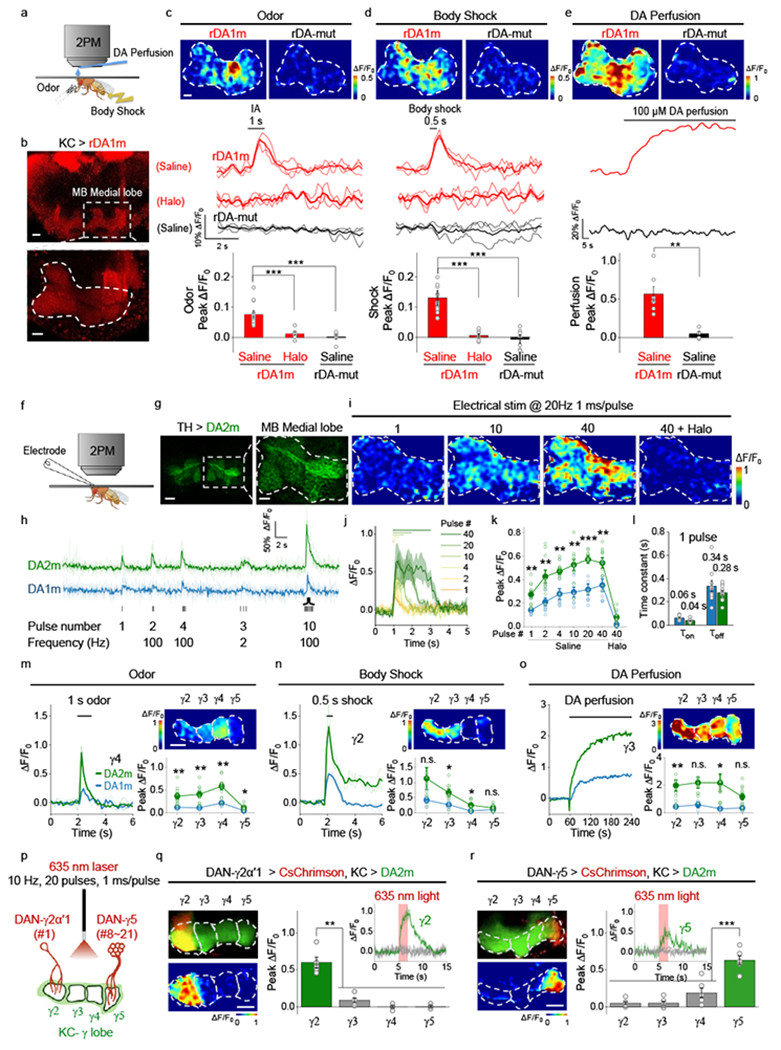
a, Schematic illustration depicting the experimental setup for imaging fluorescence changes in response to various stimuli.
b, Representative fluorescence images of rDA1m expressed in Kenyon cells (KCs), with an expanded view of the olfactory mushroom body (MB) medial lobe. Similar results were observed for 15 flies. Scale bars, 20 µm (top) and 10 µm (bottom).
c-e, Representative images (top; the dashed area indicates the MB medial lobe), traces (center), and group summary (bottom) of ΔF/F0 in response to odorant (c), body shock (d), and DA perfusion (e). Scale bar, 10 µm. c, n=15, 7, 6 flies for rDA1m (saline), rDA1m (Halo), rDA-mut. d, n=15, 7, 8 flies for rDA1m (saline), rDA1m (Halo), rDA-mut (saline). e, n=7, 5 flies for rDA1m (saline), rDA-mut (saline). Two-tailed Student’s t-test was performed. c, p=0.0002 (***) between rDA1m (saline) and rDA1m (Halo); p=6.70×10⁻⁶ (***) between rDA1m (saline) and rDA-mut (Saline). d, p=5.48×10⁻⁵ (***) between rDA1m (saline) and rDA1m (Halo); p=1.71×10⁻⁶ (***) between rDA1m (saline) and rDA-mut (Saline). e, p=0.0016 (**) between rDA1m (saline) and rDA-mut (Saline).
f, Schematic illustration depicting the experimental setup for imaging electrical stimulation–evoked DA release.
g, Representative fluorescence images of DA2m expressed in dopaminergic neurons (DANs), with an expanded view of the MB medial lobe. Similar results were observed for 10 flies. Scale bars, 20 μm (left) and 10 μm (right).
h, Representative traces of DA2m and DA1m fluorescence; where indicated, electrical stimuli were applied.
i,j, Representative images (i) and traces (j) of DA2m ΔF/F0 in response to electrical stimuli. Similar results were observed for 10 flies.
k, Group summary of DA2m and DA1m ΔF/F0 in response to electrical stimuli. n=9, 5, 10, 10 flies for DA1m (saline), DA1m (Halo), DA2m (saline), DA2m (Halo). Two-tailed Student’s t-test was performed. p=0.0023 (**), 0.0047 (**), 0.0025 (**), 0.0014 (**), 0.0002 (***), 0.0091 (**) for 1, 2, 4, 10, 20, 40 pulse(s), respectively.
l, Kinetics (τon and τoff) of DA2m and DA1m in response to a single electrical stimulus. n=9, 10 flies for DA1m, DA2m.
m-o, Representative traces (left), fluorescence images (top right), and group summary (bottom right) of the indicated MB lobe compartments in response to odorant (m), body shock (n), and 1mM DA perfusion (o). m, n= 4, 9 flies for DA1m, DA2m. n, n=6, 8 flies for DA1m, DA2m. o, n=3, 11 flies for DA1m, DA2m. Two-tailed Student’s t-test was performed. m, p=0.0070 (**), 0.0024 (**), 0.0091 (**), 0.0171 (*) for γ2, γ3, γ4, γ5. n, p=0.0910 (n.s.), 0.0137 (*), 0.0207 (*), 0.3808 (n.s.) for γ2, γ3, γ4, γ5. o, p= 0.0033 (**), 0.0701 (n.s.), 0.0150 (*), 0.0990 (n.s.) for γ2, γ3, γ4, γ5.
p, Schematic illustration depicting the strategy for imaging optogenetically induced DA release. DA2m is expressed in the KCs, and CsChrimson is expressed in the DANs in either the γ2 or γ5 MB compartment (with the number of innervating cells indicated).
q,r, Representative fluorescence images (top left), response images (bottom left), representative traces (top right), and group summary (bottom right) of DA2m fluorescence in the γ2 (q) and γ5 (r) MB compartments in response to optogenetic stimulation. Scale bars, 20 μm. q, n=5 flies. r, n=6 flies. Two-tailed Student’s t-test was performed. q, p=0.0035 (**), 0.0012 (**), 0.0013 (**) between γ2 and γ3, γ4, γ5. r, p=0.0002 (***), 0.0003 (***), 0.0001 (***) between γ5 and γ2, γ3, γ4.
The group data for DA1m shown in panels k, m, n, and o were reproduced from Sun et al.11 with permission. Average traces (bold), overlaid with single-trial traces (light) from one fly are shown for representation in c, d, h, m, n. Average traces shaded with ± s.e.m. from one fly are shown for representation in j, q, r. Data are presented as the mean ± s.e.m. in c, d, e, k, l, m, n, o, q, r.
We then compared the in vivo performance between the first-generation and second-generation green fluorescent DA sensors in flies. Electrical stimulation of the MB medial lobe elicited a robust fluorescence increase in nearby DA sensor-expressing dopaminergic neurons (DANs) with a higher response observed in DA2m-expressing flies compared to DA1m-expressing flies (Fig. 4f,g). The temporal dynamics of the DA2m and DA1m responses (τon and τoff) were similar to each other and both responses were blocked by Halo (Fig. 4h–l). The spatial patterns of the responses in the MB during odorant or body shock delivery were also similar between DA2m- and DA1m-expressing flies11 with higher responses consistently observed in DA2m-expressing flies (Fig. 4m–o). In a separate experiment, we compared the in vivo performance of DA2m with dLight1.3b, which has the highest dynamic range among the dLight series of sensors, and found that DA2m produced a 3-fold larger response than dLight1.3b did (Extended Data Fig. 6n–r).
Previous studies have found that the Drosophila MB is innervated by 15 DAN subgroups, with each lobe containing axons from one to approximately two dozens of DANs37,38,39. We asked whether our DA2m sensor could detect DA release in individual MB compartments, even when the source of DA is a single neuron. We co-expressed the red light–activated channelrhodopsin CsChrimson40 in DANs and DA2m in KCs. We then optically activated the only DAN neuron innervating the γ2α’1 compartment or the 8–21 neurons innervating the γ5 compartment while measuring DA2m fluorescence (Fig. 4p). The change in DA2m fluorescence was both time–locked to the CsChrimson activation and spatially confined to the respective compartments, suggesting functional independence among MB compartments (Fig. 4q,r).
To examine any potential coupling of the DA2m sensor and the Gi pathway in vivo, we measured cAMP levels, as a proxy for Gi signaling, using the red fluorescent cAMP sensor Pink-Flamindo41. We found that the presence of the DA2m sensor had no significant (p=0.7332, two-tailed Student’s t-test) effect on cAMP production during body shock (Extended Data Fig. 7a–f). We further assessed odor–evoked calcium signaling in KCs using GCaMP542, and found that the concurrently expressed rDA1m sensor had no significant effect on the Ca2+ response (Extended Data Fig. 7g–l, p=0.607 in k, p=0.601, 0.735 for τon, τoff in l, two-tailed Student’s t-test). Thus, the GRABDA sensors have minimal effects on endogenous signaling pathways in vivo.
Detection of DA release in freely behaving mice.
To test the performance of our sensors in vivo in mice, we measured DA dynamics in the dorsal striatum, the main target of dopaminergic projections from the substantia nigra pars compacta (SNc), by expressing the optogenetic tool C1V143 in the SNc and various DA sensors in the dorsal striatum (Fig. 5). As an internal control for the red and green fluorescent sensors, we also co-expressed EGFP or tdTomato, respectively, in the dorsal striatum (Fig. 5a,b). C1V1–mediated optogenetic activation of DANs in the SNc elicited a robust transient increase in DA sensor fluorescence (Fig. 5d–g), but not in the DA–insensitive control rDA-mut fluorescence (Fig. 5c,h). The evoked response was prolonged by the DA transporter blocker methylphenidate and blocked by the D2R antagonist eticlopride (Fig. 5d–g,i–l), but was unaffected by the NE transporter blocker desipramine and the α2-adrenergic receptor antagonist yohimbine (Extended Data Fig. 8). Thus, our DA sensors can detect optogenetically induced DA release in freely moving mice.
Fig. 5 |. GRABDA sensors can detect optogenetically induced nigrostriatal DA release in freely moving mice.
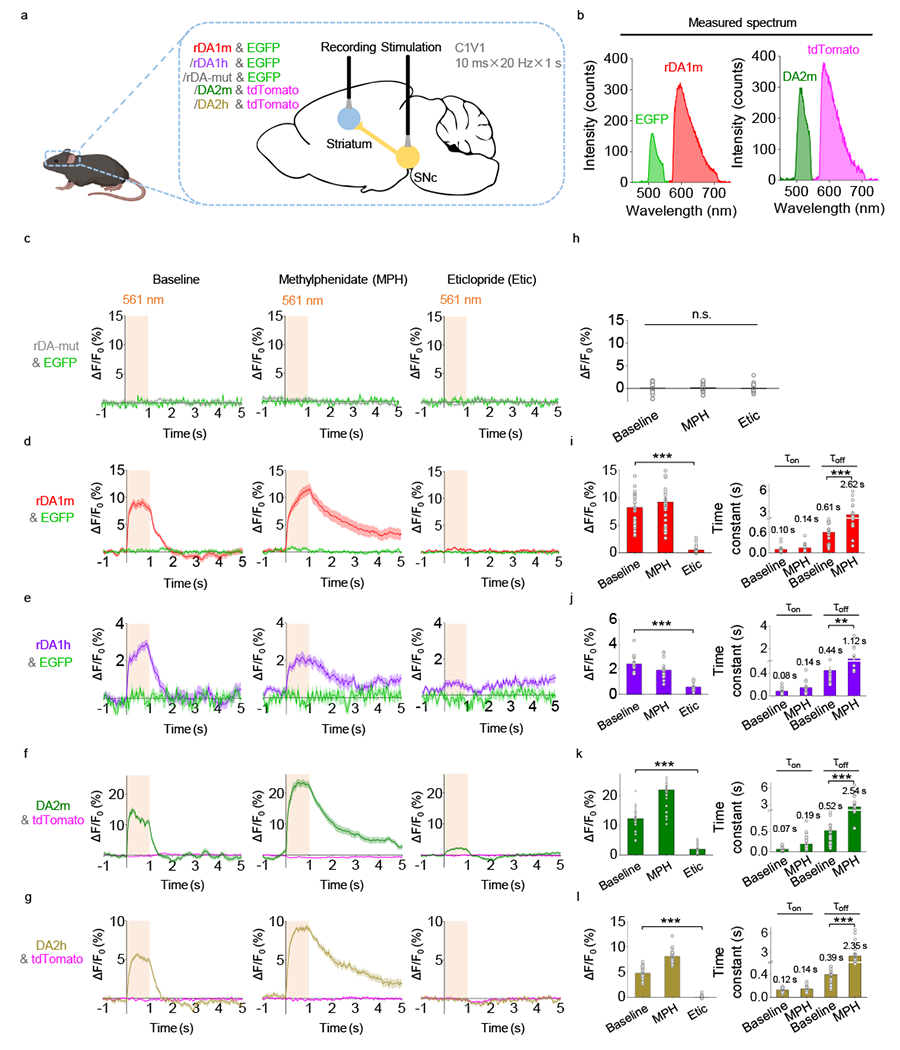
a, Schematic illustration depicting the experimental setup.
b, Measured emission spectra in vivo using fiber photometry.
c-g, Average ΔF/F0 traces of the indicated sensors and fluorescent proteins during optogenetic stimulation under control conditions (left) or in the presence of methylphenidate (MPH) or eticlopride (Etic).
h-l, Group summary of ΔF/F0 and time constants (where applicable) for the corresponding sensors in panels c-g, respectively. n=30 trials from 6 hemispheres of 3 mice for rDA-mut. n=30 trials from 6 hemispheres of 6 mice for rDA1m. n=15 trials from 3 hemispheres of 3 mice for rDA1h. n=30 trials from 6 hemispheres of 3 mice for DA2m. n=25 trials from 5 hemispheres of 4 mice for DA2h. Two-tailed Student’s t-test was performed. h, p=0.6066 (n.s.) between baseline and MPH; p=0.7130 (n.s.) between baseline and Etic; p=0.3216 (n.s.) between MPH and Etic. i, left, p=1.27×10⁻¹⁶ (***); right, p=2.98×10⁻¹⁵ (***). j, left, p=7.07×10⁻¹⁰ (***); right, p=0.0034 (**). k, left, p=7.86×10⁻²¹ (***); right, p=1.07×10⁻⁶ (***). l, left, p=1.86×10⁻²⁵ (***); right, p=2.06×10⁻⁷ (***).
Average traces shaded with ± s.e.m. are shown in c-g. Data are presented as the mean ± s.e.m. in h-l.
To show GRABDA performance relative to downstream events, we expressed GRABDA2m in the dorsal striatum of Drd1-Cre mice that also expressed the red calcium indicator jRGECO1a in direct-pathway striatal neurons (Extended Data Fig. 9). During simultaneous GRABDA and jRGECO1a recordings in freely behaving mice, we observed inversed correlation of the temporal profiles between the DA signal and the direct-pathway neural activity.
To compare DA2h and DA1h sensor performance during natural behaviors, we expressed DA1h and DA2h in opposite sides of the NAc core, and performed bilateral fiber photometry recording during male mating11 (Fig. 6a,b). We found that the DA1h and DA2h signals were closely correlated in time while the DA2h sensor had a substantially higher fluorescence change (ΔF/F0) than DA1h during various stages of mating (Fig. 6c–f). This difference is not due to endogenous difference of DA release between the left and right NAc as simultaneous bilateral recording of DA signals using DA2h only reveals no laterality in the response patterns during male sexual behaviors (Extended Data Fig. 10a–c).
Fig. 6 |. GRABDA sensors can be used to measure dopaminergic activity in the mouse NAc during sexual behavior.
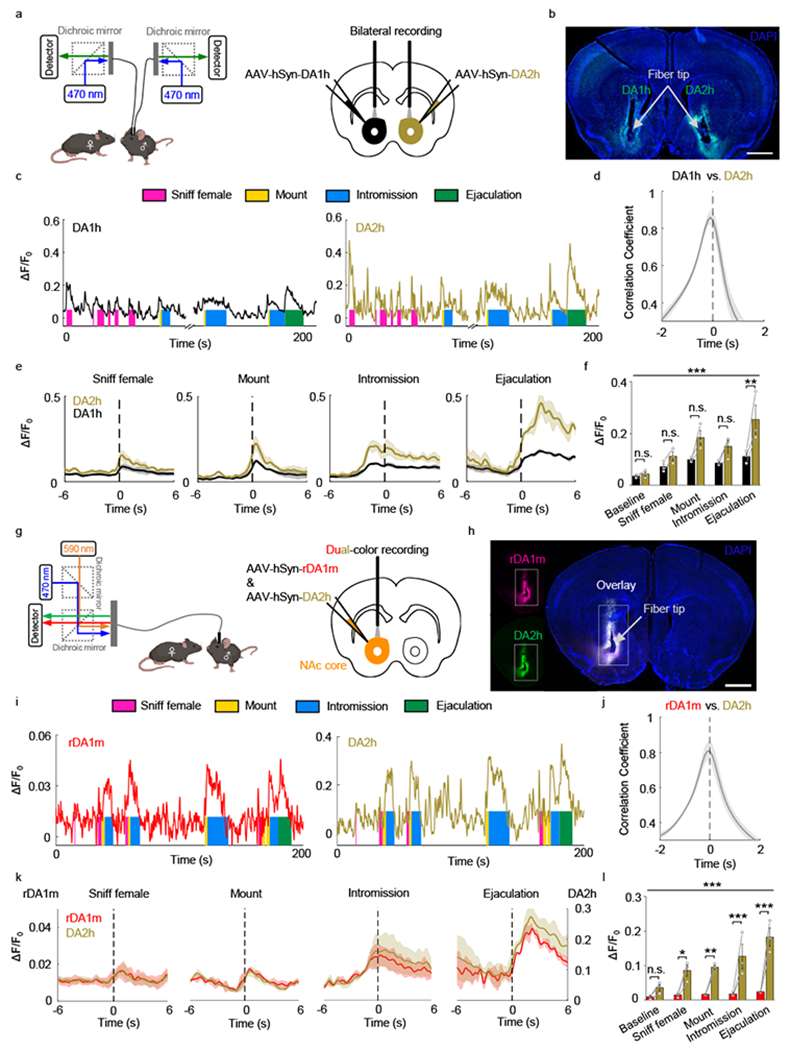
a, Schematic illustration depicting the experimental strategy for panels b-f.
b, Representative image showing the expression of DA1h and DA2h in opposite hemispheres. Similar results were observed for 3 mice. Scale bar, 1 mm.
c, Representative traces of DA1h and DA2h ΔF/F0 measured during the indicated stages of mating. Similar results were observed for 3 mice.
d, The time shift correlation coefficient between the DA1h and DA2h signals. n=3 mice.
e, Average post-stimulus histograms aligned to the onset of the indicated mating events. n=3 mice.
f, Group summary of ΔF/F0 measured for DA1h and DA2h during the indicated mating events. n=3 mice. F4,16=15.43, p=2.0×10⁻⁵ (***) for row factor and F1,4=10.72, p=0.0307 (*) for column factor by two-way ANOVA. Bonferroni’s multiple comparisons test were performed between groups, p>0.99 (n.s.), p>0.99 (n.s.), p=0.0732 (n.s.), p=0.2993 (n.s.), p=0.0013 (**).
g, Schematic illustration depicting the experimental strategy for panels h-l.
h, Representative images showing the colocalized expression of rDA1m and DA2h. Similar results were observed for 3 mice. Scale bar, 1 mm.
i, Representative traces of rDA1m and DA2h ΔF/F0 measured during the indicated stages of mating. Similar results were observed for 3 mice.
j, The time shift correlation coefficient between the rDA1m and DA2h signals. n=3 mice.
k, Average post-stimulus histograms aligned to the onset of the indicated mating events. n=3 mice.
l, Group summary of the ΔF/F0 measured for rDA1m and DA2h during the indicated mating events. n=3 mice. F4,16=8.613, p=0.0007 (***) for row factor and F1,4=52.46, p=0.0019 (**) by two-way ANOVA. Bonferroni’s multiple comparisons test were performed between groups, p>0.99 (n.s.), p=0.0208 (*), p=0.0092 (**), p=0.0004 (***), p=2.0×10⁻⁶ (***).
Average traces shaded with ± s.e.m. are shown in d, e, j, k. Data are presented as the mean ± s.e.m. in f, l.
We next compared the performance of red fluorescent rDA1m sensor with that of the green fluorescent DA sensor, DA2h. We co-injected viruses expressing rDA1m and DA2h into the NAc core and performed dual-color fiber photometry recording (Fig. 6g,h). While the dynamic range (ΔF/F0) of rDA1m is smaller than that of DA2h (Fig. 6i–l), rDA1m and DA2h detected qualitatively similar DA release during sexual behavior based on Z scored signals (Extended Data Fig. 10d–f). The moment-to-moment correlation coefficient between rDA1m and DA2h is similar to that between DA1h and DA2h (Fig. 6d,j). Importantly, we did not observe crosstalk between the red and green DA sensors as we did not detect a signal in the red channel when we delivered only 470 nm light and vice versa (Extended Data Fig. 10g–j). Taken together, rDA1m is capable of detecting DA release in vivo during natural behaviors and the behavior–related DA responses detected by the red and green DA sensors are qualitatively similar.
Discussion
Here, we report the development and characterization of a set of genetically encoded DA sensors. The availability of both high-affinity and medium-affinity versions provides the opportunity to probe DA dynamics over a broad range of concentrations.
The on rate of sensors can be the rate-limiting step to detect the release of dopamine upon physiologically relevant stimuli. Our sensors show fast kinetics that enable them to report subsecond events. The τon measured in cultured cells, brain slices, Drosophila and mice are within 80 ms, 150 ms, 40 ms and 120 ms, respectively. We note that the τon measured in brain slices and mice are an overestimate considering the time needed for the stimulation to release DA. The τoff measured in vivo in Drosophila and mice are within 280 ms and 610 ms, respectively. We note that these measured values depend on both the off kinetics of sensors and the speed of DA clearance. There is generally a tradeoff between SNR and off kinetics. Sensors with slower off kinetics have the advantage of prolonged photon collection, which contributes to a higher SNR. Our medium-affinity sensors can be used when faster off kinetics are required.
Our Drosophila in vivo imaging results demonstrate that the expression of GRABDA sensors has no substantial effect on the body shock–evoked cAMP signal and the odor–evoked calcium signal, which are the downstream signaling events of Drosophila endogenous DA receptors44,45. This suggests that DA buffering by the sensors in the extracellular space does lead to minimal perturbation to the endogenous cell physiology. Any residual buffering effect can be partially relieved by adjusting the expression level of the sensor, and by future improvements in the brightness and response of sensors.
Finally, the GRAB–based sensor strategy can be applied to creating genetically encoded sensors based on a wide range of G-protein–coupled receptors11,46–48, leading to a robust and versatile multi-color toolbox for creating comprehensive functional maps of neurochemical activity.
Online Methods
Animals.
Male and female postnatal 0-day-old (P0) Sprague-Dawley rats (Beijing Vital River Laboratory) and adult (P42–90) wild-type C57BL/6N (Beijing Vital River Laboratory), wild-type C57BL/6N (Charles River Laboratories), DAT-IRES-Cre mice (Jackson Laboratory, stock number 06660), Drd1-cre mice (MMRRC_036916-UCD, Extended Data Fig. 9), Drd1-cre mice (MMRRC_030989-UCD, Extended Data Fig. 10a–c) were used in this study. Mice were housed at 18–23°C with 40–60% humidity under a 12 h/12 h light-dark cycle, with food and water available ad libitum. All procedures for animal surgery, maintenance, and behavior were performed using protocols that were approved by the respective animal care and use committees at Peking University, New York University, and the US National Institutes of Health.
The transgenic Drosophila lines UAS-rDA1m, UAS-rDA-mut, UAS-DA2m, UAS-dLight1.3b, LexAoP-DA2m, and UAS-Pink-Flamindo were generated using Phi-C31–directed integration into attp40 or VK00005 at the Core Facility of Drosophila Resource and Technology, Shanghai Institute of Biochemistry and Cell Biology, Chinese Academy of Sciences. The following Drosophila lines were also used in this study: UAS-DA1m (BDSC: 80047), R13F02-Gal4 (BDSC: 48571), R13F02-LexA (BDSC: 52460), 30y-Gal4, and TH-Gal4-3p3-RFP49 (all gifts from Yi Rao, Peking University, Beijing); MB312C-Gal4 (Fly light: 2135360); MB315C-Gal4 (Fly light: 2135363); UAS-CsChrimson-mCherry (a gift from Chuan Zhou, Institute of Zoology, Chinese Academy of Sciences, Beijing); and UAS-GCaMP5G (BDSC: 42038). The flies were raised on standard cornmeal-yeast medium at 25°C, 70% relative humidity, and a 12 h/12 h light-dark cycle. Adult female flies within 2 weeks after eclosion were used for fluorescence imaging.
Molecular Biology.
DNA fragments were generated using PCR amplification with primers (TSINGKE Biological Technology) containing 30 bp of overlap. The fragments were then assembled into plasmids using Gibson assembly50. All plasmid sequences were verified using Sanger sequencing (TSINGKE Biological Technology). For characterization in HEK293T cells, the genes expressing the red and green DA sensors were cloned into the pDisplay vector, with an IgK leader sequence inserted upstream of the sensor gene. The IRES-EGFP-CAAX gene (for red DA sensors) or IRES-mCherry-CAAX gene (for green DA sensors) was attached downstream of the sensor gene and was used as a membrane marker and to calibrate the fluorescence signal intensity. Site–directed mutagenesis was performed using primers containing randomized NNB codons (48 codons in total, encoding 20 possible amino acids) or defined codons on the target sites. For characterization in cultured neurons, the sensor genes were cloned into the pAAV vector under the control of the human synapsin promoter (hSyn). To generate stable cell lines expressing wild-type D2R, rDA1h, or DA2h, we generated a vector called pPacific, containing various elements, including 30 TR, the myc tag gene, a 2A sequence, the mCherry gene, the puromycin gene, and 50 TR; the genes were then cloned into the pPacific vector using Gibson assembly. Two mutations (S103P and S509G) were introduced in pCS7-PiggyBAC (ViewSolid Biotech) to generate a hyperactive piggyBac transposase51 for generating stable cell lines. For the TANGO assay, the wild-type D2R, rDA1h, or DA2h genes were cloned into the pTango vector31. For the luciferase complementation assay, we replaced the β2AR gene in the β2AR-Smbit construct30 with the wild-type D2R, rDA1h, or DA2h genes. To generate transgenic Drosophila lines, the respective sensor genes were cloned into the pJFRC28 for UAS lines and modified pJFRC19 (the SV40 terminator was replaced by the terminator from the AcNPV p10 gene) for LexAop lines, which were then used for Phi-C31 site-specific insertion.
Preparation and fluorescence imaging of cultured cells.
HEK293T cells were cultured in DMEM (Gibco) supplemented with 10% (v/v) fetal bovine serum (Gibco) and 1% penicillin-streptomycin (Gibco) at 37°C in 5% CO2. The cells were plated on 96-well plates or 12 mm glass coverslips in 24-well plates and grown to 60% confluence for transfection. For transfection, the cells were incubated in a mixture containing 1 μg DNA and 3 μg PEI for 6 h. Fluorescence imaging was performed 24–48 h after transfection. Rat cortical neurons were prepared from P0 Sprague-Dawley rat pups (Beijing Vital River Laboratory). In brief, cortical neurons were dissociated from dissected rat brains in 0.25% Trypsin-EDTA (Gibco), plated on 12 mm glass coverslips coated with poly-D-lysine (Sigma-Aldrich), and cultured in Neurobasal medium (Gibco) containing 2% B-27 supplement (Gibco), 1% GlutaMAX (Gibco), and 1% penicillin-streptomycin (Gibco) at 37°C in 5% CO2. The neurons were transfected with an AAV expressing rDA1m, rDA1h, DA2m, DA2h, or dLight1.1 (Vigene Biosciences) after 7–9 days in culture, and fluorescence imaging was performed 3–7 days after transfection.
Cultured cells were imaged using an inverted Ti-E A1 confocal microscope (Nikon) and the Opera Phenix high-content screening system (PerkinElmer). The confocal microscope was equipped with a 40×/1.35 NA oil-immersion objective, a 488 nm laser, and a 561 nm laser. During fluorescence imaging, the cells were either bathed or perfused in a chamber containing Tyrode’s solution consisting of (in mM): 150 NaCl, 4 KCl, 2 MgCl2, 2 CaCl2, 10 HEPES, and 10 glucose (pH 7.4). Solutions containing various concentrations of DA (Sigma-Aldrich) and/or 1 μM Halo (Tocris), SCH-23390 (Tocris), Etic (Tocris), L-DOPA (Abcam), 5-HT (Tocris), histamine (Tocris), Glu (Sigma-Aldrich), GABA (Tocris), Ado (Tocris), ACh (Solarbio), NE (Tocris), Tyr (Sigma-Aldrich), or Oct (Tocris) were delivered via a custom–made perfusion system or via bath application. Between experiments, the chamber was thoroughly cleaned with 75% ethanol, 3% hydrogen peroxide, and Tyrode’s solution. GFP fluorescence was collected using a 525/50 nm emission filter, and RFP fluorescence was collected using a 595/50 nm emission filter. To measure the response kinetics, a glass pipette filled with DA or Halo was positioned close to the GRABDA-expressing cells, and the fluorescence signals were measured using confocal line-scanning (scanning speed at 1280 Hz). To measure the on-rate, 100 μM DA in glass pipette was applied. To measure the off-rate, 1 mM Halo in glass pipette was applied to the sensor-expressing cells bathed in DA (10 μM DA for rDA1m and DA2m, 1 μM DA for rDA1h and DA2h). Photostability was measured under 1-photon illumination (confocal microscopy) using a 488 nm laser with the laser power of 350 μW and the intensity of ~2.2 W/cm2, a 561 nm laser with the laser power of 790 μW and the intensity of ~4.9 W/cm2, and under 2-photon illumination using a 920 nm laser with the laser power of 27.5 mW and the intensity of ~13 W/cm2. Photobleaching was applied to the entire sensor-expressing HEK293T cell at an area of 200 μm2. Blue light–mediated photoactivation was measured using a 488 nm laser with the laser power of 350 μW and the intensity of ~0.7 W/cm2. The Opera Phenix high-content screening system was equipped with a 60×/1.15 NA water-immersion objective, a 488 nm laser, and a 561 nm laser. GFP fluorescence was collected using a 525/50 nm emission filter, and RFP fluorescence was collected using a 600/30 nm emission filter. Where indicated, the culture medium was replaced with 100 μl Tyrode’s solution containing various concentrations of the indicated drugs. The red and green sensors’ fluorescence intensity was calibrated using EGFP and mCherry, respectively.
Spectra measurements.
HEK293T cells stably expressing rDA1m, rDA1h, or DA2h were harvested and transferred to a 96-well plate in the absence or presence of 100 μM DA, and excitation and emission spectra were measured at 5 nm increments using a Safire2 multi-mode plate reader (Tecan).
Luciferase complementation assay.
The luciferase complementation assay was performed as previously described30. In brief, 24–48 h after transfection, HEK293T cells expressing rDA1h with LgBit-mGi, DA2h with LgBit-mGi, or LgBit-mGi alone were washed in PBS, harvested by trituration, and transferred to 96-well plates. DA at various concentrations (ranging from 1 nM to 100 μM) was applied to the cells, and furimazine (NanoLuc Luciferase Assay, Promega) was then applied to a final concentration of 5 μM, after which luminescence was measured using a Victor X5 multi-label plate reader (PerkinElmer).
TANGO assay.
DA was applied at various concentrations (ranging from 0.1 nM to 10 μM) to a reporter cell line stably expressing a tTA-dependent luciferase reporter and a β-arrestin2-TEV fusion gene31 transfected to express wild-type D2R, rDA1h, or DA2h. The cells were then cultured for 12 h to allow for luciferase expression. Bright-Glo (Fluc Luciferase Assay System, Promega) was then applied to a final concentration of 5 μM, and luminescence was measured using a VICTOR X5 multi-label plate reader (PerkinElmer).
GTPγS treatment.
The culture medium of HEK293T cells expressing rDA1h or DA2h was replaced by 100 μl Tyrode’s solution before experiments. For the group with GTPγS treatment, cells were subsequently incubated with 50 μg/ml digitonin (Sigma-Aldrich) for 5 min to permeabilize the cell membrane and washed for 2 times with 100 μl Tyrode’s solution. The cells were then incubated with Tyrode’s solution containing 100 μM GTPγS (Sigma-Aldrich) for 10 min. Various concentration of DA (ranging from 0.01 nM to 100 μM) was applied. The fluorescence signals were measured using Opera Phenix high-content screening system (PerkinElmer) mentioned above.
Preparation and fluorescence imaging of acute brain slices.
Wild-type male and female adult (P42-56) C57BL/6N mice were anesthetized with an intraperitoneal injection of 2,2,2-tribromoethanol (Avertin, 500 mg/kg body weight, Sigma-Aldrich), and then placed in a stereotaxic frame for AAV injection using a microsyringe pump (Nanoliter 2000 Injector, WPI). In Fig. 3a–e, AAVs expressing hSyn-rDA1m, hSyn-rDA1h, or hSyn-DA2m (Vigene Biosciences) were injected (400 nl per injection site) into the NAc using the following coordinates: AP: +1.4 mm relative to Bregma, ML: ±1.2 mm relative to Bregma, depth: 4.0 mm from the dura. In Fig. 3f–k, the AAV expressing hSyn-rDA1m (Vigene Biosciences) was injected (400 nl per injection site) into the NAc using the coordinates listed above, and the AAV expressing hSyn-axon-GCaMP6s (BrainVTA) was injected (400 nl per injection site) into the VTA using the following coordinates: AP: −3.2 mm relative to Bregma, ML: ±0.5 mm relative to Bregma, depth: 4.1 mm from the dura.
Two weeks after virus injection, the mice were anesthetized with an intraperitoneal injection of Avertin (500 mg/kg body weight) and perfused with ice-cold oxygenated slicing buffer containing (in mM): 110 choline-Cl, 2.5 KCl, 1 NaH2PO4, 25 NaHCO3, 7 MgCl2, 25 glucose, and 0.5 CaCl2. The brains were immediately removed and placed in ice-cold oxygenated slicing buffer. The brains were sectioned into 300 μm thick slices using a VT1200 vibratome (Leica), and the slices were incubated at 34°C for at least 40 min in oxygenated artificial cerebrospinal fluid (ACSF) containing (in mM): 125 NaCl, 2.5 KCl, 1 NaH2PO4, 25 NaHCO3, 1.3 MgCl2, 25 glucose, and 2 CaCl2. For fluorescence imaging, the slices were transferred to an imaging chamber and placed under an FV1000MPE 2-photon microscope (Olympus) equipped with a 25×/1.05 NA water-immersion objective and a mode–locked Mai Tai Ti: Sapphire laser (Spectra-Physics). A 950 nm laser was used to excite rDA1m and rDA1h, and fluorescence was collected using a 575–630 nm filter. A 920 nm laser was used to excite DA2m, and fluorescence was collected using a 495–540 nm filter. For electrical stimulation, a bipolar electrode (cat. number WE30031.0A3, MicroProbes for Life Science) was positioned near the core of the NAc using fluorescence guidance. Fluorescence imaging and electrical stimulation were synchronized using an Arduino board with custom-written programs. All images collected during electrical stimulation were recorded at a frame rate of 0.1482 s/frame with 128×96 pixels per frame. The stimulation voltage was 4–6 V, and the duration of each stimulus was 1 ms. Drugs were applied to the imaging chamber by perfusion at a flow rate at 4 ml/min.
Fluorescence imaging of transgenic flies.
Adult female flies (within 2 weeks after eclosion) were used for fluorescence imaging. The fly dissection procedure, the recipe for adult hemolymph-like solution (AHLS), as well as two-photon microscopy setup for odor, body shock and DA perfusion have been described previously11. A 575–630 nm filter and a 575–630 nm filter were used to collect the red and green fluorescence respectively. A 950 nm laser was used to excite rDA1m and Pink-Flamindo, a 930 nm laser was used to excite DA2m and dLight1.3b, a 950 nm laser was used for DA2m & Pink-Flamindo dual-color imaging, and a 1000 nm laser was used for GCaMP5 & rDA1m dual-color imaging. Linear-unmixing was adopted to process dual-color imaging results. For optogenetic stimulation, a 200 mW 635 nm laser (Changchun Liangli photoelectricity Ltd.) was used to deliver light to the fly brain via an optical fiber. An Arduino board with custom–written programs was used to synchronize the stimulation and fluorescence imaging. The sampling rate during odorant stimulation, electrical stimulation, body shock, and DA perfusion was 6.7 Hz, 12 Hz, 6.7 Hz, and 1 Hz, respectively.
Fiber photometry recording of nigrostriatal DA release in freely moving mice.
Adult (P42–56) male and female DAT-IRES-Cre mice (Jackson Laboratory, stock number 06660) and Drd1-cre mice (MMRRC_036916-UCD) were anesthetized with isoflurane and placed in a stereotaxic frame for AAV injection. AAVs expressing hSyn-rDA1m, hSyn-rDA1h, hSyn-rDA-mut, hSyn-DA2m, or hSyn-DA2h (Vigene Biosciences) as well as hSyn-EGFP (Addgene, cat. number 50465) or hSyn-tdTomato (a gift from Dr. Yakel’s Lab, NIEHS) were injected (1 μl per site) into the dorsal striatum using the following coordinates: AP: −0.5 mm relative to Bregma, ML: ±2.4 mm relative to Bregma, depth: 2.2 mm from the dura. The AAV expressing Ef1α-DIO-C1V1-YFP (NIEHS Viral Vector Core) was injected (500 nl per site) into the SNc using the following coordinates: AP: −3.1 mm relative to Bregma, ML: ±1.5 mm relative to Bregma, depth: 4.0 mm from the dura. For the dual-color recording in Extended Data Fig. 9, AAVs expressing hSyn-DIO-NES-jRGECO1a52 (NIEHS Viral Vector Core) and hSyn-DA2m (Vigene Biosciences) were injected at a 9:1 ratio with a total volume of 1 ul, using the following coordinates: AP: +0.5 mm relative to Bregma, ML: ±1.8 mm relative to Bregma, depth: 2.75 mm from the dura. Optical fibers (105 μm core/125 μm cladding) were implanted in the dorsal striatum and SNc 4 weeks after AAV injection. Fiber photometry recording in the dorsal striatum was performed using a 488 nm laser at 50 μW for DA2m and DA2h, a 488 nm laser at 1 μW and a 561 nm laser at 50 μW for rDA1m, rDA1h, rDA-mut and jRGECO1a. C1V1 in the SNc was stimulated using a 561 nm laser at 9.9 mW. Spectral data were acquired by the software OceanView (Ocean Insight). The measured emission spectra were fitted using a linear unmixing algorithm (https://www.niehs.nih.gov/research/atniehs/labs/ln/pi/iv/tools/index.cfm). To evoke C1V1–mediated DA release, pulse trains (10 ms pulses at 20 Hz for 1 s) were delivered to the SNc using a 561 nm laser at 9.9 mW. To avoid signal decay, the excitation lasers were controlled using an optical shutter (Thorlabs) in which the shutter was turned on 10 s before the 561 nm pulse trains and turned off 35 s after stimulation. To test the effects of methylphenidate and eticlopride on C1V1–evoked responses, 5 optical stimulation trains were given with an interval of 1 min (for green GRABDA sensors) or 2 min (for red GRABDA sensors) between each train to obtain baseline responses. Then 10 mg/kg methylphenidate was administered by intraperitoneal (i.p.) injection. 10 min after the i.p. injection, 5 more optical stimulation trains were delivered to record the C1V1–evoked responses under the influence of methylphenidate. Finally, an i.p. injection of 1 mg/kg eticlopride was given and 5 more trials of optical stimulations were delivered 10 min after the injection to record C1V1–evoked responses under eticlopride.
Fiber photometry recording of DA dynamics in the NAc during sexual behavior.
Adult (P60–90) wild-type male C57BL/6N mice (Charles River Laboratories) and Drd1-cre male mice (MMRRC_030989-UCD) were anesthetized with isoflurane and placed in a stereotaxic frame for AAV injection. For Fig. 6, AAVs expressing hSyn-rDA1m, hSyn-DA1h or hSyn-DA2h (Vigene Biosciences) were injected (80–140 nl per site) into the NAc using the following coordinates: AP: +0.98 mm relative to Bregma, ML: ±1.2 mm relative to Bregma, depth: 4.6 mm from the dura. For the co-expression of rDA1m and DA2h in Fig. 6g–l, AAVs expressing hSyn-rDA1m and hSyn-DA2h were injected at a 1:1 ratio. For the bilateral recording in Extended Data Fig. 10a–c, AAV expressing hSyn-DIO-DA2h was injected bilaterally using the same coordinates described above. After AAV injection, optical fibers (400 μm diameter) were implanted in the NAc, and fiber photometry recording was performed two weeks after AAV injection. The setups for bilateral recording and dual-color recording are shown in Fig. 6a and Fig. 6g, respectively. In brief, a 311 Hz 472/30 nm filtered LED (Thorlabs) at 30 µW was used to excite DA1h and DA2h, and a 400 Hz 590/20 nm filtered LED (Thorlabs) at 30 µW was used to excite rDA1m. A 535/50 nm filter was used to collect the fluorescence signal from DA1h and DA2h, and a 524/628-25 nm dual-band bandpass filter was used to collected the fluorescence signal from rDA1m and DA2h during the dual-color recording. The signals were recorded using a real-time processor (RZ5, TDT) and extracted in real time using a custom TDT program. Animal behaviors were recorded using the commercial video acquisition software StreamPix 5 (Norpix). Behavioral annotation and tracking were performed using custom MATLAB codes (MATLAB R2019a, MathWorks). The various sexual behaviors are defined as previously described11 following published conventions53. For immunofluorescence, the mice were anesthetized and then perfused with 4% paraformaldehyde (PFA). The brains were removed, fixed in 4% PFA for 4 h, and then cryoprotected in 20% (w/v) sucrose for 24 h. The brains were then embedded in tissue-freezing medium and sectioned into 60 μm thick slices using a CM1900 cryostat (Leica). rDA1m was immunostained using a rabbit anti-RFP antibody (1:1000, Takara, cat. number 632496) followed by a Cy3-conjugated donkey anti-rabbit secondary antibody (1:1000, Jackson ImmunoResearch, cat. number 113713). DA1h and DA2h were immunostained using a chicken anti-GFP antibody (1:1000, Abcam, cat. number ab13970) followed by an Alexa 488-conjugated donkey anti-chicken secondary antibody (1:1000, Jackson ImmunoResearch, cat. number 116967). The fluorescence images were acquired with a virtual slide microscope (Olympus, VS120).
Quantification and statistical analysis.
Imaging data from cultured cells, acute brain slices, and transgenic flies were processed using ImageJ 1.52p software (NIH). The fluorescence response (ΔF/F0) was calculated using the formula (F–F0)/F0, in which F0 is the baseline fluorescence signal. The signal-to-noise ratio (SNR) was calculated as the peak response divided by the standard deviation of the baseline fluorescence fluctuation. The cross-correlation analyses were performed using NeuroExplorer 5 (Nex Technologies) and GraphPad Prism 7. Values with error bars indicate mean ± s.e.m.. The statistical analyses were performed using GraphPad Prism 7 and 8. Two-tailed Student’s t-test, two-way ANOVA with Bonferroni’s multiple comparisons test (Fig. 6f,l, Extended Data Fig. 10c,f), one-way ANOVA with Tukey’s multiple comparisons test (Extended Data Fig. 10h,j) were performed. *p<0.05, **p<0.01, ***p<0.001, n.s. p>0.05. The exact p value is specified in the legends. The graphs were generated using OriginPro 9.1 (OriginLab) and GraphPad Prism 7 and 8.
Reporting Summary.
Further information on research design is available in the Life Sciences Reporting Summary linked to this article.
Data availability.
Plasmids for expressing the sensors used in this study and the sequences were available from Addgene (https://www.addgene.org/Yulong_Li/, cat. numbers 140553, 140554, 140555, 140556, 140557, 140558). Source data for Figures 1–6 and Extended Data Figures 1 and 3–10 are provided with this paper.
Code availability.
The custom MATLAB codes and TDT programs are available from https://github.com/pdollar/toolbox, https://github.com/bd125/GRAB_DA_Fig6_Code.
Extended Data
Extended Data Fig. 1. The development of red fluorescent DA sensors and second-generation green fluorescent DA sensors.
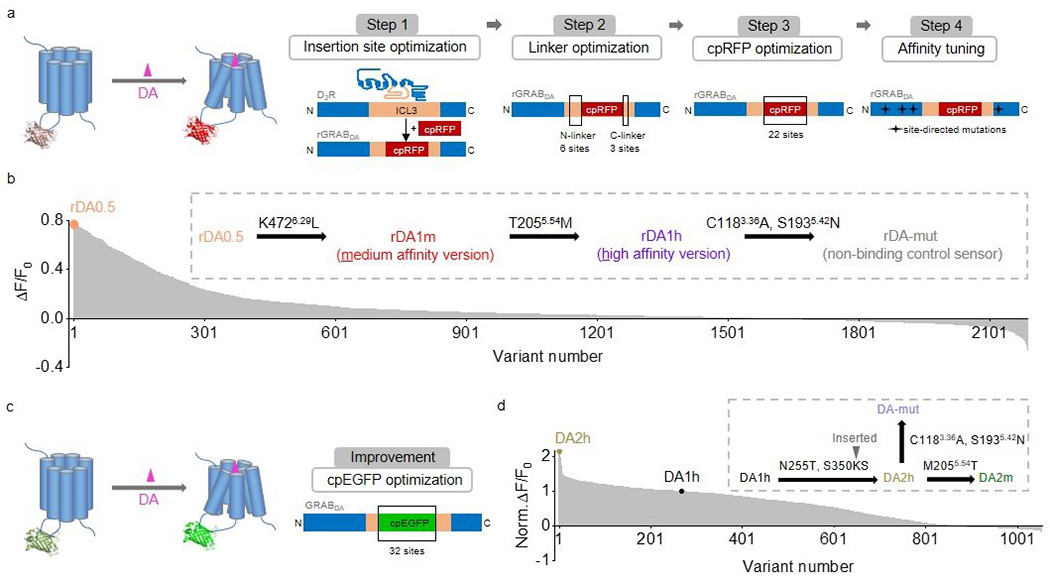
a, Schematic illustration showing the design and optimization of the red fluorescent GRABDA sensors.
b, The response to 100 μM DA measured for red fluorescent DA sensor variants during steps 1‒3. The variant with the highest fluorescence change (named rDA0.5) was then sequentially mutated as shown to generate rDA1m, rDA1h, and rDA-mut.
c, Schematic illustration showing the design and optimization of the green fluorescent GRABDA sensors.
d, Normalized ΔF/F0 in response to 100 μM DA measured for green fluorescent DA sensor variants, normalized to the first-generation DA1h sensor. DA2h was then mutated as shown to generate DA2m and DA-mut.
The superscripts in the insets of b,d are based on the Ballesteros–Weinstein numbering scheme54, indicating the mutation sites in the D2R.
Extended Data Fig. 2. The sequences of GRABDA sensors and the residues related to affinity-tuning, cpRFP and cpEGFP optimization.
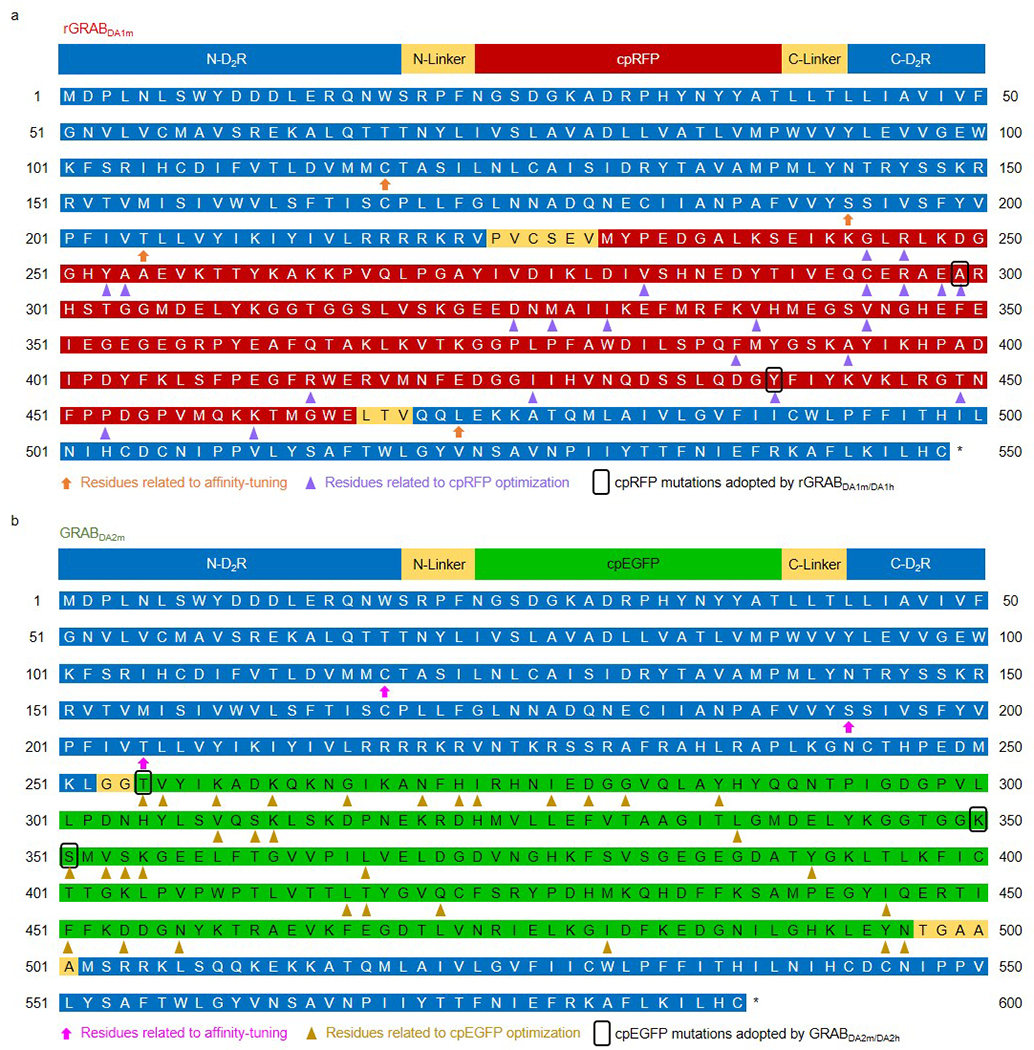
a,b, The sequences of rGRABDA1m (a) and GRABDA2m (b). The residues related to affinity-tuning, cpRFP (a) and cpEGFP (b) optimization are marked. T2055.54M was introduced to rDA1m and DA2m to generate rDA1h and DA2h, respectively.
Extended Data Fig. 3. Characterization of the sensors in HEK293T cells.
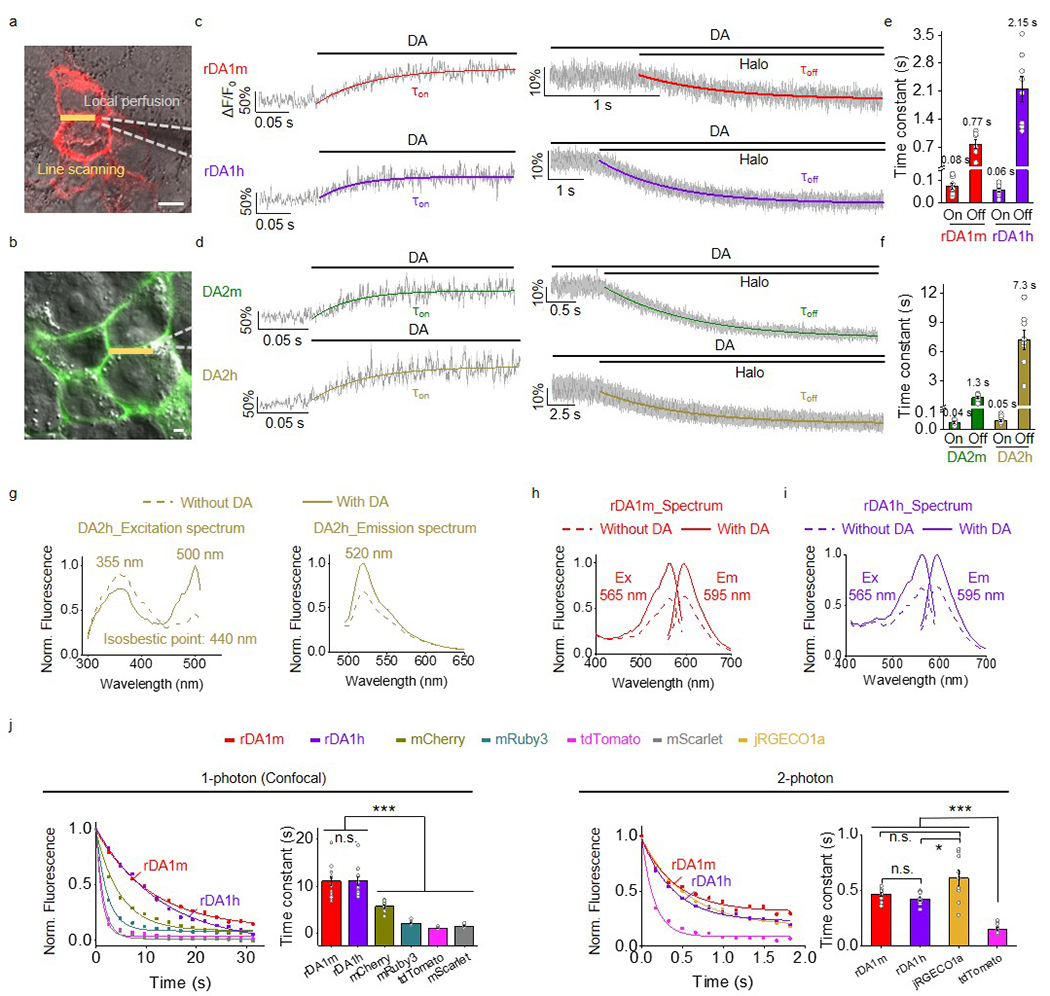
a,b, Schematic illustration showing the local perfusion system. Scale bars, 10 μm.
c,d, Representative traces showing the response to DA (left) and subsequent addition of Halo (right). The traces were the average of 3 different regions of interest (ROIs) on the scanning line, shaded with ± s.e.m.. Each trace was fitted with a single-exponential function to determine τon (left) and τoff (right). Similar results were observed for 7-10 cells.
e,f, Group summary of τon and τoff. n=10, 7, 9, 8, 10, 8, 10, 8 cells for rDA1m (τon), rDA1m (τoff), rDA1h (τon), rDA1h (τoff), DA2m (τon), DA2m (τoff), DA2h (τon), DA2h (τoff).
g-i, Excitation and emission spectra for the indicated sensors in the absence and presence of DA.
j, Photostability of rDA1m and rDA1h (in the presence of 100 μM DA) and the indicated fluorescent proteins was measured using 1-photon and 2-photon microscopy. Each photobleaching curve was fitted to a single-exponential function to determine the time constant. 1-photon, n=12 cells each. 2-photon, n=10, 10, 9, 10 cells for rDA1m, rDA1h, jRGECO1a, tdTomato. Two-tailed Student’s t-test was performed. 1-photon, p=0.9755 (n.s.) between rDA1m and rDA1h; p=2.72×10⁻⁵ (***) between rDA1m and mCherry; p=7.10×10⁻⁹ (***) between rDA1m and mRuby3; p=7.90×10⁻¹⁰ (***) between rDA1m and tdTomato; p=1.95×10⁻⁹ (***) between rDA1m and mScarlet; p=1.28×10⁻⁵ (***) between rDA1h and mCherry; p=2.50×10⁻⁹ (***) between rDA1h and mRuby3; p=2.66×10⁻¹⁰ (***) between rDA1h and tdTomato; p=6.75×10⁻¹⁰ (***) between rDA1h and mScarlet. 2-photon, p=0.0963 (n.s.) between rDA1m and rDA1h; p=0.0511 (n.s.) between rDA1m and jRGECO1a; p=0.0139 (*) between rDA1h and jRGECO1a; p=2.82×10⁻¹¹ (***) between rDA1m and tdTomato; p=1.71×10⁻¹⁰ (***) between rDA1h and tdTomato; p=2.96×10⁻⁶ (***) between jRGECO1a and tdTomato.
Data are presented as the mean ± s.e.m. in e, f, j (bar graph).
Extended Data Fig. 4. The response of GRABDA sensors to different compounds.
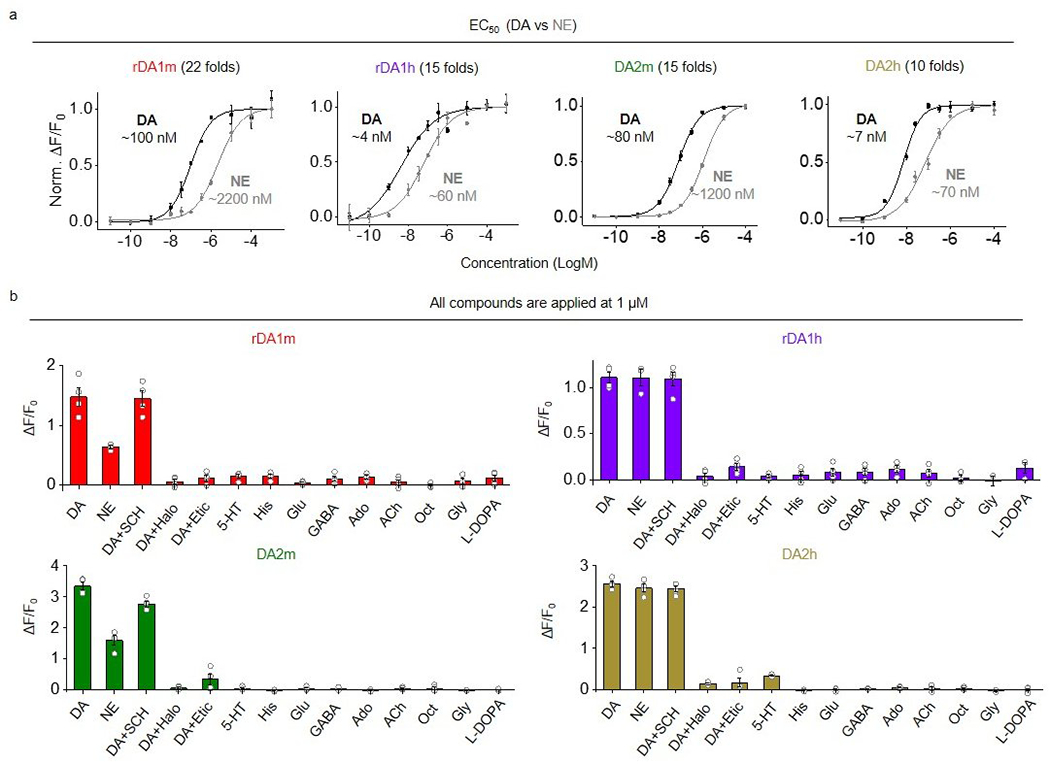
a, The normalized dose-response curves for DA and NE in sensor-expressing HEK293T cells. n=3 wells with 200–800 cells/well.
b, The ΔF/F0 in sensor-expressing cells in response to the indicated compounds applied at 1 μM. n=3 wells for rDA1h in response to NE, 5-HT, Oct, Gly and L-DOPA. n=4 wells for the others. Each well contains 200-1200 cells.
Data are presented as the mean ± s.e.m..
Data replotted from Fig. 2a.
Extended Data Fig. 5. The minimal coupling of GRABDA sensors to downstream Gi pathway and β-arrestin pathway.
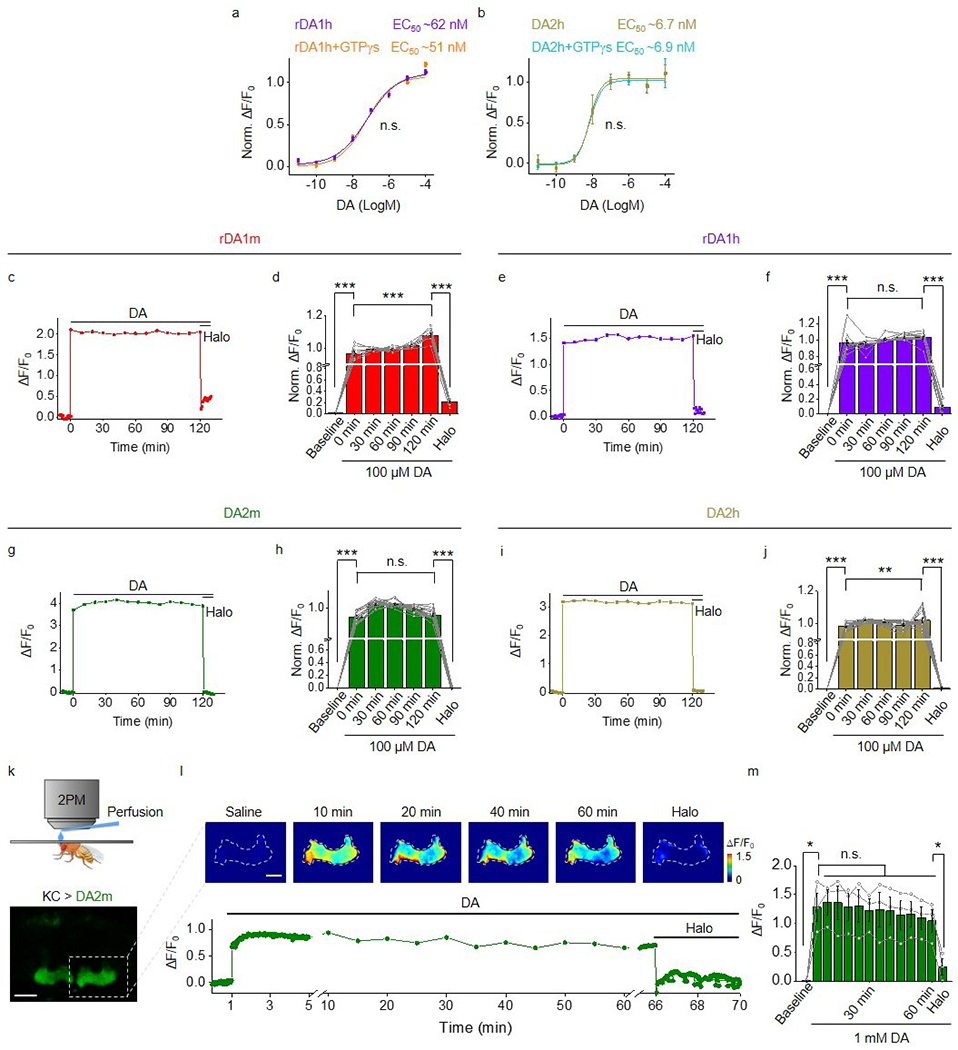
a,b, Normalized ΔF/F0 in sensor-expressing cells in response to DA, with or without the pre-bathing of GTPγS. n=3 wells with 500–3000 cells/well.
c,d, The representative trace of ΔF/F0 (c) and the group summary of normalized ΔF/F0 (d) in rDA1m-expressing neurons during a 2-hour treatment of 100 μM DA. n=9 neurons. For the group summary, the averaged ΔF/F0 of each neuron during the 2-hour DA treatment is normalized to 1. Two-tailed Student’s t-test was performed. p=2.10×10⁻²¹ (***) between baseline and 0 min; p=2.99×10⁻¹⁷ (***) between 120 min and Halo; p=1.24×10⁻⁵ (***) between 0 min and 120 min.
e,f, Similar to c and d except that rDA1h was expressed in cultured neurons. n=11 neurons. Two-tailed Student’s t-test was performed. p=1.87×10⁻⁶ (***) between baseline and 0 min; p=3.43×10⁻¹⁷ (***) between 120 min and Halo; p=0.1519 (n.s.) between 0 min and 120 min.
g,h, Similar to c and d except that DA2m was expressed in cultured neurons. n=15 neurons. Two-tailed Student’s t-test was performed. p=2.48×10−39 (***) between baseline and 0 min; p=7.42×10⁻³⁵ (***) between 120 min and Halo; p=0.3322 (n.s.) between 0 min and 120 min.
i,j, Similar to c and d except that DA2h was expressed in cultured neurons. n=17 neurons. Two-tailed Student’s t-test was performed. p=1.14×10−52 (***) between baseline and 0 min; p=9.80×10−38 (***) between 120 min and Halo; p=0.0061 (**) between 0 min and 120 min.
k, Top, schematic illustration depicting the in vivo perfusion experiment. Bottom, the fluorescence image of a transgenic fly expressing DA2m in MB KCs. Scale bar, 50 μm.
l,m, Representative images (l, top), trace (l, bottom) and group summary (m) of ΔF/F0 in response to the 1-hour perfusion of 1 mM DA followed by 100 μM Halo in a transgenic fly expressing DA2m in MB KCs. n=3 flies. Scale bar, 25 μm. Two-tailed Student’s t-test was performed. p=0.0382 (*) between baseline and 10 min; p=0.0293 (*) between 60 min and Halo; p=0.5289 (n.s.), 0.5593 (n.s.), 0.9559 (n.s.), 0.8537 (n.s.), 0.6346 (n.s.), 0.6530 (n.s.), 0.2760 (n.s.), 0.1649 (n.s.), 0.1547 (n.s.), 0.1152 (n.s.), 0.1044 (n.s.) between 5 min and 10 min, 15 min, 20 min, 25 min, 30 min, 35 min, 40 min, 45 min, 50 min, 55 min, 60 min, respectively.
Data are presented as the mean ± s.e.m.. in a, b, d, f, h, j, m.
Extended Data Fig. 6. Comparison between dLight and GRABDA.
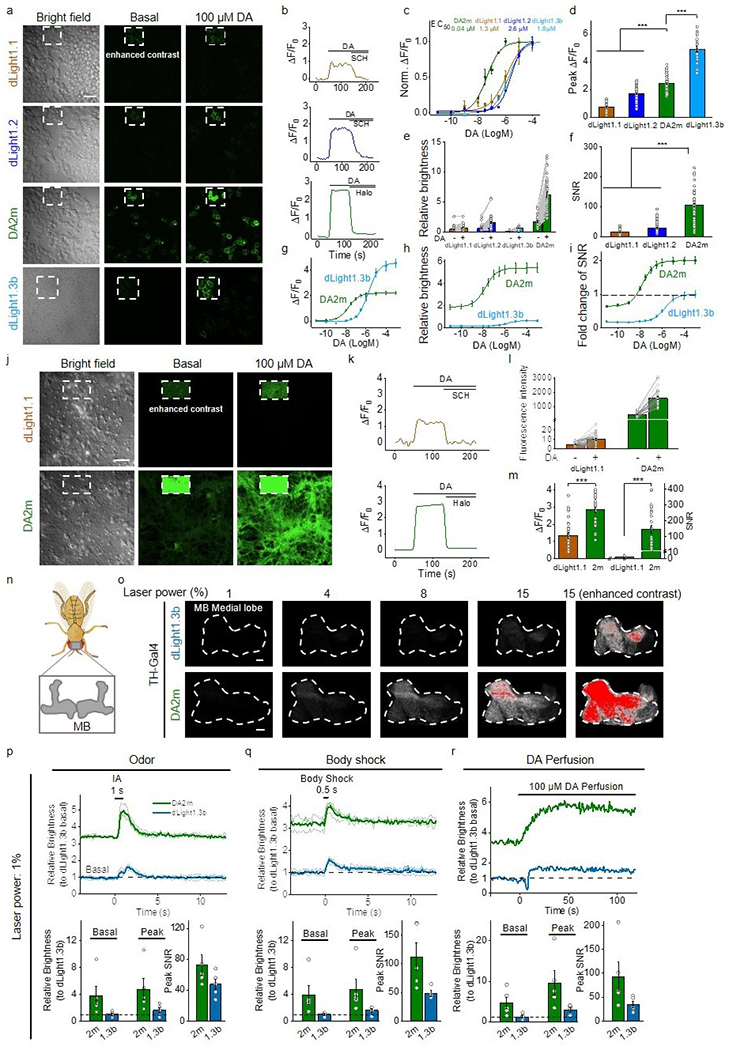
a, Representative bright-field and fluorescence images acquired before (baseline) and after application of DA in sensor-expressing HEK293T cells. Similar results were observed for more than 20 cells. Scale bar, 50 μm.
b, Representative traces of ΔF/F0 in response to 100 μM DA followed by either 10 μM SCH or 10 μM Halo. Similar results were observed for more than 30 cells.
c, Normalized dose-response curves. n=3 wells with 100–500 cells/well.
d-f, Group summary of the peak ΔF/F0 (d), relative brightness (green/red ratio, GR ratio) (e), and signal-to-noise ratio (SNR) (f) in response to 100 μM DA. d, n=73, 62, 61, 20 cells for dLight1.1, dLight1.2, DA2m, dLight1.3b. e, n=77, 66, 20, 60 cells for dLight1.1, dLight1.2, dLight1.3b, DA2m. f, n=74, 63, 61 cells for dLight1.1, dLight1.2, DA2m. Two-tailed Student’s t-test was performed. d, p=2.10×10−48 (***) between dLight1.1 and DA2m; p=1.31×10⁻¹² (***) between dLight1.2 and DA2m; p=1.22×10⁻¹⁰ (***) between dLight1.3 and DA2m. f, p=4.09×10⁻²² (***) between dLight1.1 and DA2m; p=1.13×10⁻³³ (***) between dLight1.2 and DA2m.
g-i, Dose-response curves (g), relative brightness (h), and fold change of SNR (i) for dLight1.3b and DA2m. n=20 cells each.
j-m, Similar to a-f, except that dLight1.1 and DA2m were expressed in cultured neurons. m, left, n=30, 28 cells for dLight1.1, DA2m. m, right, n=30 cells each. Scale bar, 50 μm. Two-tailed Student’s t-test was performed. m, left, p=4.43×10⁻⁸ (***); right, p=3.59×10⁻⁸ (***).
n, Schematic illustration depicting the location of the Drosophila olfactory mushroom body (MB).
o, Fluorescence images of the MB using 2-photon microscopy at the indicated laser power settings. Enhanced-contrast images at 15% laser power are shown. Fluorescence is shown in grayscale, with saturated pixels shown in red. Similar results were observed for 4-5 flies. Scale bars, 10 μm.
p-r, Representative traces (top) and group summary of relative brightness during odorant application (p), body shock (q), and DA perfusion (r). p,r, n=5 flies each. q, n=5, 4 flies for DA2m, dLight1.3b.
Average traces (bold) overlaid with single-trial traces (light) from one fly are shown for representation in p, q. Data are presented as the mean ± s.e.m. in c, d, e, f, g, h, i, l, m, p, q, r.
Extended Data Fig. 7. Expressing GRABDA2m or GRABrDA1m sensors shows no significant effect on cAMP or calcium signaling respectively in vivo.
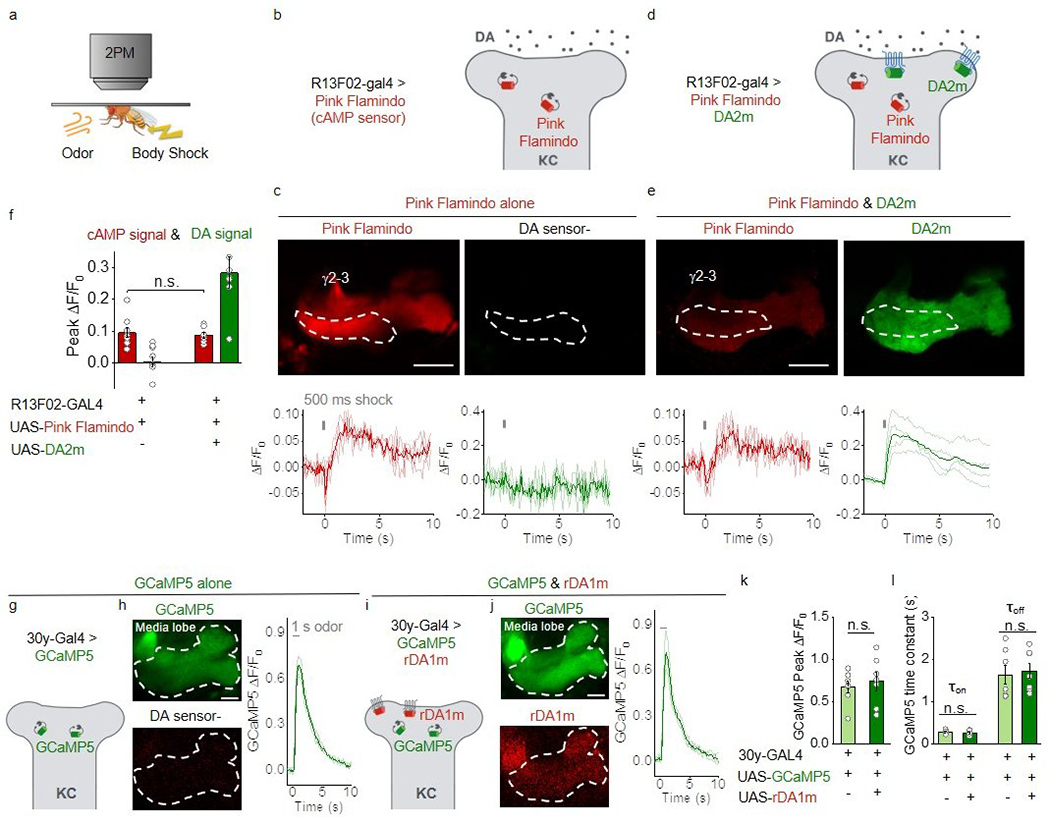
a, Schematic illustration depicting the experimental setup.
b-e, Schematic illustrations depicting the experimental strategy (b,d), representative fluorescence images and ΔF/F0 traces (c,e) in flies expressing the cAMP sensor Pink-Flamindo (b,c) or co-expressing Pink-Flamindo and DA2m (d,e) in MB KCs. The ROIs for measuring the γ2-γ3 compartments in the MB are indicated by dashed white lines. Scale bars, 25 μm.
f, Group summary of peak ΔF/F0. n=9, 7 flies for Pink Flamindo alone, Pink Flamindo & DA2m. Two-tailed Student’s t-test was performed. p= 0.7332 (n.s.).
g-j, Schematic illustrations depicting the experimental strategy (g,i), representative fluorescence images and ΔF/F0 traces (h,j) in flies expressing the calcium sensor GCaMP5 (g,h) or co-expressing GCaMP5 and rDA1m (i,j) in MB KCs. The ROIs for measuring the MB media lobe are indicated by dashed white lines. Similar results were observed for 7 flies. Scale bars, 25 μm.
k,l, Group summary of GCaMP5 peak ΔF/F0 and time constants. n=7 flies each. Two-tailed Student’s t-test was performed. k, p=0.607 (n.s.). l, p=0.601 (n.s.), 0.735 (n.s.) for τon, τoff.
Average traces (bold) overlaid with single-trial traces (light) from one fly are shown for representation in c, e, h, j. Data are presented as the mean ± s.e.m. in f, k, l.
Extended Data Fig. 8. Optogenetically induced nigrostriatal DA release in freely moving mice is not affected by desipramine or yohimbine.
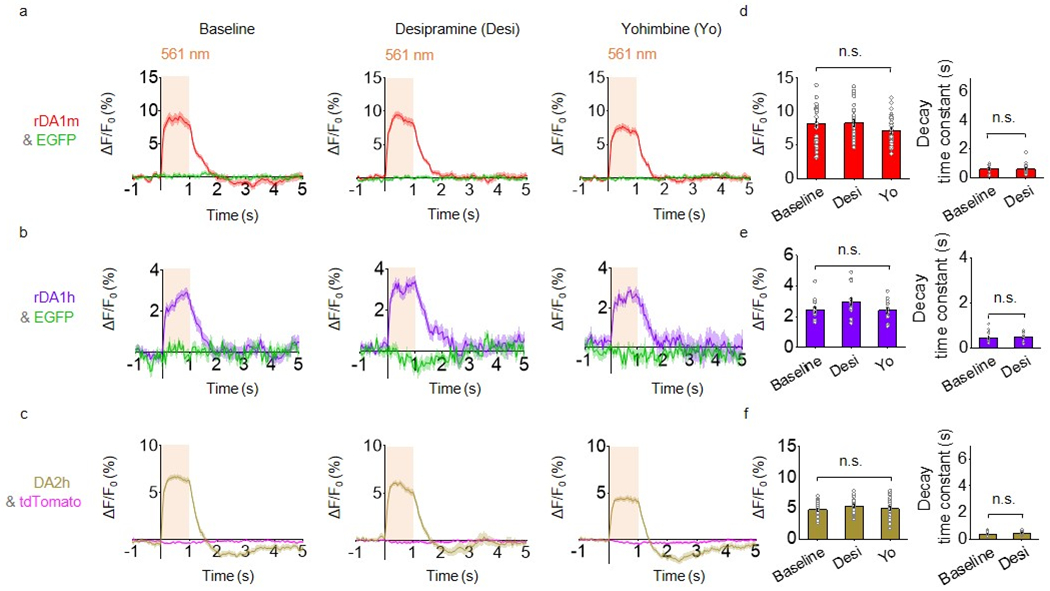
a-c, Average traces of ΔF/F0 in mice expressing rDA1m and EGFP (a), rDA1h and EGFP (b), or DA2h and tdTomato (c) in the dorsal striatum. Where indicated, the experiments were conducted in mice treated with either the norepinephrine transporter blocker desipramine or the α2AR antagonist yohimbine.
d-f, Group summary of ΔF/F0 and τoff for the experiments shown in a-c, respectively. n=30 trials from 6 hemispheres of 6 mice for rDA1m. n=15 trials from 3 hemispheres of 3 mice for rDA1h, n=25 trials from 5 hemispheres of 4 mice for DA2h. Two-tailed Student’s t-test was performed. d, left, p=0.1614 (n.s.); right, p=0.9836 (n.s.). e, left, p=0.9018 (n.s.); right, p=0.6605 (n.s.). f, left, p=0.6489 (n.s.); right, p=0.2322 (n.s.).
Average traces shaded with ± s.e.m. are shown in a-c. Data are presented as the mean ± s.e.m. in d-f.
Extended Data Fig. 9. Dual-color recording of DA dynamics and striatal neural activity using DA2m and jRGECO1a in freely moving mice.
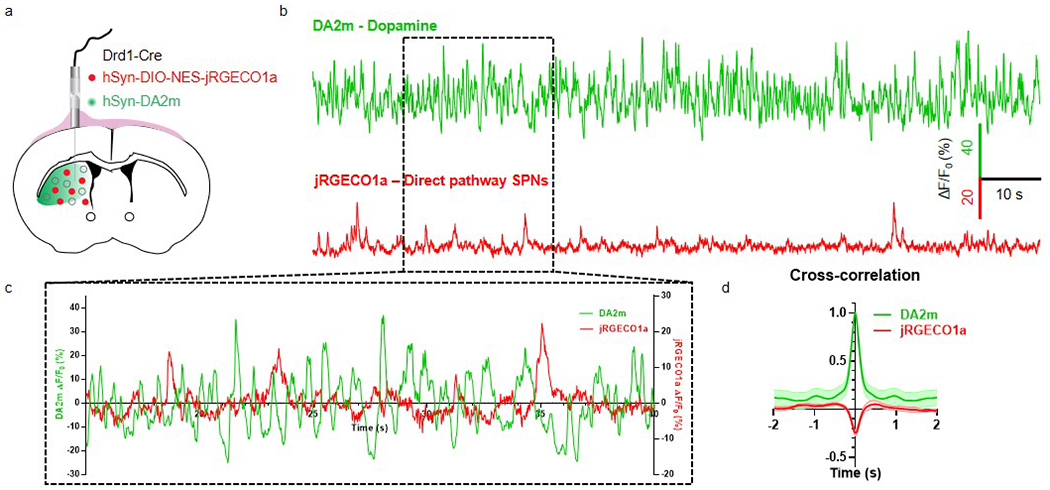
a, Schematic illustration depicting the experimental strategy.
b, Representative traces showing the fluorescence responses of DA2m and jRGECO1a.
c, The zoom-in traces from b during a 25 s recording.
d, The cross-correlation between the fluorescence responses of DA2m and jRGECO1a during a 2 min recording. n=8 hemispheres of 5 mice. Average traces shaded with ± s.e.m. are shown.
Extended Data Fig. 10. The DA signal in the mouse NAc during sexual behavior.
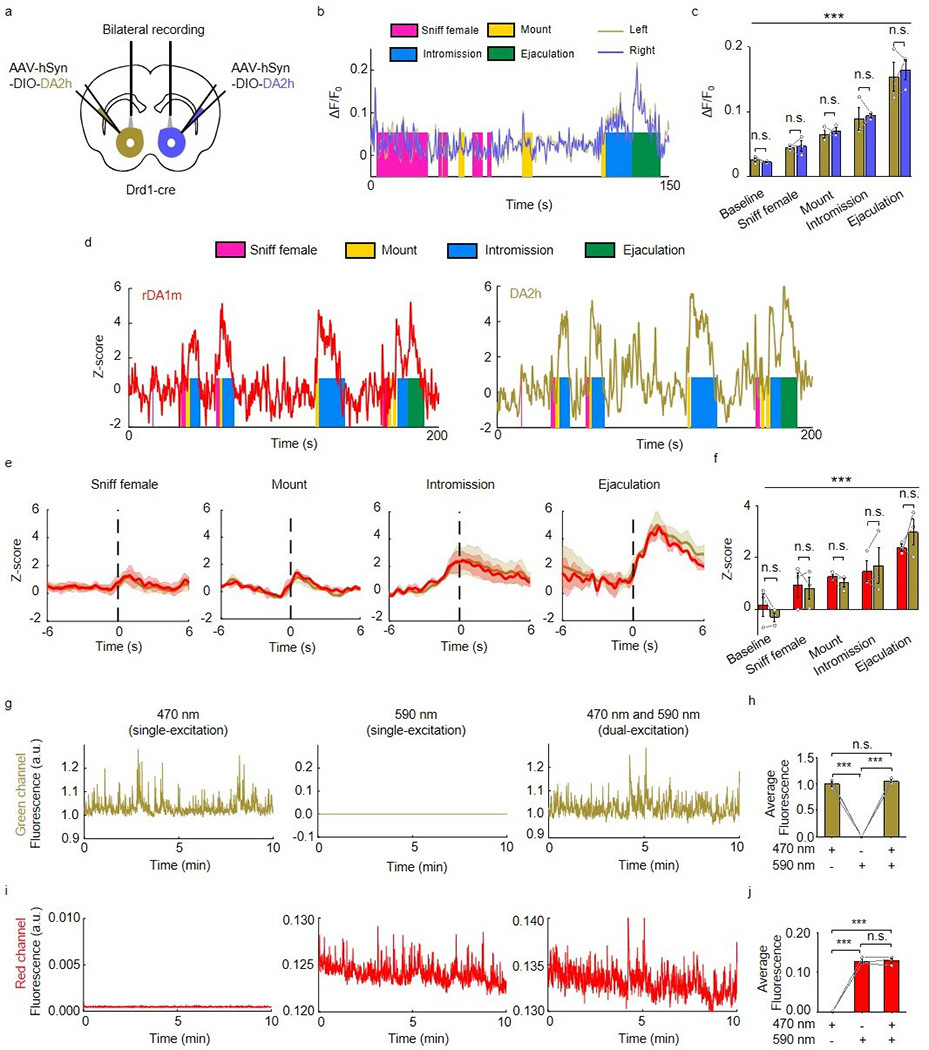
a, Schematic illustration depicting the experimental strategy.
b,c, Representative traces (b) and group summary (c) of ΔF/F0 measured from left and right hemispheres during the indicated stages of mating. n=3 mice. F4,16=80.92, p<10−6 (***) for row factor and F1,4=0.1224, p=0.7441 (n.s.) for column factor by two-way ANOVA. Bonferroni’s multiple comparisons test was performed between groups, p>0.9999 (n.s.), p>0.9999 (n.s.), p>0.9999 (n.s.), p>0.9999 (n.s.), p>0.9999 (n.s.).
d, Representative traces of the concurrent Z-score signals of rDA1m and DA2h during the indicated stages of sexual behavior. Similar results were observed for 3 mice.
e, Average post-stimulus histograms showing the Z-score signals of rDA1m and DA2h aligned to the onset of the indicated mating events. n=3 mice. Average traces shaded with ± s.e.m. are shown.
f, Group summary of the Z-scores measured for rDA1m and DA2h during the indicated mating events. n=3 mice. F4,16=13.02, p=6.6×10⁻⁵ (***) for row factor and F1,4=0.001, p=0.9797 (n.s.) for column factor by two-way ANOVA. Bonferroni’s multiple comparisons test was performed, p>0.99 (n.s.), p>0.99 (n.s.), p>0.99 (n.s.), p>0.99 (n.s.), p>0.99 (n.s.).
g, h, The representative fluorescence signal (g) and group analysis (h) in the green channel when the excitation light is delivered at 470 nm alone (g, left), at 590 nm alone (g, center) or at 470 nm and 590 nm simultaneously (g, right). n=3 mice. F2,4=531.6, p=3.1×10⁻⁵ (***) by one-way ANOVA. Tukey’s multiple comparisons test was performed between groups, p=3.1×10⁻⁵ (***), p=2.6×10⁻⁵ (***), p=0.4904 (n.s.).
i, j, Similar to g and h except the fluorescence signal in the red channel is analyzed. n=3 mice. F2,4=414.2, p=2.3×10⁻⁵ (***) by one-way ANOVA. Tukey’s multiple comparisons test was performed between groups, p=4.8×10⁻⁵ (***), p=4.6×10⁻⁵ (***), p=0.9738 (n.s.).
Data are presented as the mean ± s.e.m. in c, f, h, j.
Supplementary Material
Acknowledgments
This work was supported by the Beijing Municipal Science & Technology Commission (Z181100001318002), the Beijing Brain Initiative of Beijing Municipal Science & Technology Commission (Z181100001518004), Guangdong Grant ‘Key Technologies for Treatment of Brain Disorders’ (2018B030332001), the General Program of National Natural Science Foundation of China (projects 31671118, 31871087, and 31925017), the NIH BRAIN Initiative (NS103558), and grants from the Peking-Tsinghua Center for Life Sciences and the State Key Laboratory of Membrane Biology at Peking University School of Life Sciences to Y.L.; the NIH (grants R01MH101377 and R21HD090563) and an Irma T. Hirschl Career Scientist Award to D.L.; and the Intramural Research Program of the US NIH/NIEHS (1ZIAES103310) to G.C.. We thank Yi Rao for sharing the 2-photon microscope and Xiaoguang Lei at PKU-CLS for providing support for the Opera Phenix high-content screening system.
Footnotes
Competing interests
F.S. and Y. L. have filed patent applications whose value might be affected by this publication.
References
- 1.Björklund A & Dunnett SB Dopamine neuron systems in the brain: an update. Trends in neurosciences 30, 194–202 (2007). [DOI] [PubMed] [Google Scholar]
- 2.Wise RA Dopamine, learning and motivation. Nature reviews neuroscience 5, 483–494 (2004). [DOI] [PubMed] [Google Scholar]
- 3.Klein MO et al. Dopamine: functions, signaling, and association with neurological diseases. Cellular and molecular neurobiology 39, 31–59 (2019). [DOI] [PMC free article] [PubMed] [Google Scholar]
- 4.Tidey JW & Miczek KA Social defeat stress selectively alters mesocorticolimbic dopamine release: an in vivo microdialysis study. Brain research 721, 140–149 (1996). [DOI] [PubMed] [Google Scholar]
- 5.Robinson DL, Venton BJ, Heien ML & Wightman RM Detecting subsecond dopamine release with fast-scan cyclic voltammetry in vivo. Clinical chemistry 49, 1763–1773 (2003). [DOI] [PubMed] [Google Scholar]
- 6.Muller A, Joseph V, Slesinger PA & Kleinfeld D Cell-based reporters reveal in vivo dynamics of dopamine and norepinephrine release in murine cortex. Nature methods 11, 1245 (2014). [DOI] [PMC free article] [PubMed] [Google Scholar]
- 7.Inagaki HK et al. Visualizing neuromodulation in vivo: TANGO-mapping of dopamine signaling reveals appetite control of sugar sensing. Cell 148, 583–595 (2012). [DOI] [PMC free article] [PubMed] [Google Scholar]
- 8.Lee D et al. Temporally precise labeling and control of neuromodulatory circuits in the mammalian brain. Nature methods 14, 495 (2017). [DOI] [PubMed] [Google Scholar]
- 9.Kruss S et al. High-resolution imaging of cellular dopamine efflux using a fluorescent nanosensor array. Proceedings of the National Academy of Sciences 114, 1789–1794 (2017). [DOI] [PMC free article] [PubMed] [Google Scholar]
- 10.Beyene AG et al. Imaging striatal dopamine release using a nongenetically encoded near infrared fluorescent catecholamine nanosensor. Science advances 5, eaaw3108 (2019). [DOI] [PMC free article] [PubMed] [Google Scholar]
- 11.Sun F et al. A Genetically Encoded Fluorescent Sensor Enables Rapid and Specific Detection of Dopamine in Flies, Fish, and Mice. Cell 174, 481–496 e419, doi: 10.1016/j.cell.2018.06.042 (2018). [DOI] [PMC free article] [PubMed] [Google Scholar]
- 12.Patriarchi T et al. Ultrafast neuronal imaging of dopamine dynamics with designed genetically encoded sensors. Science 360, 1420-+, doi:ARTN eaat4422 10.1126/science.aat4422 (2018). [DOI] [PMC free article] [PubMed] [Google Scholar]
- 13.Tanaka M, Sun F, Li Y & Mooney R A mesocortical dopamine circuit enables the cultural transmission of vocal behaviour. Nature 563, 117–120, doi: 10.1038/s41586-018-0636-7 (2018). [DOI] [PMC free article] [PubMed] [Google Scholar]
- 14.Zhou M et al. Suppression of GABAergic neurons through D2-like receptor secures efficient conditioning in Drosophila aversive olfactory learning. Proc Natl Acad Sci U S A 116, 5118–5125, doi: 10.1073/pnas.1812342116 (2019). [DOI] [PMC free article] [PubMed] [Google Scholar]
- 15.Handler A et al. Distinct Dopamine Receptor Pathways Underlie the Temporal Sensitivity of Associative Learning. Cell 178, 60–75 e19, doi: 10.1016/j.cell.2019.05.040 (2019). [DOI] [PMC free article] [PubMed] [Google Scholar]
- 16.Shu X et al. Mammalian expression of infrared fluorescent proteins engineered from a bacterial phytochrome. Science 324, 804–807 (2009). [DOI] [PMC free article] [PubMed] [Google Scholar]
- 17.Alford SC, Wu J, Zhao Y, Campbell RE & Knöpfel T Optogenetic reporters. Biology of the Cell 105, 14–29 (2013). [DOI] [PubMed] [Google Scholar]
- 18.Zhao Y et al. An expanded palette of genetically encoded Ca(2)(+) indicators. Science 333, 1888–1891, doi: 10.1126/science.1208592 (2011). [DOI] [PMC free article] [PubMed] [Google Scholar]
- 19.Bindels DS et al. mScarlet: a bright monomeric red fluorescent protein for cellular imaging. Nat Methods 14, 53–56, doi: 10.1038/nmeth.4074 (2017). [DOI] [PubMed] [Google Scholar]
- 20.Feng S et al. Improved split fluorescent proteins for endogenous protein labeling. Nature communications 8, 1–11 (2017). [DOI] [PMC free article] [PubMed] [Google Scholar]
- 21.Shemiakina II et al. A monomeric red fluorescent protein with low cytotoxicity. Nat Commun 3, 1204, doi: 10.1038/ncomms2208 (2012). [DOI] [PubMed] [Google Scholar]
- 22.Sung YM, Wilkins AD, Rodriguez GJ, Wensel TG & Lichtarge O Intramolecular allosteric communication in dopamine D2 receptor revealed by evolutionary amino acid covariation. Proc Natl Acad Sci U S A 113, 3539–3544, doi: 10.1073/pnas.1516579113 (2016). [DOI] [PMC free article] [PubMed] [Google Scholar]
- 23.Chien EY et al. Structure of the human dopamine D3 receptor in complex with a D2/D3 selective antagonist. Science 330, 1091–1095 (2010). [DOI] [PMC free article] [PubMed] [Google Scholar]
- 24.Wu J et al. Improved orange and red Ca(2)+/− indicators and photophysical considerations for optogenetic applications. ACS Chem Neurosci 4, 963–972, doi: 10.1021/cn400012b (2013). [DOI] [PMC free article] [PubMed] [Google Scholar]
- 25.Dana H et al. Sensitive red protein calcium indicators for imaging neural activity. Elife 5, doi: 10.7554/eLife.12727 (2016). [DOI] [PMC free article] [PubMed] [Google Scholar]
- 26.Pedelacq JD, Cabantous S, Tran T, Terwilliger TC & Waldo GS Engineering and characterization of a superfolder green fluorescent protein. Nat Biotechnol 24, 79–88, doi: 10.1038/nbt1172 (2006). [DOI] [PubMed] [Google Scholar]
- 27.St-Pierre F et al. High-fidelity optical reporting of neuronal electrical activity with an ultrafast fluorescent voltage sensor. Nat Neurosci 17, 884–889, doi: 10.1038/nn.3709 (2014). [DOI] [PMC free article] [PubMed] [Google Scholar]
- 28.Bajar BT et al. Improving brightness and photostability of green and red fluorescent proteins for live cell imaging and FRET reporting. Sci Rep 6, 20889, doi: 10.1038/srep20889 (2016). [DOI] [PMC free article] [PubMed] [Google Scholar]
- 29.Baird GS, Zacharias DA & Tsien RY Circular permutation and receptor insertion within green fluorescent proteins. Proceedings of the National Academy of Sciences 96, 11241–11246 (1999). [DOI] [PMC free article] [PubMed] [Google Scholar]
- 30.Wan Q et al. Mini G protein probes for active G protein–coupled receptors (GPCRs) in live cells. Journal of Biological Chemistry 293, 7466–7473 (2018). [DOI] [PMC free article] [PubMed] [Google Scholar]
- 31.Kroeze WK et al. PRESTO-Tango as an open-source resource for interrogation of the druggable human GPCRome. Nature structural & molecular biology 22, 362 (2015). [DOI] [PMC free article] [PubMed] [Google Scholar]
- 32.Broussard GJ et al. In vivo measurement of afferent activity with axon-specific calcium imaging. Nat Neurosci 21, 1272–1280, doi: 10.1038/s41593-018-0211-4 (2018). [DOI] [PMC free article] [PubMed] [Google Scholar]
- 33.Schwaerzel M et al. Dopamine and octopamine differentiate between aversive and appetitive olfactory memories in Drosophila. Journal of Neuroscience 23, 10495–10502 (2003). [DOI] [PMC free article] [PubMed] [Google Scholar]
- 34.Kim Y-C, Lee H-G & Han K-A D1 dopamine receptor dDA1 is required in the mushroom body neurons for aversive and appetitive learning in Drosophila. Journal of Neuroscience 27, 7640–7647 (2007). [DOI] [PMC free article] [PubMed] [Google Scholar]
- 35.Schroll C et al. Light-induced activation of distinct modulatory neurons triggers appetitive or aversive learning in Drosophila larvae. Current biology 16, 1741–1747 (2006). [DOI] [PubMed] [Google Scholar]
- 36.Claridge-Chang A et al. Writing memories with light-addressable reinforcement circuitry. Cell 139, 405–415 (2009). [DOI] [PMC free article] [PubMed] [Google Scholar]
- 37.Tanaka NK, Tanimoto H & Ito K Neuronal assemblies of the Drosophila mushroom body. Journal of Comparative Neurology 508, 711–755 (2008). [DOI] [PubMed] [Google Scholar]
- 38.Mao Z & Davis RL Eight different types of dopaminergic neurons innervate the Drosophila mushroom body neuropil: anatomical and physiological heterogeneity. Frontiers in neural circuits 3, 5 (2009). [DOI] [PMC free article] [PubMed] [Google Scholar]
- 39.Aso Y et al. The neuronal architecture of the mushroom body provides a logic for associative learning. elife 3, e04577 (2014). [DOI] [PMC free article] [PubMed] [Google Scholar]
- 40.Klapoetke NC et al. Independent optical excitation of distinct neural populations. Nature methods 11, 338 (2014). [DOI] [PMC free article] [PubMed] [Google Scholar]
- 41.Harada K et al. Red fluorescent protein-based cAMP indicator applicable to optogenetics and in vivo imaging. Scientific reports 7, 1–9 (2017). [DOI] [PMC free article] [PubMed] [Google Scholar]
- 42.Akerboom J et al. Optimization of a GCaMP calcium indicator for neural activity imaging. Journal of neuroscience 32, 13819–13840 (2012). [DOI] [PMC free article] [PubMed] [Google Scholar]
- 43.Yizhar O et al. Neocortical excitation/inhibition balance in information processing and social dysfunction. Nature 477, 171–178 (2011). [DOI] [PMC free article] [PubMed] [Google Scholar]
- 44.Sugamori KS, Demchyshyn LL, McConkey F, Forte MA & Niznik HB A primordial dopamine D1-like adenylyl cyclase-linked receptor from Drosophila melanogaster displaying poor affinity for benzazepines. FEBS letters 362, 131–138 (1995). [DOI] [PubMed] [Google Scholar]
- 45.Himmelreich S et al. Dopamine receptor DAMB signals via Gq to mediate forgetting in Drosophila. Cell reports 21, 2074–2081 (2017). [DOI] [PMC free article] [PubMed] [Google Scholar]
- 46.Jing M et al. A genetically encoded fluorescent acetylcholine indicator for in vitro and in vivo studies. Nat Biotechnol 36, 726–737, doi: 10.1038/nbt.4184 (2018). [DOI] [PMC free article] [PubMed] [Google Scholar]
- 47.Jing M et al. An optimized acetylcholine sensor for monitoring in vivo cholinergic activity. Nat Methods. in press (2020). [DOI] [PMC free article] [PubMed] [Google Scholar]
- 48.Feng J et al. A Genetically Encoded Fluorescent Sensor for Rapid and Specific In Vivo Detection of Norepinephrine. Neuron 102, 745–761 e748, doi: 10.1016/j.neuron.2019.02.037 (2019). [DOI] [PMC free article] [PubMed] [Google Scholar]
- 49.Deng B et al. Chemoconnectomics: mapping chemical transmission in Drosophila. Neuron 101, 876–893.e874 (2019). [DOI] [PubMed] [Google Scholar]
- 50.Gibson DG et al. Enzymatic assembly of DNA molecules up to several hundred kilobases. Nat Methods 6, 343–345, doi: 10.1038/nmeth.1318 (2009). [DOI] [PubMed] [Google Scholar]
- 51.Yusa K, Zhou L, Li MA, Bradley A & Craig NL A hyperactive piggyBac transposase for mammalian applications. Proceedings of the National Academy of Sciences 108, 1531–1536 (2011). [DOI] [PMC free article] [PubMed] [Google Scholar]
- 52.Meng C et al. Spectrally resolved fiber photometry for multi-component analysis of brain circuits. Neuron 98, 707–717.e704 (2018). [DOI] [PMC free article] [PubMed] [Google Scholar]
- 53.Hull EM, Meisel RL & Sachs BD in Hormones, brain and behavior 3–137 (Elsevier, 2002). [Google Scholar]
- 54.Ballesteros JA & Weinstein H in Methods in neurosciences Vol. 25 366–428 (Elsevier, 1995). [Google Scholar]
Associated Data
This section collects any data citations, data availability statements, or supplementary materials included in this article.
Supplementary Materials
Data Availability Statement
Plasmids for expressing the sensors used in this study and the sequences were available from Addgene (https://www.addgene.org/Yulong_Li/, cat. numbers 140553, 140554, 140555, 140556, 140557, 140558). Source data for Figures 1–6 and Extended Data Figures 1 and 3–10 are provided with this paper.


