Humans families carrying mutations in transcription factor AP-2β (TFAP2B) self-reported sleep abnormalities. Notably, AP-2 transcription factors play essential roles in invertebrate sleep, implicating a conserved role across the animal phyla. Nakai et al. generated two .....
Keywords: Char syndrome, mouse, sleep, transcription factor
Abstract
The molecular mechanism regulating sleep largely remains to be elucidated. In humans, families that carry mutations in TFAP2B, which encodes the transcription factor AP-2β, self-reported sleep abnormalities such as short-sleep and parasomnia. Notably, AP-2 transcription factors play essential roles in sleep regulation in the nematode Caenorhabditis elegans and the fruit fly Drosophila melanogaster. Thus, AP-2 transcription factors might have a conserved role in sleep regulation across the animal phyla. However, direct evidence supporting the involvement of TFAP2B in mammalian sleep was lacking. In this study, by using the CRISPR/Cas9 technology, we generated two Tfap2b mutant mouse strains, Tfap2bK144 and Tfap2bK145, each harboring a single-nucleotide mutation within the introns of Tfap2b mimicking the mutations in two human kindreds that self-reported sleep abnormalities. The effects of these mutations were compared with those of a Tfap2b knockout allele (Tfap2b–). The protein expression level of TFAP2B in the embryonic brain was reduced to about half in Tfap2b+/− mice and was further reduced in Tfap2b−/− mice. By contrast, the protein expression level was normal in Tfap2bK145/+ mice but was reduced in Tfap2bK145/K145 mice to a similar extent as Tfap2b−/− mice. Tfap2bK144/+ and Tfap2bK144/K144 showed normal protein expression levels. Tfap2b+/− female mice showed increased wakefulness time and decreased nonrapid eye movement sleep (NREMS) time. By contrast, Tfap2bK145/+ female mice showed an apparently normal amount of sleep but instead exhibited fragmented NREMS, whereas Tfap2bK144/+ male mice showed reduced NREMS time specifically in the dark phase. Finally, in the adult brain, Tfap2b-LacZ expression was detected in the superior colliculus, locus coeruleus, cerebellum, and the nucleus of solitary tract. These findings provide direct evidence that TFAP2B influences NREMS amounts in mice and also show that different mutations in Tfap2b can lead to diverse effects on sleep architecture.
SLEEP is a physiological state widely observed in animals. However, the molecular pathways involved in regulating sleep, and to what the extent they are conserved among vertebrates and invertebrates, remain largely unknown. In humans, natural short sleepers exhibit a reduced amount of time in sleep without reporting daytime fatigue [reviewed in Shi et al. (2017)]. In cases where the natural short sleep trait is hereditary, it is expected that the identification of the causal gene might lead to the understanding of the molecules that control sleepiness. In addition, recent studies using invertebrate animal models suggest that sleep-regulatory mechanisms are at least partly conserved at the molecular level between vertebrates and invertebrates [reviewed in (Miyazaki et al. 2017)]. For example, a gain-of-function mutation in the salt-inducible kinase three leads to a drastic increase in the amount of nonrapid eye movement sleep (NREMS) in mice, whereas its ortholog in the nematode Caenorhabditis elegans promotes developmentally timed sleep and the ortholog in the fruit fly Drosophila melanogaster promotes total sleep (Funato et al. 2016). Thus, studies using invertebrate animal models are also expected to lead to the identification of key molecules that contribute to sleep regulation across animal phyla.
In this study, we focused on the transcription factor AP-2β (TFAP2B). TFAP2B is a member of the AP-2 transcription factor family, which is involved in diverse processes including cell proliferation, differentiation, and apoptosis at both developmental and mature stages [reviewed in Eckert et al. (2005)]. In mice, Tfap2b knockout pups die shortly after birth due to renal failure (Moser et al. 1997, 2003). Tfap2b is also crucial for limb formation and differentiation of several neuronal cells (Seok et al. 2008; Jin et al. 2015; Seki et al. 2015). In humans, mutations in TFAP2B lead to Char syndrome (MIM 169100) (Satoda et al. 2000). Char syndrome is a congenital disease characterized by patent ductus arteriosus, facial dysmorphism, and hand anomalies (Davidson 1993). Notably, two human kindreds with Char syndrome, kindred 144 and 145, self-reported abnormalities in sleep, namely parasomnia (sleep-walking) and short-sleep, respectively (Mani et al. 2005). The two kindreds harbor a mutation in the introns of TFAP2B, thus implying the involvement of TFAP2B in sleep regulation.
Moreover, in the nematode Caenorhabditis elegans, the ortholog APTF-1 is crucial for specification of the sleep-promoting neuron RIS, and aptf-1 mutants exhibit severely reduced quiescence during both developmentally timed sleep and stress-induced sleep (Turek et al. 2013, 2016; Konietzka et al. 2020). In addition, in the fruit fly Drosophila melanogaster, knockdown of neuronal TFAP-2 results in reduced night-time sleep (Kucherenko et al. 2016). These findings, in combination with recent studies supporting that the molecular mechanisms of sleep are conserved between mammals and invertebrates, suggest that mammalian TFAP2B is involved in sleep regulation. However, in case of mammals, conclusive evidence was lacking because the direct effect of mutating this gene was unknown. In this study, we tested whether sleep is affected in mice deficient for Tfap2b. Furthermore, considering that the human kindreds 144 and 145 self-reported totally different sleep abnormalities, we generated two mutant mouse strains, each carrying a mutation in Tfap2b that mimicked the mutation in the human kindreds 144 and 145 by utilizing CRISPR/Cas9 genome editing, and examined their effects on sleep architecture.
Methods
Animals
All animal experiments were approved by the institutional animal care and use committee of the University of Tsukuba. All animals were maintained according to the institutional guidelines of the animal facilities of the Laboratory of Animal Resource Center, University of Tsukuba. Mice were maintained and bred in International Institute for Integrative Sleep Medicine under 12-hr light/dark cycle and free access to food and water. Male and female mice of 10–13 weeks of age were used for sleep analyses.
To obtain Tfap2b+/− mice, Tfap2btm1a(EUCOMM)Wtsi/+ mice from KOMP (Knockout Mouse Project) (Skarnes et al. 2011) were crossed with mice carrying the Ayu1-cre allele (Niwa et al. 1993) to remove a genomic DNA fragment containing Tfap2b exon3 and a neomycin resistant cassette flanked by loxP. The Tfap2btm1a(EUCOMM)Wtsi allele contains an IRES:lacZ trapping cassette with Engrailed (En2) splice acceptor sequences immediately after Tfap2b exon2 and is followed by a poly-A transcription termination signals. F1 offspring were then maintained by crossing with C57BL/6J mice.
Generation of Tfap2bK144 and Tfap2bK145 mice by CRISPR/Cas9 technology
The Tfap2bK144 point mutation (c.601+5G > A) and the Tfap2bK145 point mutation (c.822-1G > C) were introduced to the mouse genome by CRISPR/Cas9 technology as previously reported with some modifications (Sato et al. 2018). The guide RNA (gRNA) was synthesized and purified using the GeneArt Precision gRNA Synthesis Kit (ThermoFisher). The sequences of the gRNA were 5′-GTCAGTCATTAAAAAAGGTA-3′ for Tfap2bK144 and 5′-TTTTCGATTTGGCTCTGCAG-3′ for Tfap2bK145. The donor oligonucleotides for Tfap2bK144 and Tfap2bK145 were both 101 bases (Integrated DNA Technologies), in which the desired point mutations were introduced. Pregnant mare serum gonadotropin and human chorionic gonadotropin were injected intraperitoneally into female C57BL/6J mice (Charles River Laboratories), and unfertilized oocytes were collected from their oviducts. We then performed in vitro fertilization with these oocytes and sperm from male C57BL/6J mice. The gRNA, donor oligonucleotide, and GeneArt Platinum Cas9 Nuclease (ThermoFisher) were electroporated into zygotes using a NEPA 21 electroporator (NEPAGNENE). After electroporation, embryos developed to the two-cell stage in KSOM-AA medium. The next day, the electroporated two-cell embryos were transferred into pseudopregnant ICR mice. We amplified the genomic region including the target sites and PAM sequence by PCR with the following primers, and confirmed the insertion of the desired mutation and the absence of additional mutations. Tfap2bK144: 5′-AAAACCTCCATTTGTGGGTTAAT-3′ and 5′-TGCCAGTGTTGCTCTGATCT-3′; Tfap2bK145: 5′- TCTGGATCCACTGCCCTAAC-3′ and 5′- CACTCATAAGGGCACAGCAA-3′. F0 mice were mated with WT C57BL/6J mice for at least four generations before sleep recording.
Genotyping
Genotyping of Tfap2b+/− mice was performed using the following primers: 5′-GACATCCTACAATGCACAGCT-3′, 5′-CAACGGGTTCTTCTGTTAGTCC-3′, and 5′-TTGCTGTGAGCTAAGAGCTTC-3′ (WT: 381 bp, Tfap2b– mutant: 529 bp). For routine genotyping of Tfap2bK145 and Tfap2bK144, we applied the dCAPS method using the following combinations of primer pairs and restriction enzymes.
Tfap2bK144: 5′-AAAACCTCCATTTGTGGGTTAAT-3′ and 5′-AGACATTGAAATCTTTGCTTACTTTTGGAAGAAAGGATC-3′ followed by digestion by BamHI to specifically digest the WT allele (WT: 183 bp, Tfap2bK144 mutant: 223 bp).
Tfap2bK145: 5′-GAATGTTAATTCTCACCAGTGCA-3′ and 5′-CACTCATAAGGGCACAGCAA-3′ followed by digestion by ApaLI to specifically digest the mutant allele (WT: 266 bp, Tfap2bK145 mutant: 247 bp).
Reverse transcription-PCR
Brains of mouse embryos were harvested 18 days after detection of vaginal plugs (embryonic period 18.5; E18.5). Each brain was divided in half at the midline and frozen with liquid nitrogen. Samples of brains mixed sex were used. Total RNA was extracted from the samples using TRIzol reagent (ThermoFisher). Genomic DNA was digested and reverse transcription (RT) was performed with oligo-dT and random primers using QuantiTect Reverse Transcription Kit (Qiagen). RT-PCR was performed using the following primers: Tfap2b: 5′-CGACAGCCTCTCGTTGCA-3′ and 5′-TGCTGTCTGTTCAAATACTCGGA-3′ (WT: 543 bp, Tfap2bK144: 543 bp, Tfap2bK145 long: 541 bp, Tfap2bK145 short: 424 bp). Rlp23: 5′-TTCCGGTCGGAGCTGTGAT-3′ and 5′-CTGCTGGATGTACCTTTTTCCTT (WT: 180 bp). PCR products were purified and subjected to direct sequencing. For Tfap2bK145/K145, which resulted in PCR products of two different sizes, each product was purified by gel extraction.
Western blot
Western blot was done as previously reported with some modifications (Funato et al. 2016). The brain samples were harvested from E18.5 mouse similar to RT-PCR. Tissues were homogenized in ice-cold lysis buffer [20 mM HEPES, pH 7.5, 100 mM NaCl, 10 mM Na4P2O7, 1.5% Triton X-100, 15 mM NaF, 1× PhosSTOP (Roche), 5 mM EDTA, 1× protease inhibitor (Roche)], and then centrifuged at 14,000 rpm at 4°. The supernatant were adjusted for 2.5 μg/μl by SDS sample buffer then boiled 95° 5 min and stocked at −30°. The samples were boiled at 95° for 5 min and then separated by SDS-PAGE and transferred on PVDF membrane. Primary antibody was 1/500 rabbit anti TFAP2B (Atlas Antibodies; Cat. No. HPA034683) dissolved in 5% skim milk TBST. Second antibody was 1/5000 rabbit anti HRP (Jackson ImmunoReserarch; Cat. No. 711-035-152) or 1/2000 rabbit anti HRP (Abcam; Cat. No. ab7083) dissolved in 5% skim milk TBST. Clarity Western ECL Substrate (Bio-Rad, Hercules, CA) or Chemi-Lumi One Super (Nacalai Tesque) were used to develop chemiluminescence. The illumination was detected by fusion SOLO5 (Vilber-Lourmat). Then, antibodies were striped by incubating WB Striping Solution Strong (Nacalai Tesque). For detecting β-tubulin as an internal control, rabbit anti β-tubulin (CST; Cat. No. 2128) dissolved in 5% BSA TBST and rabbit anti HRP were used as primary and secondary antibody.
Sleep recording
Electroencephalogram (EEG) and electromyogram (EMG) signals were recorded from freely moving mice at the age of 10–13 weeks following a previous study (Hayashi et al. 2015) with some modifications. Briefly, under isoflurane anesthesia (3% induction, 1.5–3% maintenance), mice were placed in a stereotaxic apparatus (David Kopf Instruments). Stainless EEG electrodes were implanted epidurally over the cerebellum and the parietal cortex, and EMG electrodes were embedded into the trapezius muscles bilaterally. At least 4 days after surgery, mice were introduced to the sleep recording apparatus and habituated for at least 5 days. Subsequently, EEG/EMG signals were recorded from the onset of the light phase. EEG/EMG signals were filtered (band pass 0.5–64 Hz or 0.5–250 Hz), collected and digitized at a sampling rate of 128 or 512 Hz using VitalRecorder (Kissei Comtec).
Sleep analysis
EEG/EMG data were divided into 4-s epochs and EEG data were further subjected to fast Fourier transform analysis using SleepSign (Kissei Comtec). The vigilance state in each epoch was manually classified as rapid eye movement sleep (REMS), NREMS, or wake based on absolute delta (0.5–4 Hz) power, theta (6–10 Hz) power to delta power ratio, and the integral of EMG signals. If a single epoch contained multiple states, the state with the highest occupancy was assigned. The EEG power spectrum of each state was calculated and normalized by EEG power at 16–30 Hz averaged across 24 hr (Honda et al. 2018). Epochs that either contained multiple stages or presumable large movement-derived artifacts in the EEG data were included in the stage analysis but were excluded from the EEG power spectrum analysis. In addition, only the EEG/EMG data that were collected at 512 Hz were included in the EEG power spectrum analyses.
X-gal staining
Deeply anesthetized mice were killed by injecting lethal doses of anesthetics and underwent transcardial perfusion with 0.1 M PBS followed by 4% paraformaldehyde (w/v) in 0.1 M PBS. The brains were postfixed in the same fixative for 2 hr and subsequently equilibrated in 30% sucrose (w/v) in PBS. The brains were sectioned at 40 μm using a sliding microtome (Yamato Kohki). After washing with PBS, the sections were incubated in 5-bromo-4-chloro-3-indolyl-β-d-galactopyranoside (X-gal) staining solution [0.05% X-gal, 1 mM MgCl2, 3 mM K4Fe(CN)6, 3 mM K3Fe(CN)6, and 0.1% Triton X-100 in PBS] at 37°.
Statistics
The experimenter was blinded to the genotype during sleep scoring. All statistical analyses were performed using Prism8 (GraphPad), and statistical significance was set at P < 0.05. Where applicable, all statistical tests were two-tailed.
Data availability
The authors state that all data necessary for confirming the conclusions presented in the article are represented fully within the article. Further information and requests for reagents should be directed to and will be fulfilled by the corresponding author. Supplemental material available at figshare: https://doi.org/10.25386/genetics.12904568.
Results
Generation of Tfap2b mutant mice that mimic human kindred 144 and 145
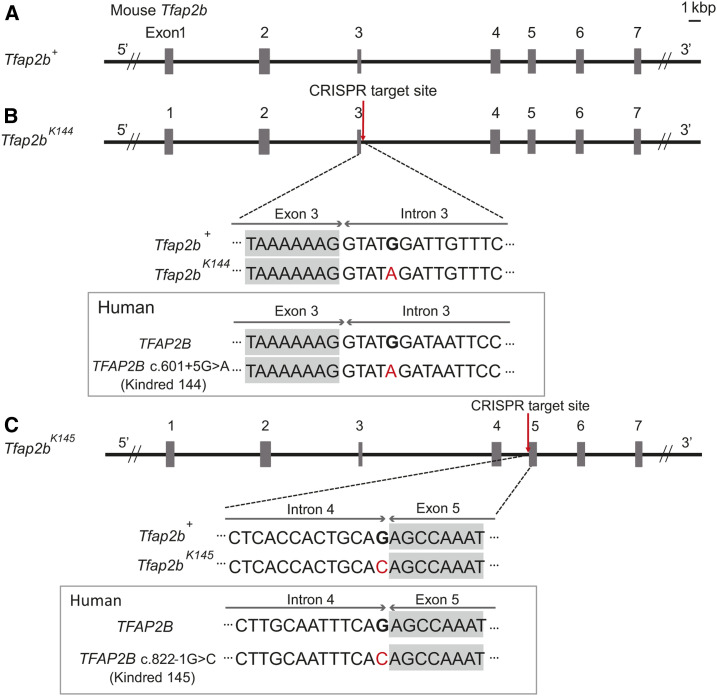
We aimed to generate mice that carry mutations in Tfap2b (MGI:104672), which mimic the mutations in the human kindreds 144 and 145. In kindred 144, a single base substitution (G to A) at position +5 of the splice donor site of intron three was detected (TFAP2B c.601+5G > A), whereas in kindred 145, a single base substitution (G to C) in the splice acceptor site of intron four immediately before exon 5 (TFAP2B c.822-1G > C) was detected (Figure 1, A–C) (Mani et al. 2005). The genomic DNA sequences around both sites were highly conserved between human and mice (Figure 1, B and C). Using the CRISPR/Cas9 system, we introduced point mutations in mice that each correspond to the mutations in human kindred 144 and 145 (hereafter, Tfap2bK144 and Tfap2bK145, respectively) (Figure 1, B and C). The genomic DNA sequences around the targeted sites in Tfap2bK144 and Tfap2bK145 were further confirmed by direct sequencing, and derived cleaved amplified polymorphic sequences (dCAPS) was applied for genotyping of the Tfap2b alleles (Supplemental Material, Fig. S1, A–D).
Figure 1.
Schematic diagram of the two mutant Tfap2b alleles, Tfap2bK144, and Tfap2bK145 generated in this study. (A–C) Genomic structure around Tfap2b in WT (A), Tfap2bK144 (B), and Tfap2bK145 (C) and comparison of the DNA sequence around the mutation between mouse and human.
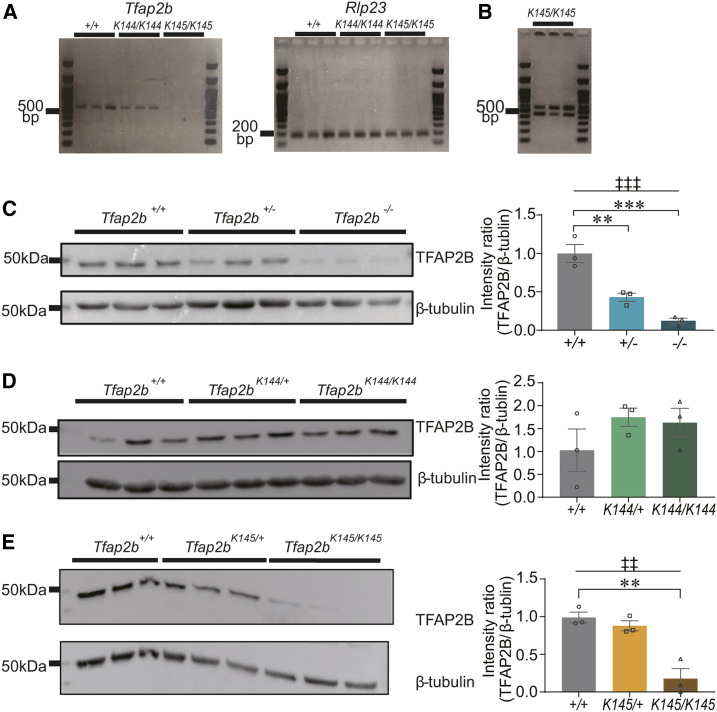
We checked the effects of these mutations on the Tfap2b mRNA sequence around exon 3–5, where abnormal splicing due to these mutations are predicted to occur by RT-PCR (Figure 2A) and direct sequencing (Figure S2). Considering that homozygous Tfap2b KO mice die shortly after birth (Moser et al. 1997), brain samples were collected from the embryos just before birth (embryonic period 18.5; E18.5). As a result, we did not detect any abnormal splicing in Tfap2bK144/K144 mice (Figure 2A and Figure S2). By contrast, Tfap2bK145/K145 mice showed very low expression level of Tfap2b mRNA (Figure 2A), and mRNAs of two different lengths were detected (Figure 2B). In the longer mRNA, two nucleotides at the 5′-end of exon 5 was deleted. In the shorter mRNA, exon 5 was completely deleted (Figure S2), likely due to exon skipping. Both variants of Tfap2b mRNA in Tfap2bK145/K145 mice are predicted to lead to a frame shift (Figure S2).
Figure 2.
RT-PCR and Western blot analyses of Tfap2b mutant mice. (A) Results of RT-PCR using total RNA from whole brain samples of Tfap2b+/+, Tfap2bK144/K144, and Tfap2bK145/K145 mice at E18.5. For RT-PCR of Tfap2b mRNA, primers that flank exons 3–5 were used. (B) Increasing amplification cycles of Tfap2b RT-PCR inTfap2bK145/K145 mice resulted in two products of different size. Each lane represents an individual mouse. N = 3 mice. (C–E) Results of Western blot using an anti-TFAP2B antibody applied to whole brain samples from mice at E18.5 harboring Tfap2b– (C), Tfap2bK144 (D), or Tfap2bK145 (E). Each lane represents an individual mouse. N = 3 mice. † indicates significance in one-way ANOVA (‡‡P < 0.01, ‡‡‡P < 0.001). * indicates significance in post hoc Dunnet’s test (**P < 0.01, ***P < 0.001). Data are mean ± SEM.
Next, we checked the effects of these mutations on the TFAP2B protein expression level and molecular weight by Western blot using an antibody that recognizes TFAP2B at the region encoded in exon 2. Similar to the above RT-PCR, brain samples were collected from the embryos just before birth (E18.5).We also applied a Tfap2b KO allele (Tfap2b–) (Skarnes et al. 2011) to the analysis. The protein expression level was reduced to about half in Tfap2b+/− mice and was further reduced in Tfap2b−/− mice (Figure 2C). Although exon 1 and exon 2 are intact in Tfap2b–, no additional bands were detected in samples derived from Tfap2b+/− or Tfap2b−/− mice, suggesting that the expression level of the truncated TFAP2B protein is very low, if any (Figure S3A). By contrast, we could not detect any effects in Tfap2b K144/+ and Tfap2bK144/K144 mice (Figure 2D and Figure S3B). Concerning the Tfap2b K145 allele, while no obvious effects were detected inTfap2bK145/+ mice, Tfap2bK145/K145 mice exhibited a significant decrease in the protein expression level that was comparable to Tfap2b−/− mice (Figure 2E). Consistently, we never obtained Tfap2bK145/K145 pups, suggesting that they are lethal. Similar to the other Tfap2b alleles, we could not detect any additional bands produced by the Tfap2bK145 allele (Figure S3C).
Tfap2b+/− female mice show increased wakefulness and decreased NREMS
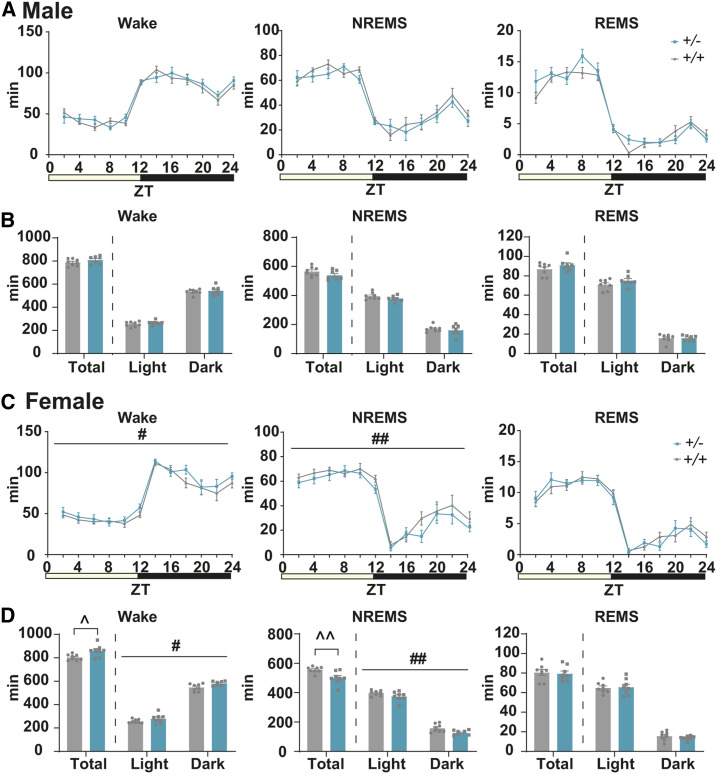
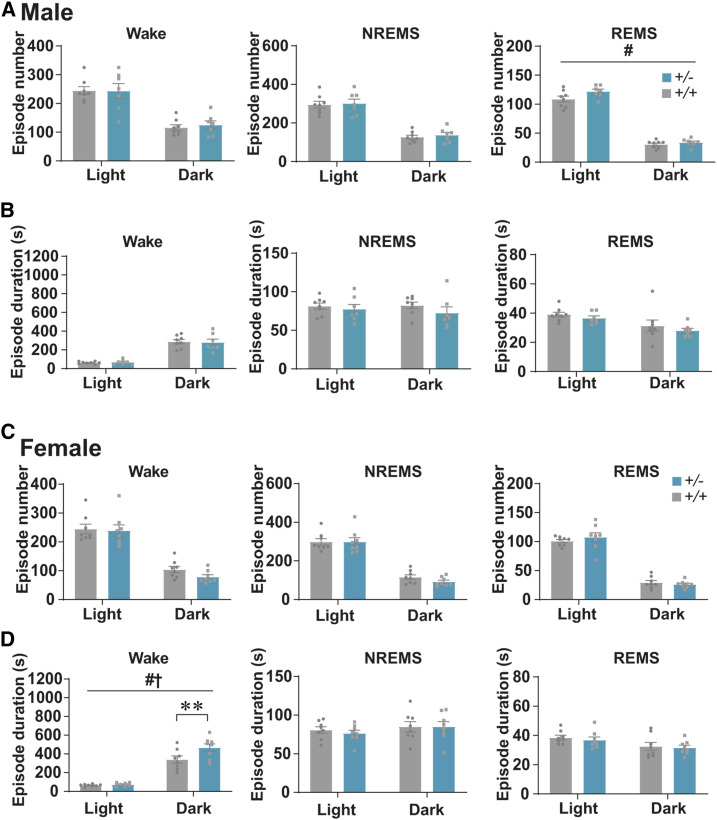
To test the involvement of Tfap2b in sleep regulation, we first compared the sleep architecture between WT and Tfap2b+/− mice. The total time spent in wakefulness, NREMS, or REMS was not significantly different between male WT and Tfap2b+/− littermates (Figure 3, A and B). The duration and number of episodes of wakefulness and NREMS were not significantly altered either (Figure 4, A and B). The episode number of REMS was slightly increased (Figure 4A).
Figure 3.
Comparison of the amount of sleep/wake in adult Tfap2b+/+ and Tfap2b+/− mice. (A) Bihourly amount of wakefulness, NREMS, and REMS across 24 hr in male mice. (B) Total amount of wakefulness, NREMS, and REMS during 24 hr, light phase, and dark phase in male mice. N = 8 Tfap2b+/+ mice, N = 7 Tfap2b+/− mice. (C) Bihourly amount of wakefulness, NREMS, and REMS across 24 hr in female mice. (D) Total amount of wakefulness, NREMS, and REMS during 24 hr, light phase, and dark phase in female mice. N = 8 Tfap2b+/+ mice, N = 8 Tfap2b+/− mice. # indicates significant main effect of genotype in two-way repeated-measures ANOVA (#P < 0.05, ##P < 0.01). ^ indicates significance in the Welch’s test (^P < 0.05, ^^P < 0.01). Data are mean ± SEM.
Figure 4.
Comparison of the numbers and durations of sleep/wake episodes in adult Tfap2b+/+ and Tfap2b+/− mice. (A, B) Episode numbers (A) and durations (B) of wakefulness, NREMS, and REMS during 24 hr, light phase, and dark phase in male mice. N = 8 Tfap2b+/+ mice, N = 7 Tfap2b+/− mice. (C, D) Episode numbers (C) and durations (D) of wakefulness, NREMS, and REMS during 24 hr, light phase, and dark phase in female mice. N = 8 Tfap2b+/+ mice, N = 8 Tfap2b+/− mice. # and † indicate significant main effect of genotype and significant interaction between genotype and light/dark phase, respectively, in two-way repeated-measures ANOVA (#,†P < 0.05). * indicates significance in post hoc Bonferroni multiple comparison test (**P < 0.01). Data are mean ± SEM.
By contrast, when we compared sleep between female WT and Tfap2b+/− littermates, total time spent in wakefulness was increased and NREMS was decreased (Figure 3D). REMS was not significantly different (Figure 3D). When light and dark phases were separately analyzed, we did not detect any interaction between time of the day and the amount of wakefulness or NREMS, but a main effect of genotype was detected, suggesting that the amount of wakefulness and NREMS are affected across the whole day in female Tfap2b+/− mice (Figure 3, C and D). Episode analyses revealed that the duration of wakefulness was increased in the dark phase, which might partly account for the increased amount of wakefulness (Figure 4D). The duration and number of episodes of REMS and NREMS were not significantly altered (Figure 4, C and D). When the EEG power spectrum in each stage across 24 hr and the bihourly changes in delta density during NREMS were analyzed, female Tfap2b+/− mice showed a trend for decreased delta power during NREMS, although not significant (Figure S4B and Figure S7D). Male Tfap2b+/− mice exhibited a slight increase in the EEG power 4–4.5 Hz during NREMS, which might have resulted from a slight shift in the peak frequency (Figure S4A).
Tfap2bK145/+ female mice show fragmented NREMS
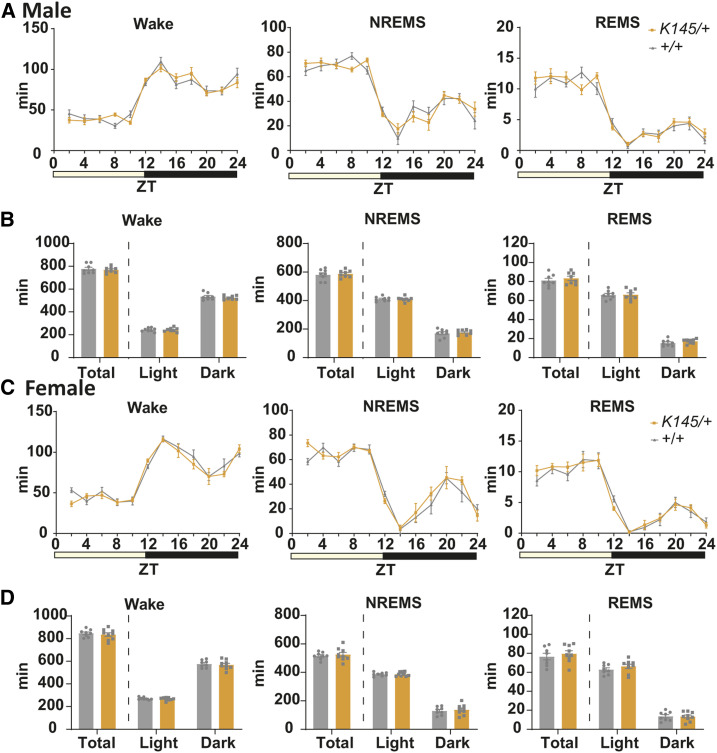
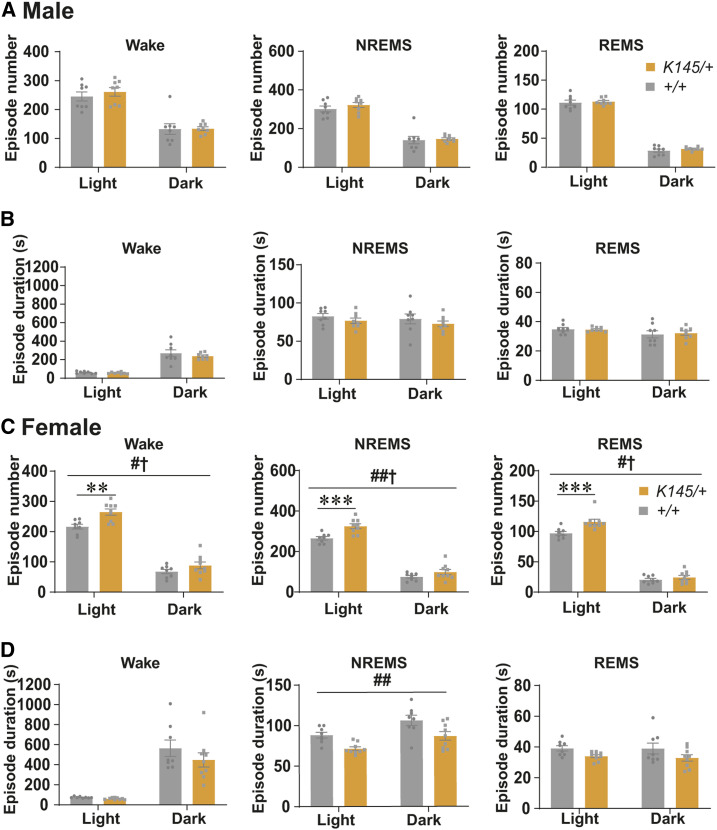
Considering that the TFAP2B protein expression level and survival rate were severely affected in Tfap2bK145/K145 mice, we next examined the sleep architecture of Tfap2bK145/+ male and female mice. Similar to male Tfap2b+/− mice, total time spent in wakefulness, NREMS, or REMS in Tfap2bK145/+ male mice were not significantly different from WT littermates (Figure 5, A and B). The episode duration and number of each state was also not significantly affected (Figure 6, A and B). During REMS, EEG power in the theta range was slightly reduced (Figure S5A).
Figure 5.
Comparison of the amount of sleep/wake in adult Tfap2b+/+ and Tfap2bK145/+ mice. (A) Bihourly amount of wakefulness, NREMS, and REMS across 24 hr in male mice. (B) Total amount of wakefulness, NREMS, and REMS during 24 hr, light phase, and dark phase in male mice. N = 8 Tfap2b+/+ mice, N = 8 Tfap2bK145/+ mice. (C) Bihourly amount of wakefulness, NREMS, and REMS across 24 hr in female mice. (D) Total amount of wakefulness, NREMS, and REMS during 24 hr, light phase, and dark phase in female mice. N = 8 Tfap2b+/+ mice, N = 9 Tfap2bK145/+ mice. Data are mean ± SEM.
Figure 6.
Comparison of the sleep episode number and duration in adult Tfap2b+/+ and Tfap2bK145/+ mice. (A, B) Episode numbers (A) and durations (B) of wakefulness, NREMS, and REMS during 24 hr, light phase, and dark phase in male mice. N = 8 Tfap2b+/+ mice, N = 8 Tfap2bK145/+ mice. (C and D) Episode numbers (C) and durations (D) of wakefulness, NREMS, and REMS during 24 hr, light phase, and dark phase in female mice. N = 8 Tfap2b+/+ mice, N = 9 Tfap2bK145/+ mice. # and † indicate significant main effect of genotype and significant interaction between genotype and light/dark phase, respectively, in two-way repeated-measures ANOVA (#,†P < 0.05, ##P < 0.01). * indicates significance in post hoc Bonferroni multiple comparison test (**P < 0.01, ***P < 0.001). Data are mean ± SEM.
Total time spent in wakefulness, NREMS, or REMS was also not significantly affected in female Tfap2bK145/+ mice (Figure 5, C and D). However, in contrast to female Tfap2b+/− mice, the episode number of wakefulness, NREMS, and REMS was increased during the light phase (Figure 6C). In addition, the duration of episodes of NREMS was largely decreased (Figure 6D). These results suggest that the sleep/wake stages are fragmented in the female Tfap2bK145/+ mice, especially the NREMS in the light phase. The EEG power spectra and NREMS delta density were not significantly affected (Figure S5B and Figure S7E).
Tfap2bK144/+ mice show reduced NREMS in the dark phase
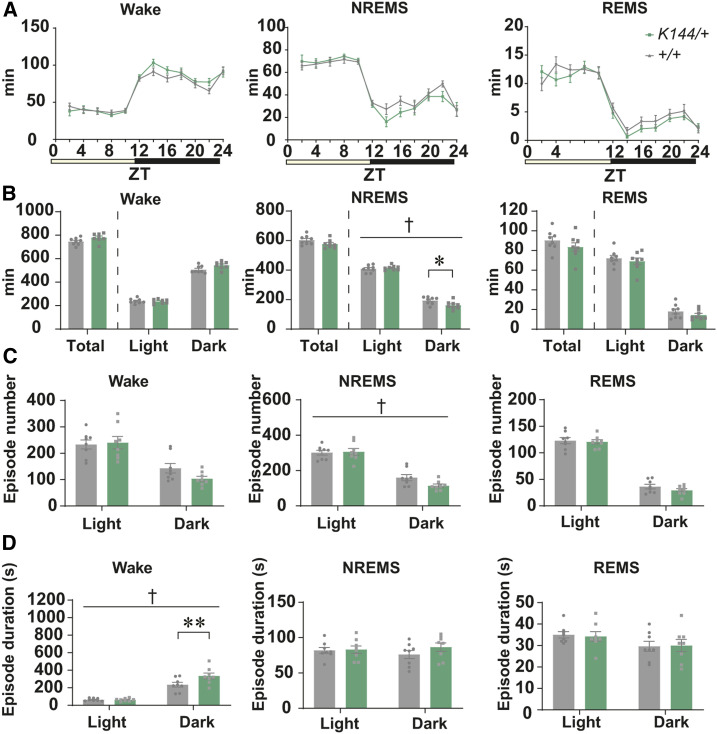
Next, we compared the sleep architecture between male WT and Tfap2bK144/+ littermates. Tfap2bK144/+ mice exhibited a significant decrease in the time spent in NREMS specifically in the dark phase (Figure 7, A and B). This was likely accounted for by a trend for decrease in the number of NREMS episodes (Figure 7C). In addition, during the dark phase, the episode duration of wakefulness was significantly increased, suggesting that each wake episode is more consolidated (Figure 7D). The EEG power spectra and NREMS delta density were not significantly affected (Figure S6 and Figure S7C).
Figure 7.
Comparison of the sleep architecture in adult Tfap2b+/+ and Tfap2bK144/+ mice. (A) Bihourly amount of wakefulness, NREMS, and REMS across 24 hr in male mice. (B) Total amount of wakefulness, NREMS, and REMS during 24 hr, light phase, and dark phase in male mice. (C, D) Episode durations (C) and numbers (D) of wakefulness, NREMS, REMS during 24 hr, light phase, and dark phase in male mice. N = 8 Tfap2b+/+ mice, N = 8 Tfap2bK144/+ mice. † indicates significant interaction between genotype and Zeitgeber time (ZT) or light/dark phase in two-way repeated-measures ANOVA (†P < 0.05). * indicates significance in post hoc Bonferroni multiple comparison test (*P < 0.05, **P < 0.01). Data are mean ± SEM.
Tfap2b is expressed in the superior colliculus, locus coeruleus, cerebellum, and nucleus of solitary tract
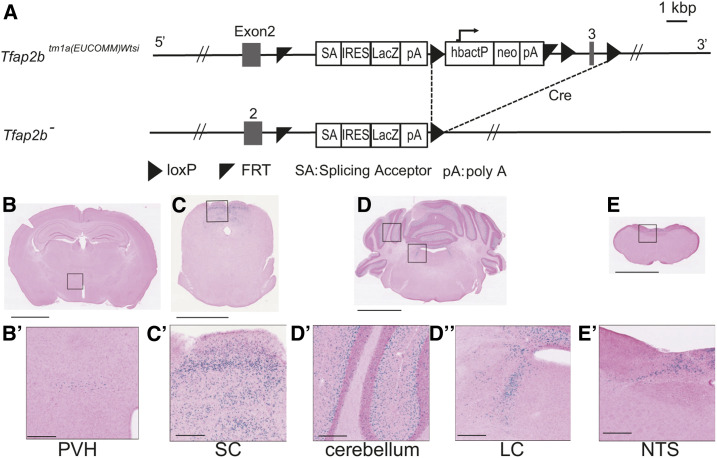
The Tfap2b– allele used in this study harbors a LacZ-expressing cassette that replaces the original Tfap2b gene (Figure 8A), thus allowing us to investigate the expression pattern of Tfap2b by X-gal staining. X-gal signals were observed in the hypothalamus, midbrain, and hindbrain (Figure 8, B–E). Strong X-gal signals were observed in the superior colliculus (SC; Figure 8C’), cerebellum (Figure 8D’), locus coeruleus (LC; Figure 8D’’), and the nucleus of solitary tract (NTS; Figure 8E’), whereas weak signals were detected around the paraventricular hypothalamic nucleus (PVH; Figure 8B’). No signals were detected in the other areas including the olfactory bulb, cerebral cortex, and the preoptic area. TFAP2B locate at cerebellum matured brain, and it is necessary for cerebellum interneuron specification (Zainolabidin et al. 2017). Currently, we confirmed the expression in the cerebellum and revealed another site of TFAP2B location in the adult brain.
Figure 8.
Expression analyses of Tfap2b in the adult brain by X-gal staining of Tfap2b+/− mice. (A) Schematic diagram of the Tfap2b– allele used in this study. (B–E) Images of areas where LacZ-derived signals were detected. PVH, paraventricular hypothalamic nucleus (B’); SC, superior colliculus (C’); LC, locus coeruleus (D’’); NTS, solitary tract nucleus (E’). Bars: B–E, 2.5 mm; B’–E’, 250 µm. Representative images from a replicate of three mice are shown.
Discussion
The transcription factor AP-2 has essential roles in developmentally timed sleep or stress-induced sleep in C. elegans (Turek et al. 2013, 2016; Konietzka et al. 2020) and in daily sleep in D. melanogaster (Kucherenko et al. 2016), suggesting the conserved involvement of this factor in invertebrate sleep. However, the roles of AP-2 in mammalian sleep remained unknown. The current study provides direct evidence showing that the deficiency in TFAP2B affects sleep in mice. Taken together, these studies strongly support that the molecular pathway involving TFAP2B plays a highly conserved role in sleep between mammals and invertebrate animals. Moreover, the current study revealed that mutations in the intron of Tfap2b mimicking mutations that were identified in human kindreds with Char syndrome affect sleep in a manner that is largely different from each other or from Tfap2b deficiency. Thus, this study provides an important example showing that mutations in a single gene can result in diverse sleep phenotypes, which might explain the diverse nature of sleep-related symptoms in Char syndrome or other familial diseases.
We showed that Tfap2b+/− female mice exhibit reduced NREMS and increased wakefulness amounts. This is consistent with the effect of deleting or knocking down the orthologs in C. elegans or D. melanogaster and supports the notion that the molecular mechanism of mammalian NREMS and invertebrate sleep are conserved (Miyazaki et al. 2017). We are not sure why male Tfap2b+/− mice did not exhibit significantly reduced NREMS, although there was a trend. While female and male mice have similar sleep homeostatic properties, some environmental factors can affect their sleep differently, suggesting that there are some sex differences in the sleep-regulatory mechanisms (Koehl et al. 2006). Tfap2b deficiency might have affected a sleep regulatory pathway that is more vulnerable in females.
In contrast to Tfap2b+/− mice, Tfap2bK145/+ female mice did not exhibit reduced NREMS amount but instead exhibited fragmented NREMS. The TFAP2B protein expression level was decreased to a similar extent in Tfap2b−/− and Tfap2bK145/K145 mice. Tfap2bK145 harbors a single base substitution within the highly conserved splice acceptor sequence (AG) immediately before exon 5. Thus, Tfap2bK145 was predicted to lead to the skipping of exon 5 (Mani et al. 2005). Indeed, in the Tfap2bK145/K145 mice, we detected a shortened Tfap2b mRNA in which exon 5 was missing. In addition, we also detected a Tfap2b mRNA in which only two nucleotides at the 5′-end of exon 5 was deleted. In both cases, the variation in the mRNA sequence leads to a frame shift. The mRNA expression level was also largely decreased in the Tfap2bK145/K145 mice, likely due to nonsense mediated decay. While this can explain why the TFAP2B protein expression level was largely decreased in Tfap2bK145/K145 mice, it remains unknown why Tfap2bK145/+ mice and Tfap2b+/− mice exhibit totally different sleep phenotypes. Unlike Tfap2b+/− mice, Tfap2bK145/+ mice did not exhibit an obvious reduction in TFAP2B protein, which might be a result of enhanced transcription of the WT allele by mechanisms of transcriptional adaptation (El-Brolosy et al. 2019). In addition to nonsense mediated decay, Tfap2bK145 might cause some effect on the protein that is different from Tfap2b–. For example, a small proportion of the mRNA derived from Tfap2bK145 might be translated, resulting in the expression of an abnormal protein that interferes with the function of the WT TFAP2B protein.
The sleep phenotype of Tfap2bK144/+ mice also differed from the other Tfap2b mutants. Male Tfap2bK144/+ mice showed reduced NREMS during the dark phase. Tfap2bK144 harbors a single base substitution within the putative splice donor sequence immediately after exon 3. In human cells, this mutation leads to the skipping of exon 3 (Mani et al. 2005). If exon 3 is skipped in Tfap2bK144, it will cause a frame shift and premature termination codon that would lead to either the production of a truncated protein or nonsense mediated decay of the mRNA. However, in case of the Tfap2bK144 allele, we did not detect any effects on the Tfap2b mRNA expression level nor sequence. Moreover, we did not detect any effects on the TFAP2B protein expression level nor the molecular weight even in homozygotes. In addition, unlike Tfap2bK145/K145 mice, Tfap2bK144/K144 mice were viable. Thus, further analyses are required to reveal how the mutation affects the properties of TFAP2B. Another possibility might be that, considering that cis-elements of transcriptional regulation can exist in introns, Tfap2bK144 might affect the expression pattern of Tfap2b.
In the adult brain, Tfap2b expression was detected in the SC, LC, cerebellum and NTS. Within these areas, the SC is implicated in the acute induction of sleep triggered by light stimulation during the dark phase, although its dysfunction does not affect baseline sleep (Miller et al. 1998). By contrast, LC contains wake promoting neurons (Aston-Jones and Bloom 1981), and global or local deletion of dopamine β-hydroxylase, which is essential for the synthesis of noradrenalin in LC, results in reduced wakefulness and increased NREMS (Carter et al. 2010; Yamaguchi et al. 2018). Thus, although deletion of Tfap2b leads to reduced expression of dopamine β-hydroxylase in the LC (Seok et al. 2008), we are not sure whether it can explain the observed sleep phenotypes in this study. Tfap2b is more widely expressed in the embryonic brain (Thompson et al. 2014), and it might play a crucially role in the differentiation of sleep-promoting neurons. The mechanisms of sleep regulation by AP-2 transcription factors are best studied in C. elegans. In C. elegans, the GABAergic neuron RIS plays a crucial role in the induction of sleep (Turek et al. 2013). The C. elegans ortholog APTF-1 is selectively expressed in RIS, and APTF-1 exerts its sleep-promoting effect by promoting the transcription of the neuropeptide FLP-11 in RIS (Turek et al. 2016). Thus, TFAP2B might contribute to mouse sleep regulation by promoting the transcription or syntheses of neuropeptides or other neuromodulators within sleep-promoting neurons.
While we successfully showed that mutations in Tfap2b can differently affect sleep, the effects of Tfap2bK144 and Tfap2bK145 on mouse sleep did not match the sleep-related symptoms that were self-reported by the human kindreds 144 and 145. In humans, kindred 144 self-reported parasomnia. However, although we monitored mice behaviors by video recording together with EEG/EMG recording, we never observed any abnormal movements during sleep in any of the Tfap2b mutants. In addition, kindred 145 self-reported short sleep, whereas Tfap2bK145/+ mice exhibited fragmented sleep. There is a possibility that the effects of the mutations in Tfap2b might differ depending on the species or other genetic backgrounds. In addition, the human studies on kindreds 144 and 145 did not conduct polysomnography recording, and thus the self-reports on sleep might not be accurate.
In summary, by generating Tfap2bK144 and Tfap2bK145 mutant mice and comparing their sleep with Tfap2b+/− mice, we show that Tfap2b is involved in the regulation of sleep in mice and that different mutations within Tfap2b have diverse effects on sleep. This study further supports the important and complicated roles of AP-2 transcription factors in sleep regulation.
Acknowledgments
We thank Risa Yamazaki for technical advice. This study was supported by the Japan Society for the Promtion of Science (JSPS) KAKENHI grant number JP20H03353, Japan Agency for Medical Research and Development (AMED) under grant numbers JP19dm0107138 and JP19gm1110008 (to Y.H.), Japan Science and Technology Agency (JST) under grant number JPMJCR1655 and the Ministry of Education, Culture, Sports, Science and Technology (MEXT)/JSPS World Premier International Research Center (WPI) program (to M.Y. and Y.H.).
Footnotes
Supplemental material available at figshare: https://doi.org/10.25386/genetics.12904568.
Communicating editor: J. Schimenti
Literature Cited
- Aston-Jones G., and Bloom F. E., 1981. Activity of norepinephrine-containing locus coeruleus neurons in behaving rats anticipates fluctuations in the sleep-waking cycle. J. Neurosci. 1: 876–886. 10.1523/JNEUROSCI.01-08-00876.1981 [DOI] [PMC free article] [PubMed] [Google Scholar]
- Carter M. E., Yizhar O., Chikahisa S., Nguyen H., Adamantidis A. et al. , 2010. Tuning arousal with optogenetic modulation of locus coeruleus neurons. Nat. Neurosci. 13: 1526–1535. 10.1038/nn.2682 [DOI] [PMC free article] [PubMed] [Google Scholar]
- Davidson H. R., 1993. A large family with patent ductus arteriosus and unusual face. J. Med. Genet. 30: 503–505. 10.1136/jmg.30.6.503 [DOI] [PMC free article] [PubMed] [Google Scholar]
- Eckert D., Buhl S., Weber S., Jäger R., and Schorle H., 2005. The AP-2 family of transcription factors. Genome Biol. 6: 246 10.1186/gb-2005-6-13-246 [DOI] [PMC free article] [PubMed] [Google Scholar]
- El-Brolosy M. A., Kontarakis Z., Rossi A., Kuenne C., Günther S. et al. , 2019. Genetic compensation triggered by mutant mRNA degradation. Nature 568: 193–197. 10.1038/s41586-019-1064-z [DOI] [PMC free article] [PubMed] [Google Scholar]
- Funato H., Miyoshi C., Fujiyama T., Kanda T., Sato M. et al. , 2016. Forward-genetics analysis of sleep in randomly mutagenized mice. Nature 539: 378–383. 10.1038/nature20142 [DOI] [PMC free article] [PubMed] [Google Scholar]
- Hayashi Y., Kashiwagi M., Yasuda K., Ando R., Kanuka M. et al. , 2015. Cells of a common developmental origin regulate REM/non-REM sleep and wakefulness in mice. Science 350: 957–961. 10.1126/science.aad1023 [DOI] [PubMed] [Google Scholar]
- Honda T., Fujiyama T., Miyoshi C., Ikkyu A., Hotta-Hirashima N. et al. , 2018. A single phosphorylation site of SIK3 regulates daily sleep amounts and sleep need in mice. Proc. Natl. Acad. Sci. USA 115: 10458–10463. 10.1073/pnas.1810823115 [DOI] [PMC free article] [PubMed] [Google Scholar]
- Hong S. J., Lardaro T., Myung S. O., Huh Y., Ding Y. et al. , 2008. Regulation of the noradrenaline neurotransmitter phenotype by the transcription factor AP-2β. J. Biol. Chem. 283: 16860–16867. 10.1074/jbc.M709106200 [DOI] [PMC free article] [PubMed] [Google Scholar]
- Jin K., Jiang H., Xiao D., Zou M., Zhu J. et al. , 2015. Tfap2a and 2b act downstream of Ptf1a to promote amacrine cell differentiation during retinogenesis. Mol. Brain 8: 28 10.1186/s13041-015-0118-x [DOI] [PMC free article] [PubMed] [Google Scholar]
- Koehl M., Battle S., and Meerlo P., 2006. Sex differences in sleep: the response to sleep deprivation and restraint stress in mice. Sleep 29: 1224–1231. 10.1093/sleep/29.9.1224 [DOI] [PubMed] [Google Scholar]
- Konietzka J., Fritz M., Spiri S., McWhirter R., Leha A. et al. , 2020. Epidermal growth factor signaling promotes sleep through a combined series and parallel neural circuit. Curr. Biol. 30: 1–16.e13. 10.1016/j.cub.2019.10.048 [DOI] [PubMed] [Google Scholar]
- Kucherenko M. M., Ilangovan V., Herzig B., Shcherbata H. R., and Bringmann H., 2016. TfAP-2 is required for night sleep in Drosophila. BMC Neurosci. 17: 72 10.1186/s12868-016-0306-3 [DOI] [PMC free article] [PubMed] [Google Scholar]
- Mani A., Radhakrishnan J., Farhi A., Carew K. S., Warnes C. A. et al. , 2005. Syndromic patent ductus arteriosus: evidence for haploinsufficient TFAP2B mutations and identification of a linked sleep disorder. Proc. Natl. Acad. Sci. USA 102: 2975–2979. 10.1073/pnas.0409852102 [DOI] [PMC free article] [PubMed] [Google Scholar]
- Miller A. M., Obermeyer W. H., Behan M., and Benca R. M., 1998. The superior colliculus-pretectum mediates the direct effects of light on sleep. Proc. Natl. Acad. Sci. USA 95: 8957–8962. 10.1073/pnas.95.15.8957 [DOI] [PMC free article] [PubMed] [Google Scholar]
- Miyazaki S., Liu C. Y., and Hayashi Y., 2017. Sleep in vertebrate and invertebrate animals, and insights into the function and evolution of sleep. Neurosci. Res. 118: 3–12. 10.1016/j.neures.2017.04.017 [DOI] [PubMed] [Google Scholar]
- Moser M., Pscherer A., Roth C., Becker J., Mücher G. et al. , 1997. Enhanced apoptotic cell death of renal epithelial cells in mice lacking transcription factor AP-2β. Genes Dev. 11: 1938–1948. 10.1101/gad.11.15.1938 [DOI] [PMC free article] [PubMed] [Google Scholar]
- Moser M., Dahmen S., Kluge R., Gröne H., Dahmen J. et al. , 2003. Terminal renal failure in mice lacking transcription factor AP-2β. Lab. Invest. 83: 571–578. 10.1097/01.LAB.0000064703.92382.50 [DOI] [PubMed] [Google Scholar]
- Niwa H., Araki K., Kimura S., Taniguchi S. I., Wakasugi S. et al. , 1993. An efficient gene-trap method using poly a trap vectors and characterization of gene-trap events. J. Biochem. 113: 343–349. 10.1093/oxfordjournals.jbchem.a124049 [DOI] [PubMed] [Google Scholar]
- Satoda M., Zhao F., Diaz G. A., Burn J., Goodship J. et al. , 2000. Mutations in TFAP2B cause Char syndrome, a familial form of patent ductus arteriosus. Nat. Genet. 25: 42–46. 10.1038/75578 [DOI] [PubMed] [Google Scholar]
- Sato Y., Tsukaguchi H., Morita H., Higasa K., Tran M. T. N. et al. , 2018. A mutation in transcription factor MAFB causes focal segmental glomerulosclerosis with duane retraction syndrome. Kidney Int. 94: 396–407. 10.1016/j.kint.2018.02.025 [DOI] [PubMed] [Google Scholar]
- Seki R., Kitajima K., Matsubara H., Suzuki T., Saito D. et al. , 2015. AP-2β is a transcriptional regulator for determination of digit length in tetrapods. Dev. Biol. 407: 75–89. 10.1016/j.ydbio.2015.08.006 [DOI] [PubMed] [Google Scholar]
- Shi G., Wu D., Ptáček L. J., and Fu Y. H., 2017. Human genetics and sleep behavior. Curr. Opin. Neurobiol. 44: 43–49. 10.1016/j.conb.2017.02.015 [DOI] [PMC free article] [PubMed] [Google Scholar]
- Skarnes W. C., Rosen B., West A. P., Koutsourakis M., Bushell W. et al. , 2011. A conditional knockout resource for the genome-wide study of mouse gene function. Nature 474: 337–342. 10.1038/nature10163 [DOI] [PMC free article] [PubMed] [Google Scholar]
- Thompson C. L., Ng L., Menon V., Martinez S., Lee C. K. et al. , 2014. A high-resolution spatiotemporal atlas of gene expression of the developing mouse brain. Neuron 83: 309–323. 10.1016/j.neuron.2014.05.033 [DOI] [PMC free article] [PubMed] [Google Scholar]
- Turek M., Lewandrowski I., and Bringmann H., 2013. An AP2 transcription factor is required for a sleep-active neuron to induce sleep-like quiescence in C. elegans. Curr. Biol. 23: 2215–2223. 10.1016/j.cub.2013.09.028 [DOI] [PubMed] [Google Scholar]
- Turek M., Besseling J., Spies J. P., König S., and Bringmann H., 2016. Sleep-active neuron specification and sleep induction require FLP-11 neuropeptides to systemically induce sleep. eLife 5: e12499 10.7554/eLife.12499 [DOI] [PMC free article] [PubMed] [Google Scholar]
- Yamaguchi H., Hopf F. W., Bin Li S., and de Lecea L., 2018. In vivo cell type-specific CRISPR knockdown of dopamine beta hydroxylase reduces locus coeruleus evoked wakefulness. Nat. Commun. 9: 5211 10.1038/s41467-018-07566-3 [DOI] [PMC free article] [PubMed] [Google Scholar]
- Zainolabidin N., Kamath S. P., Thanawalla A. R., and Chen A. I., 2017. Distinct activities of tfap2a and tfap2b in the specification of GABaergic interneurons in the developing cerebellum. Front. Mol. Neurosci. 10: 281 10.3389/fnmol.2017.00281 [DOI] [PMC free article] [PubMed] [Google Scholar]
Associated Data
This section collects any data citations, data availability statements, or supplementary materials included in this article.
Data Availability Statement
The authors state that all data necessary for confirming the conclusions presented in the article are represented fully within the article. Further information and requests for reagents should be directed to and will be fulfilled by the corresponding author. Supplemental material available at figshare: https://doi.org/10.25386/genetics.12904568.


