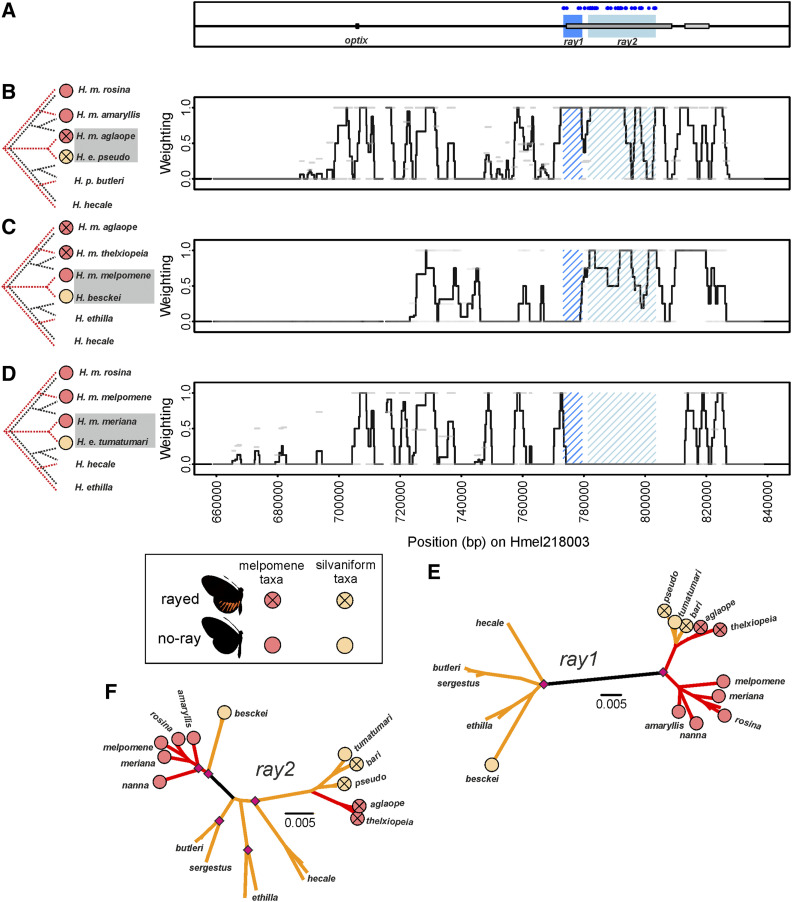
Figure 2.
Twisst comparisons across the optix region of scaffold Hmel218003. (A) Location of optix and ray elements. Dark blue (ray1) and light blue (ray2) shading shows putative functional elements. Gray boxes show ray and dennis regulatory elements respectively as previously delimited in Wallbank et al. (2016). Diagnostic fixed SNPs between phenotypes shown with blue dots in (A). Twisst comparison (100 SNP windows sliding by 25 SNPs) using (B) Peruvian hybrid zone taxa, (C) H. besckei and Guianese hybrid zone H. melpomene, and (D) Guianese hybrid zone taxa. Black trees to left show species topology, while red trees shows groupings (taxa shaded in gray) that indicate shared ancestry between the heterospecific mimetic taxa. Weighting (black line) is the mean from all four overlapping windows for that region, light gray bars show weighting for each 100 SNP window. A weighting of +1 means 100% of trees at that genomic interval show shared ancestry between the heterospecific mimetic taxa. Mimetic phenotypes for taxa are shown by circles; red circles for H. melpomene clade and orange circles for silvaniform taxa. (E and F) Maximum likelihood phylogenies of the ray elements with red branches joining H. melpomene taxa and orange branches joining silvaniform taxa. Node bootstrap support; pink diamonds ≥ 95%, green diamonds 75–94%. Black branch (illustrative only) separates the silvaniform and H. melpomene clades (excluding those taxa where introgression appears to have occurred).

