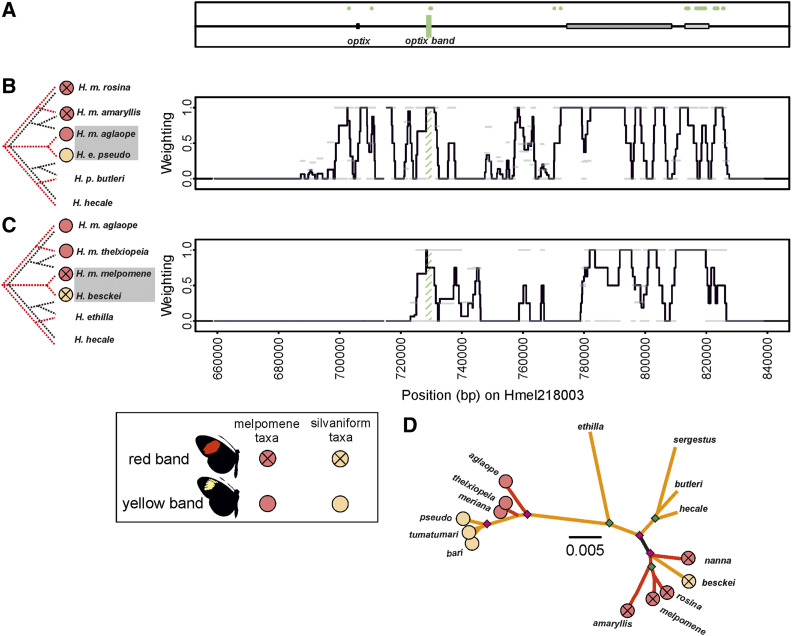
Figure 4.
Twisst comparisons across the optix region of scaffold Hmel218003. (A) Shows location of optix and putative optix band element. Gray boxes show ray and dennis regulatory elements respectively as previously delimited in Wallbank et al. (2016). Green shading shows putative functional elements. Diagnostic fixed SNPS between phenotypes shown with green dots in (A). Twisst comparison (100 SNP windows sliding by 25 SNPs) using (B) Peruvian hybrid zone taxa, and (C) H. besckei and Guianese hybrid zone taxa. Mimetic phenotypes for taxa are shown by circles; red circles for H. melpomene clade and orange circles for silvaniform taxa. (D) Maximum likelihood phylogeny of putative optix band element; see Figure 2 legend for more detailed explanations.

