

Abstract
Circadian disruption influences metabolic health. Metabolism modulates circadian function. However, the mechanisms coupling circadian rhythms and metabolism remain poorly understood. Here we report that Cystathionine β-synthase (CBS), a central enzyme in one-carbon metabolism, functionally interacts with the core circadian protein Cryptochrome1 (CRY1). In cells, CBS augments CRY1 mediated repression of the CLOCK/BMAL1 complex and shortens circadian period. Notably, we find that mutant CBS-I278T protein, the most common cause of homocystinuria, does not bind CRY1 or regulate its repressor activity. Transgenic CbsZn/Zn mice, while maintaining circadian locomotor activity period, exhibit reduced circadian power and increased expression of E-BOX outputs. CBS function is reciprocally influenced by CRY1 binding. CRY1 modulates enzymatic activity of the CBS. Liver extracts from Cry1−/− mice show reduced CBS activity that normalizes after the addition of exogenous wild type (WT) CRY1. Metabolomic analysis of WT, CbsZn/Zn, Cry1−/−, and Cry2−/− samples highlights the metabolic importance of endogenous CRY1. We observed temporal variation in one-carbon and transsulfuration pathways attributable to CRY1 induced CBS activation. CBS-CRY1 binding provides a post-translational switch to modulate cellular circadian physiology and metabolic control.
Keywords: Cryptochrome, Cystathionine β-synthase, metabolism, circadian rhythm, transcriptional regulation, hydrogen sulfate, metabolomics
Graphical Abstract
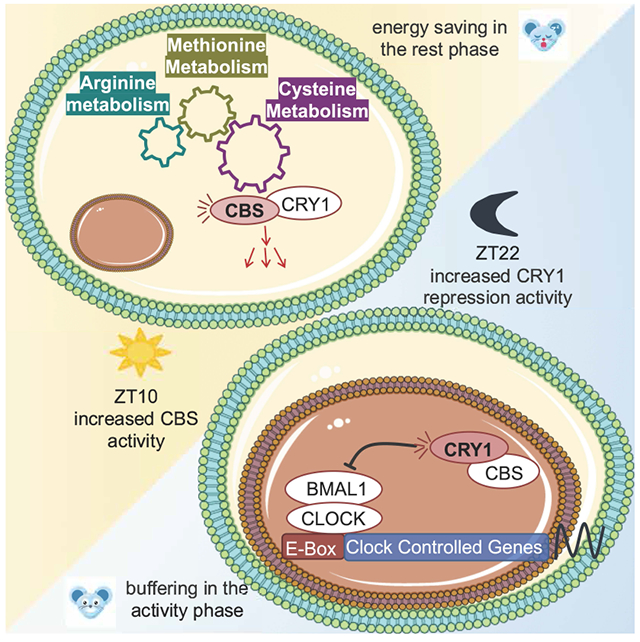
The mechanisms coupling circadian rhythms and metabolism remain poorly understood. We find that the core circadian protein Cryptochrome 1 (CRY1) binds Cystathionine β-synthase (CBS), a central enzyme in one-carbon metabolism. This binding modulates the activity of both proteins. During the active phase, CBS augments CRY1 mediated repression of BMAL1/CLOCK driven transcription. During the rest phase, CRY1 increases CBS enzymatic activity.
Introduction
The circadian clock modulates numerous behaviors and physiologic functions through periodic transcriptional regulation [1]. Alertness, memory, heart rate, blood pressure, and immune responses are all clock-controlled [2–4]. Additionally, genetic and epidemiologic studies have linked clock disruption with various adverse metabolic phenotypes [5]. Dietary challenges, in turn, can alter free-running circadian period [6], and local tissue rhythms [7]. Prominent metabolic and transcriptional rhythms occur across phyla influencing physiology in cyanobacteria, fungi, plants and virtually all animals [8].
At the molecular level, the cellular clockwork involves both positive and negative transcriptional feedback loops [9, 10]. The BMAL1/CLOCK heterodimer is central to circadian biology, binding E-BOX elements (CACGTG) in the Period (Per) and Cryptochrome (Cry) genes and inducing their transcription. PER and CRY proteins are shuttled to the cytoplasm forming heterodimers that interact with casein kinase Iε (CKIε). Ultimately the heterodimer translocates and returns to the nucleus where it represses BMAL1/CLOCK driven transcription. The degradation of CRY and PER proteins relieves the repression of BMAL1/CLOCK, restarting the cycle anew.
Genetic, biochemical, and computational tools indicate that there is likely to be a rich network of clock modulating factors and additional clock components. Additional genetic and epigenetic mechanisms regulate tissue-specific clock functions [11–13]. RNA degradation, post-translational processing, and protein degradation are all actively regulated. Indeed, a recent study revealed that 50% of detected metabolites are under circadian control in mouse liver [14] and nearly 50% of transcripts show circadian modulation in at least one tissue [15].
Cystathionine-β-Synthase (CBS, EC 4.2.1.22) is a rate-limiting, regulatory branch point in the eukaryotic methionine cycle. CBS catalyzes a pyridoxal 5′-phosphate dependent beta-replacement reaction condensing serine and homocysteine to cystathionine. Cystathionine is subsequently converted to cysteine in a reaction catalyzed by cystathionine γ-lyase. Meanwhile, homocysteine, an intermediary amino acid metabolite in this process, is critical for the regulation of methionine, folate, and transsulfuration pathways [16]. The absence of the CBS in mice results in high levels of total homocysteine and a reduced SAM/SAH ratio in serum [17].
Here we present data showing that CBS, an enzyme catalyzing the first and rate limiting step of the transsulfuration pathway, regulates clock dynamics by enhancing the repressive activity of CRY1 on BMAL1/CLOCK driven transcription. Knockdown of Cbs by siRNA in the U2-OS and NIH3T3 cellular systems resulted in a shortened circadian period. While the period of free-running activity rhythms in transgenic mice was unchanged, the power of circadian locomotor activity rhythms was much reduced. Perhaps more strikingly, we find that CRY1 enhances CBS enzymatic activity both in vivo and in vitro. CBS enzymatic activity was significantly reduced in liver samples obtained from Cry1−/− animals. The addition of purified CRY1 to Cry1−/− samples restored CBS enzymatic activity. Addition of a non-binding CRY1 point mutant did not restore CBS activity. To understand the metabolic significance of CRY1 induced post-translational regulation in CBS activity, we used metabolomics to study the metabolic pathways altered in Cry1−/− mice, utilizing Cry2−/− and WT mice as controls. The analysis indicated that physiologic levels of CRY1 abundance specifically modulate fatty acid, amino acid and one-carbon pathways. Collectively our data show that CRY1 non-transcriptionally regulates CBS enzymatic activity and the spatio-temporal control of cellular metabolism. Additionally, wild type CBS, but not disease-causing mutant CBS-I278T enhances CRY1 repressor activity.
Results
CBS Physically and Functionally Interacts with CRY1
We identified Cystathionine-β-synthase (CBS), in a computational screen for potential circadian clock components and modifiers [11]. We then employed a mammalian two-hybrid screen to identify physical interactions between CBS and a subset of known clock components. As expected, many core clock proteins physically interacted with each other, as indicated by specific activation of a pG5-luc reporter in transfected Human Embryonic Kidney 293T cells (HEK 293T). CBS and CRY1 were observed to interact resulting in a greater than 14-fold induction of luciferase activity (Fig. 1A). No interactions were observed between CBS and CRY2. To identify the region of CRY1 responsible for the CBS interaction, truncated Cry1 mutants were generated by PCR [18] and cloned into pBIND (Fig. 1B). These constructs were screened for continued interactions with CBS using the mammalian two-hybrid system. As compared to full length CRY1, all of the truncated forms induced significantly less luciferase activity when co-expressed with VP16-CBS (Fig. 1C). Hence, we concluded that the region between 586 and 606 of CRY1-T1 is required for the interaction between CRY1 and CBS. Western blot analysis of cell lysates from HEK 293T cells that transfected with the truncated CRY1 constructs (from CRY-T1 to CRY1-T7) revealed expressed proteins at the expected molecular masses (Fig. 1C, bottom). Notably, all but the very shortest truncated CRY1 construct (T1-T6) retained the ability to repress BMAL1/CLOCK driven transcription (Figure 1D). Native and FLAG/HIS tagged co-immunoprecipitation (Co-IP) results confirmed the interaction between CRY1 and CBS in HEK 293T cells (Fig. 1E and F). Notably, native Co-IP did not demonstrate an interaction between CRY2Y1-T1 and CBS (Fig. 1E) and the FLAG tagged Co-IP did not demonstrate an interaction between CRY1-T12 and CBS (Fig. 1F).
Fig. 1: CBS physically and functionally interacts with CRY1.
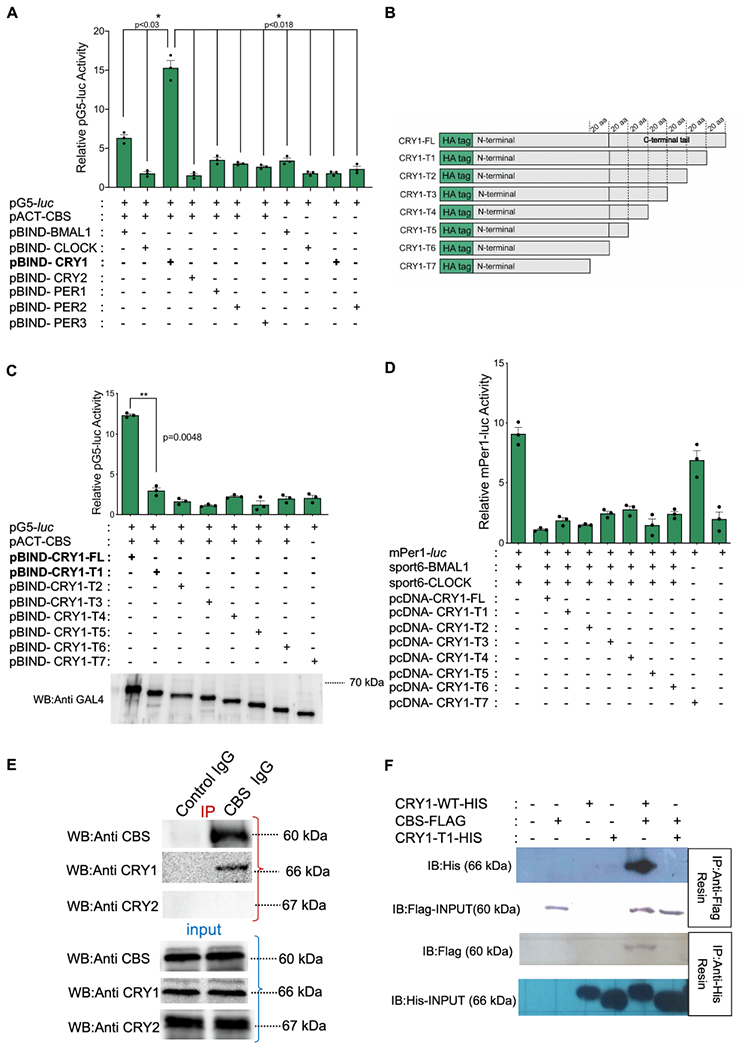
(A) Mammalian two hybrid (M2H) interaction analysis of CBS and core clock components. M2H luciferase activity is normalized with renilla luciferase and calculated relative to background (Bars show the mean luciferase activity ± SEM, n=3, *p<0.03, *p<0.018) (unpaired, two-tailed t-test). (B) Schematic representation of CRY1 truncations. (C) M2H analysis of CBS and truncated CRY1 proteins (Bars show the mean luciferase activity ± SEM, n=3, **p<0.0048) (unpaired, two-tailed t-test). Bottom: Expression of all constructs was confirmed by Western blot using GAL4 antibody. (D) Transactivation activity of BMAL1 and CLOCK of a luciferase reporter from Per1-E-Boxes. Full length and truncated CRY1 proteins are able to repress BMAL1-CLOCK transcriptional activity (mean ± SEM, n=3). (E) Native co-immunoprecipitation from HEK293T samples showing CRY1-CBS interaction in vivo. Binding partners were assessed by SDS-PAGE and Western blot with indicated antibodies. CBS, CRY1 and CRY2 in the input samples are shown in the bottom three blots. Upper panel shows immunoprecipitation (IP) results of CBS, CRY1 and CRY2. CBS antibody was pulled down with anti-mouse resin. The figure is the representative of three experiments. (F) Co-immunoprecipitation (co-IP) experiment evaluating the binding of CBS with CRY1 and CRY1-T1 after overexpression in HEK293T cells. Either His-CRY1 or FLAG-CBS was immunoprecipitated and binding partners were assessed by SDS-PAGE and Western blot with indicated antibodies. CRY1-T1 does not interact with CBS. The figure is the representative of three experiments.
The terminal 20 amino acids of CRY1 that are absent from the CRY1-T1 construct appear critical for CRY1-CBS binding. We applied PCR with degenerate primers to introduce point mutations in this region and further specify the important residues. Constructs with randomly generated mutations were evaluated in the two-hybrid system for interaction with CBS. Mutants yielded levels of luciferase activity, and hence CBS binding, comparable to wild type (WT). Mutant constructs from the initial screen had more than one mutation, and only constructs containing mutation at Arg602 showed reduced luciferase activity. In order to further assess the necessity of Arg602 in CRY1-CBS interactions, we replaced Arg602 in full-length Cry1 cDNA with proline, using site-directed mutagenesis. We confirmed expression of the mutant protein by Western blot (Fig. 2A-below the graph). In the mammalian two-hybrid system, luciferase activity induced by the binding of CRY1-R602P and CBS was comparable with activity from binding of CRY1-T1/CBS and CRY2/CBS and much reduced activity as compared to WT CRY1 and CBS (Fig. 2A). This suggests that CRY1 Arg602 is important for CBS binding. Notably, both the CRY1-T1 construct and the Arg602 to Pro mutation did not appear to interfere with either CRY1/PER2 binding or CRY1 repression activity (Fig. 2B and 2C). Queries of the NCBI Homologene database [19] revealed that Arg602 has a high degree of conservation across diverse species (Fig. 2D). These results suggested that CRY1-Arg602 is critically important for CBS binding.
Fig. 2: Functionally active mutant CRY1 does not interact with CBS.
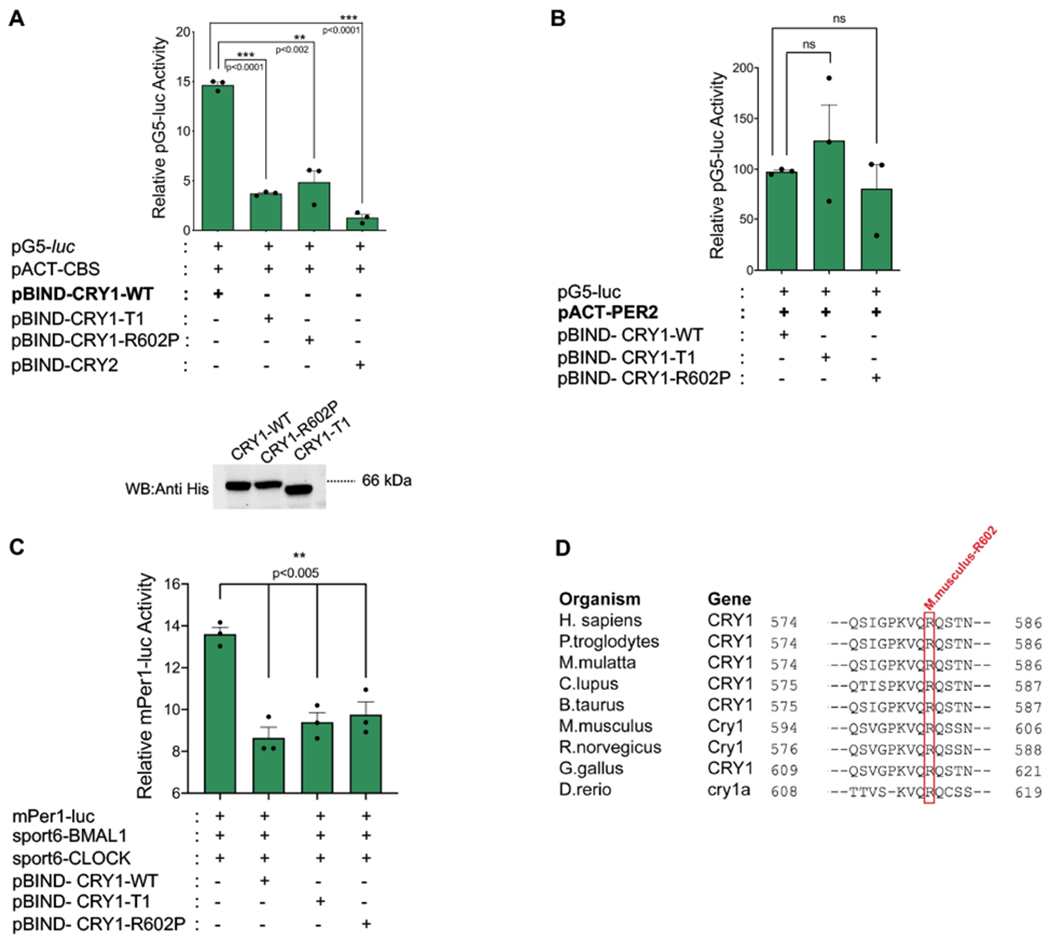
(A) Mammalian two hybrid (M2H) analysis assessing the binding of CRY1-WT, CRY1 truncation mutant (CRY1-T1), CRY1 point mutant (CRY1-R602P), and CRY2 with CBS (Bars show the mean luciferase activity ± SEM, n=3, ***p<0.0001, **p<0.002) (unpaired, two-tailed t-test). Western blot results indicate the expression of mutants and wild type CRYs used in M2H. (B) The M2H interaction analysis of PER2 and CRY1-WT, CRY1-T1 and CRY1-R602P. (Bars show the mean luciferase activity ± SEM, n=3) (C) Repressive function of wild type, truncated (CRY1-T1) and mutant CRY1 (CRY1-R602P) on BMAL1-CLOCK transactivation indicating that all constructs are functional (Bars show the mean luciferase activity ± SEM, n=3, **p<0.005) (unpaired, two-tailed t-test). (D) Cross-species alignment of the last 22 amino acids of mouse CRY1. The red box highlights the completely conserved mouse CRY1-R602 in nine diverse species. Multiple alignment analysis was performed on NCBI HomoloGene. Sequences from the following Cry1 gene accession numbers were used for the alignment: H.sapiens: NP_004066.1, P.troglodytes: XP_509339.2, M.mulatta: NP_001181088.1, C.lupus: XP_025317619.1, B.taurus: AAI34487.1, M.musculus: NP_031797.1, R. norvegicus: NP_942045.2, G. gallus: NP_989576.1, D.rerio: AAI34839.1.
All these results collectively suggested that CBS specifically interacts with CRY1 and prompted us to localize these proteins within the cells.
CBS and CRY1 Co-localize in the Cytosol and Nucleus in vivo and in vitro
Bi-molecular Fluorescence Complementation (Bi-FC) was performed in HEK293T cells to localize CRY1-CBS protein interactions within the cell. A fluorescent signal from an enhanced yellow fluorescent protein (YFP) is observed in regions where CRY1 and CBS interact. mCherry plasmid was also transfected into the same HEK293T cells as a cytoplasmic localization marker. DAPI was used as a nuclear localization marker. CBS and CRY1 interactions appeared in both the nucleus and cytoplasm (Fig. 3A, top panel). We confirmed the presence of CBS in the BiFC identified CBS-CRY1 interaction area using immunohistochemistry (Fig. 3A, bottom). While CRY1-WT interacts with CBS, CRY1-R602P does not appear to interact with CBS using the same BiFC protocol (Fig. 3A, top panel). Expression of CBS, CRY1, and CRY1-R602P from the Bi-FC plasmids were verified via Western blot (Fig. 3B).
Fig. 3:
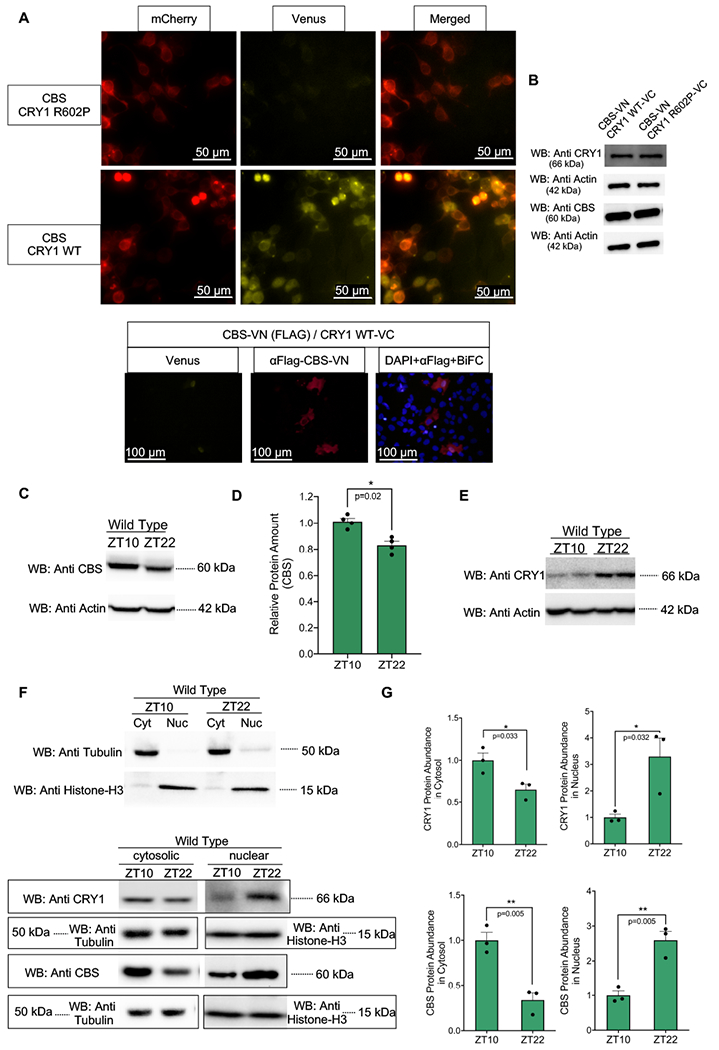
CBS and CRY1 co-localize in cytosol and nucleus (A-top) Bi-molecular fluorescence complementation assay (Bi-FC) of CRY1-WT and CRY1-R602P with CBS indicating both cytosolic and nuclear localization of the interaction. There are both cytosolic (mCherry overlapping) and nuclear (mCherry non-overlapping) venus signals. As seen from the top venus channel detection, there is no physical interaction between CRY1-R602P and CBS. Scale bar is indicated on the figure. The provided image is the representative of three experiments. (A-bottom) Immunohistochemical confirmation of CBS protein in the area where BiFC signal is detected from CBS-CRY1 interaction. Scale bar is indicated on the figure. The provided image is the representative of three experiments. (B) Confirmation of the expressions of CRY1 and CBS in venus plasmids used in Bi-FC studies by Western blot. 200 ng CRY1-VC and 300 ng of CBS-VN were transfected into HEK293T cells with Fugene HD in 35-mm plates. (C) Western blot of CBS abundance from whole cell lysates were performed (n=4) a representative blot is shown. Anti-Actin is used as a loading control. (D) Relative CBS protein image density levels (as compared to Actin control) were quantified and normalized by the average value at ZT10 and are shown. A two factor ANOVA including both Western blot gel identifier and ZT was used to assess the influence of circadian time (mean ± SEM, n=4, *p=0.02). (E) A western blot showing CRY1 abundance as compared to Anti-Actin control (F- Top Western blot) Fractionation efficiency is evaluated by Western blots of cytosolic (Tubulin) and nuclear (Histone-H3) marker proteins. (F- Bottom Western blot) Fractionation of the nuclear and cytosolic components of wild type mouse liver at both ZT 10 and ZT 22 (n=3). (G) The relative amounts of CRY1 and CBS in both cytosolic and nuclear samples at both time points are shown (mean ± SEM, n=3, *p=0.03, **p=0.005) (unpaired, two-tailed t-test). Western blots in B, D, E and F are representatives of three biological replicates. Western blot in C has 4 replicates.
Data from the CiraDB mouse circadian database [20], demonstrate that Cbs expression cycles with a 24-h period in liver and lung [15, 20, 21]. Reconstructed human lung and liver rhythms similarly show oscillations in CBS expression [22]. Time course microarray studies demonstrate that Cbs expression is reduced and arrhythmic in Clock mutant animals [23]. Indeed Zhang and colleagues have previously demonstrated a circadian modulation in hepatic CBS protein abundance that was disrupted in a NR1D1 knockout mice [24]. We used Western blot analysis to independently confirm diurnal modulation of CBS protein in WT mouse liver sample (p=0.003) (Fig. 3C and D).
We reasoned that in vivo co-localization of CRY1 and CBS is a prerequisite for a biologically important effect. Mice were housed in a 12:12 light dark cycle. Zeitgeber time (ZT) is used to describe these environmental conditions with ZT0 being defined by lights on and ZT12 being defined by lights off. To identify the cellular distributions of these proteins, we fractionated liver samples from WT animals euthanized at ZT10 and ZT22 when the total cellular abundance of CRY1 is at its peak (ZT22) or trough (ZT10) in WT mice [25]. We initially checked total CRY1 and CBS abundance at ZT10 and ZT22. The amount of CRY1 is considerably higher at ZT22 than at ZT10 while the amount of the CBS was higher at ZT10 than at ZT22 (Fig. 3E). Then, we wish to determine cellular distribution of the CRY1 and CBS in each ZT. We, therefore, separately isolated cytosolic and nuclear proteins. Proteins, known to be specifically localized in nucleus (Histone-H3) and cytoplasm (Tubulin), were used as controls to evaluate the purity of the fractions (Fig. 3F,top) [26]. As can be seen in Fig. 3F (bottom blot), nuclear CRY1 abundance is higher at ZT22 as compared with ZT10 (quantification is given in Fig. 3G). On the other hand, cytosolic CRY1 abundance was higher at ZT10 as compared with ZT22. CBS protein was similarly observed in both the nuclear and cytoplasmic compartments. Cytosolic levels of CBS were higher at ZT10 as compared with ZT22 while the nuclear abundance of CBS was higher at ZT22. These results further support the hypothesis that these two proteins have the potential to interact in vivo. We next asked if the binding of these two proteins had functional significance in circadian and/or metabolic physiology.
Endogenous CBS Modulates Circadian Oscillations
Using NIH 3T3 and U2-OS cells stably expressing a Bmal1-luc construct, we evaluated the influence of Cbs and Cry1 on in vitro rhythms. A pool comprised of four individual siRNA constructs that reduced Cbs expression was tested alongside a pool targeted against Cry1 and a non-targeting siRNA control (siNEG). Comparing the pooled results to control, Cbs knockdown shortened circadian period by 1.62 h and 0.69 h in NIH 3T3 and U2-OS cells respectively (p<0.05) (Fig. 4A and B) but did not significantly affect amplitude. The siRNA pools significantly (p<0.009) reduced Cry1 and Cbs mRNA expression, as assessed with real-time PCR. Cbs expression was reduced by 90% in NIH 3T3 cells (Fig. 4C) and by ~85% in U2-OS cells (Fig. 4D) as compared to the siNEG control. Protein level knockdown was confirmed by Western blot (Fig. 4E, F). Since CBS abundance strongly influences methionine concentration, we questioned if this effect might mediate the observed changes in period. The addition of methionine, at various concentrations, did not alter circadian period (Fig. 4G and H). The effect of methionine concentration on cellular circadian amplitude was more complex and may require further study. In NIH 3T3 cells, small increases in methionine (1-5 mg/ml) enhanced circadian amplitude while larger increases in methionine concentration (10-15 mg/ml) dampened rhythms.
Fig. 4: Endogenous CBS expression modulates circadian oscillations in vitro.
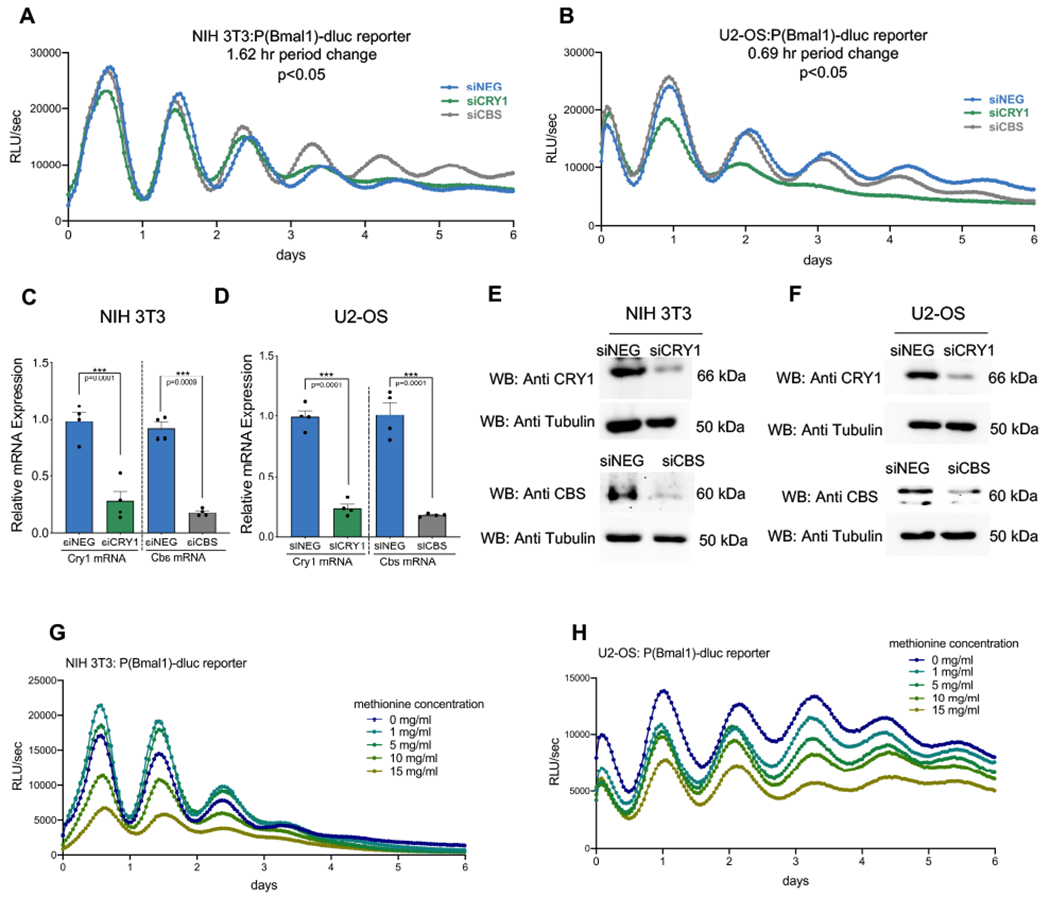
Bioluminescence records quantified as relative light units per second from (A) NIH 3T3:P(Bmal1)-dluc and (B) U2-OS:P(Bmal1)-dluc cells after siRNA mediated knockdown of the specified genes or a non-specific control (siNEG). Cbs knock down shortens the circadian period in NIH 3T3 (p<0.05) and U2-OS (p<0.05) cell lines. Knock down efficiencies in the NIH 3T3 and U2-OS model systems were measured by real-time PCR (C and D) (mean ± SEM, n=4, ***p<0.009) (unpaired, two-tailed t-test). Knock down at the protein level was confirmed by Western blot (E and F). Representative blots from two independent experiments are shown. Representative blots from two independent experiments are shown. Bioluminescence records of NIH 3T3:P(Bmal1)-dluc. (G) and U2-OS:P(Bmal1)-dluc (H) cells under different concentrations of methionine showing no methionine effect on period length.
To examine the role of Cbs in modulating circadian locomotor activity, we used previously described Cbs transgenic mice [27]. Cbs is essential during murine development. To overcome this obstacle, transgenic mice that do not express murine CBS were engineered to express a hypoactive human, mutant CBS (CBS-I278T) under the control of a metallothionein promoter. Zinc driven transgene expression is able to entirely rescue the neonatal mortality [27]. After development, zinc supplementation was removed. Western blot analysis confirms the lack of both endogenous and transgenic CBS proteins in our mice [27]. The genotypes of the animals were confirmed by Western blot (Fig. 5A, Western blot). For brevity, and despite its true genetic complexity, we designate these animals as CbsZn/Zn mice throughout the manuscript.
Fig. 5: Endogenous CBS expression modulates circadian oscillations in vivo.
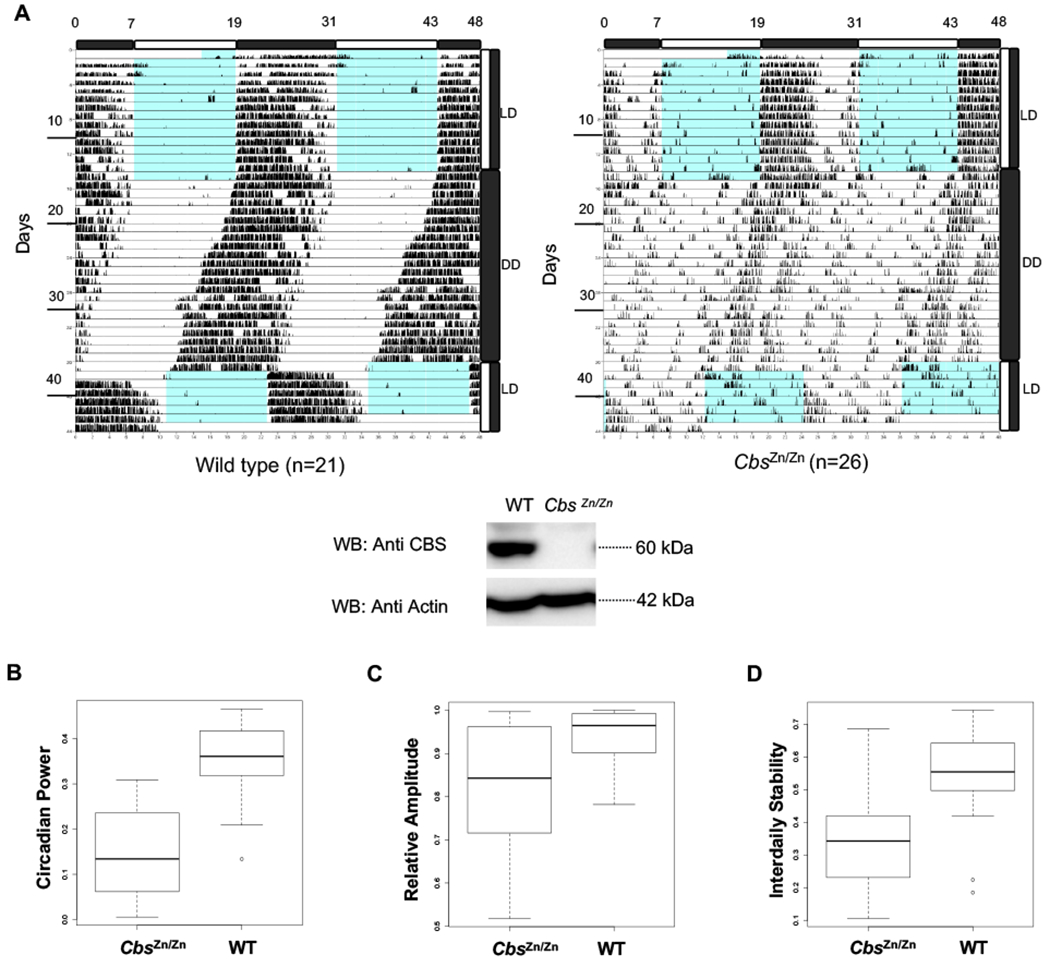
(A) Representative double-plot actograms for the wheel-running activity of 6-8 weeks-old WT and CbsZn/Zn animals entrained in 12:12 LD and then transferred to constant darkness. There was no statistically significant difference in net circadian period. (A-bottom) The genotypes of the CbsZn/Zn animals were verified by SDS-PAGE and Western blot with the indicated antibodies using liver samples. Locomotor activity in DD was analyzed by Fourier transform. Measures of rhythm strength including (B) the fraction of activity power spectrum in the circadian frequency range (period ~21-27 hours) and the non-parametric (C) relative amplitude and (D) interdaily stability indexes are plotted for both WT and CbsZn/Zn animals. Circadian power (p<2.2E-10), relative amplitude (p<0.00039), and interdaily stability (p<0.000046) are all much reduced in CbsZn/Zn mice (Statistical significance assessed using a two-factor ANOVA including gender and genotype).
We assessed the circadian locomotor activity of (n=26) CbsZn/Zn mice along with (n=21) wild type littermate controls. Animals were well entrained to a 12:12 light:dark (L:D) cycle for two weeks before being placed in constant darkness for 20 days. In contrast to the in vitro systems and in accord with experiments with Cry1+/− animals, CbsZn/Zn did not demonstrate a statistically significant change in free-running circadian locomotor period. However, there was a clear change in the amplitude and stability of locomotor rhythms (Fig. 5A). After using a Fourier Transform to construct the spectral profile of activity, we computed the fraction of the total spectral power attributed to cycles in the range of 22-26 hours. CbsZn/Zn animals demonstrated much reduced circadian power (Fig. 5B). Non-parametric measures of circadian activity yielded similar results [28]. The amplitude of activity rhythms, as assessed by the difference in activity between active, and inactive periods was much reduced in CbsZn/Zn mice (Fig. 5C). Similarly, rhythm robustness, as assessed by the interdaily stability index, a measure of the similarity of activity between subsequent days, was also reduced in CbsZn/Zn mice (Fig. 5D). Notably these parametric and non-parametric measures are not simply measuring a reduced total level of activity in the mutant animals as they are effectively normalized by total activity levels.
CBS Modulates the Circadian Repressive Activity of CRY1
The CBS c.833T>C substitution (p.I278T) is present in almost 25% of all homocystinuria patients with CBS mutations [27]. Biochemical analysis of this specific mutant protein indicates that CBS-I278T has much reduced enzymatic activity [29]. We checked if this mutant protein had the ability to interact with CRY1 using mammalian two-hybrid and co-IP tests. Although WT and mutant CBS constructs yielded comparable CBS protein levels, there was reduced interaction between CRY1 and CBS-I278T in mammalian two hybrid assay (Fig. 6A). Co-IP results revealed that there was a physical interaction between WT CBS and CRY1 while a much reduced interaction was observed between CRY1 and CBS-I278T in these conditions (Fig. 6B). This result suggested that CBS-I278T could be used as a negative control in a CRY1 repression assay. To better understand the influence of CBS on CRY1 and circadian transcriptional function, we performed additional experiments. Bmal1 and Clock cDNA plasmids were transfected together with a plasmid containing the Per1 promoter fused to a destabilized luciferase reporter (Per1-dluc). As has been previously demonstrated, overexpression of BMAL1 and CLOCK enhanced Per1-dluc expression in unsynchronized cells. Overexpression of CRY1 or CRY1-R602P, alongside BMAL1 and CLOCK, reduced Per1-dluc activity. Using this assay, HEK293T cells were transfected with appropriate plasmids and we observed that CBS enhances CRY1 repressor activity (Fig. 6C). Since the Per1-dluc assay is sensitive, we examined the level of endogenous CBS in HEK293T cells along with Neuro2A cells. HEK293T and Neuro2A cells have comparable levels of CRY1. However, Neuro2A cells demonstrate much lower endogenous CBS expression (Fig. 6D). We then decided to perform the Per1-dluc assay in Neuro2A cells. We initially showed CBS and GAPDH cannot repress BMAL1/CLOCK driven transactivation in the absence of CRY1 overexpression (Fig 6E). However, CBS overexpression, unlike a GAPDH control (Fig. 6F -columns 7 and 8), enhanced the repressive activity of wild type CRY1 in a dose dependent manner (Fig. 6F -columns 3 and 4). The addition of CBS to a system containing the otherwise functional, but non-CBS binding, CRY1-R602P mutant had no effect of luciferase activity (Fig. 6F-columns 10 and 11). A disease-causing CBS-I278T mutant, which doesn’t interact with CRY1, did not affect the repressive activity of CRY1 (Fig. 6F columns 5 and 6). The expressions of wild type and mutant CBS were assessed by Western blot (Fig. 6G). Taken together, these data demonstrate that CBS-CRY1 binding enhances the repressive activity of the CRY1 on BMAL1/CLOCK driven transcription.
Fig. 6: CBS modulates circadian repressive activity of CRY1.
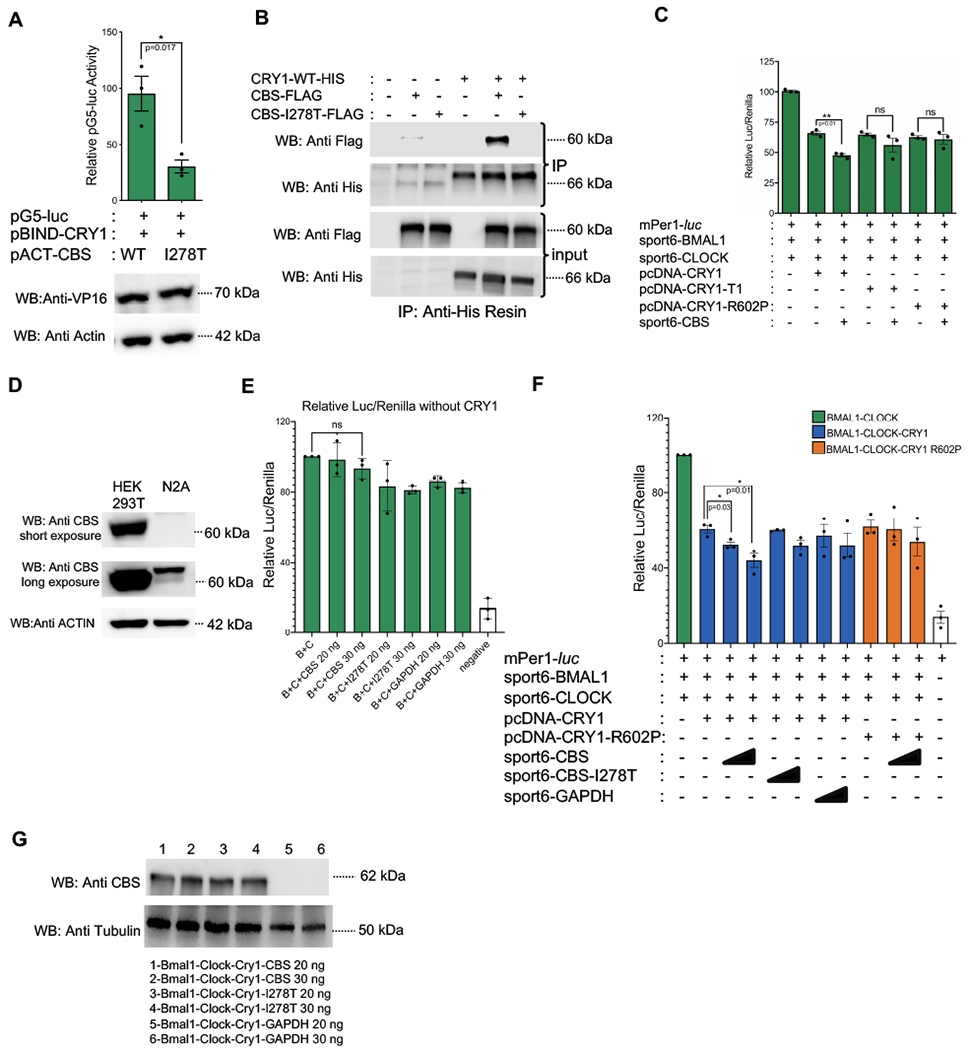
(A) Mammalian two-hybrid (M2H) assay assessing binding between CRY1 and disease-causing mutant CBS (CBS-I278T). The CBS-I278T point mutant significantly reduces the interaction with CRY1 (n=3, mean ± SEM, p=0.017) (unpaired, two-tailed t-test). The blot below shows the levels of CBS WT, CBS-I278T, and Actin expression. (B) Co-immunoprecipitation showing the loss of physical interaction between CRY1 and CBS-I278T. Indicated proteins were overexpressed in HEK293T and His tagged CRY1 was pulled down with Anti-His resin. CRY1 and CBS were detected with Anti-His and Anti-FLAG antibodies in both input and immunoprecipitation (IP) samples. Presented Western blot is a representative of three different experiments. (C) A Per1:dluc reporter assay was used to assess the influence of selected proteins on BMAL1-CLOCK transcriptional activity in HEK293T cells. Luciferase expression was normalized by Renilla luciferase expression (n=3, mean ± SEM, **p=0.01) (unpaired, two-tailed t-test). (D) Western blot assay showing CRY1 and CBS protein amount in HEK 293T and Neuro2A (N2A) cells. CBS protein is greatly less in N2A cells. (E) Effects of wild type and mutant CBS, and GAPDH on BMAL1-CLOCK transcriptional activity on Per1:dluc reporter (mean ± SEM, n=3, ns p=0.11, p=0.75). (F) A Per1:dluc reporter assay was used to assess the influence of selected proteins on BMAL1-CLOCK transcriptional activity in N2A cells. Luciferase expression was normalized by Renilla luciferase expression. (n=3, mean ± SEM, *p=0.01, *p=0.03) (unpaired, two-tailed t-test). (G) CBS protein expression in the Per1:dluc reporter assay samples. Western blots in D and G are representatives of three biological replicates.
We hypothesized that decreased CBS protein abundance would reduce CRY1 mediated repression and increase the expression of direct clock-controlled output genes. We first tested this hypothesis in the U2-OS model system, assessing the expression of the canonical E-BOX output genes Dbp and Per2 after siRNA mediated Cbs knockdown. As shown in Fig. 7A, knocking down Cbs to 10% basal levels increased the expression of both Dbp and Per2. Knocking down both Cbs and Cry1, we observed no significant increase in expression as compared to knocking down Cry1 alone. This is consistent with our hypothesis that the repressive activity of Cbs requires Cry1. We then confirmed these results in vivo, comparing the expression of Per2 and Dbp in the livers of WT and CbsZn/Zn mice sacrificed at ZT12. Dbp and Per2 expression levels were significantly higher in CbsZn/Zn mice (Fig. 7B). Notably, CBS abundance did not significantly influence the expression of CRY1 itself at both protein and mRNA levels (Fig. 7C, D) in either experiment, suggesting that the CBS exerts these effects post-translationally through altered CRY1 repressive activity. Time course data is shown in Fig. 7E shows an overall increase in the expression of these E-BOX targets after Cbs knock down.
Fig. 7: Absence of Cbs increases the expression of clock output genes.
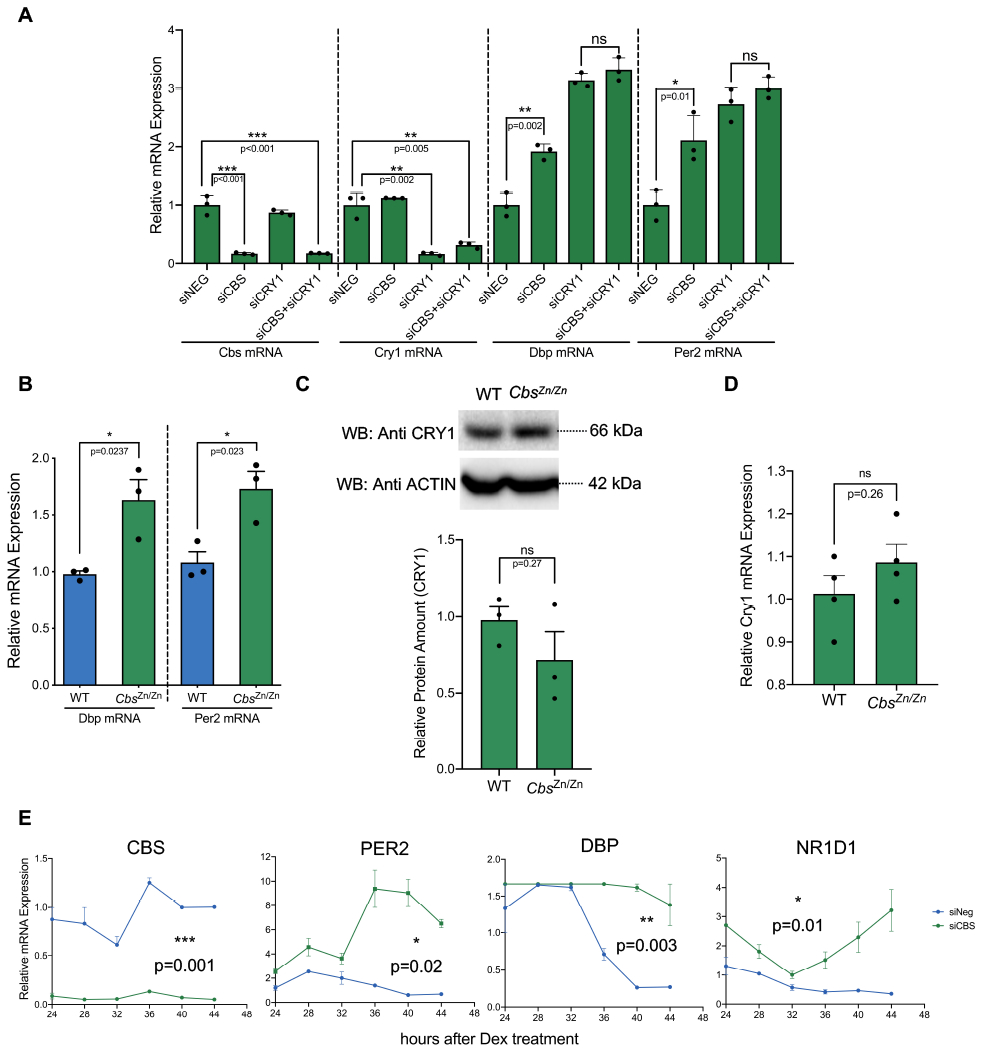
(A) The effect of siRNA mediated Cbs, Cry1 and Cbs-Cry1 double knockdown on the expression of the selected transcripts in unsynchronized U2-OS cells. Relative mRNA expressions were assessed by real-time PCR. (n=3, mean ± SEM, ***p<0.001, **p=0.005, **p=0.02, *p=0.01) (B) Expression of the selected transcripts in the livers of 14 weeks old 3 male WT and CbsZn/Zn animals euthanized at ZT12 and assessed by real-time PCR (n=3, mean ± SEM, *p=0.02) (unpaired, two-tailed t-test). CBS deficiency increased the transcription of Dbp and Per2 without altering the CRY1 protein (C) or Cry1 mRNA (D) levels both in vivo (n=3, mean ± SEM, p=0.27, p=0.26) (unpaired, two-tailed t-test). (E) The effect of siRNA mediated CBS knockdown on the time course expression of the selected transcripts in U2-OS cells. Relative mRNA expressions were assessed by real-time PCR. (n=3, mean ± SEM, ***p=0.001, **p=0.003, *p=0.01, *p=0.02) (knock down effect is analyzed by two-way ANOVA)
CRY1 Regulates the Enzymatic Activity of CBS
In order to investigate the reciprocal influence of CRY1 on CBS enzymatic activity we employed a well-established colorimetric assay based on the production of H2S [30, 31]. Cystathionine-γ-lyase (CSE) also contributes to H2S production in the liver. In order to directly assess the influence of CRY1 on CBS activity, we inhibited the activity of CSE using PAG (DL-propargylglycine) as has been previously described (Fig. 8A) [32]. Despite a background level methylene blue production, the measured enzymatic activity in liver lysate obtained from CbsZn/Zn animals was significantly reduced as compared to the lysate from WT animals (Fig. 8B). Wild type, Cry1−/− and Cry2−/− C57Bl6/J mice were euthanized at either ZT22 or ZT10, when the total cellular abundance of CRY1 is at its peak or trough, respectively [33, 34] (Fig. 3E). Mouse genotypes were confirmed before starting experiments (Fig. 8C and D). Given previous work [35], demonstrating an increase in the amount of the CRY1 in the livers of Cry2−/−, we studied Cry1−/− animals using both WT and Cry2−/− mice as controls.
Fig. 8: Optimization and confirmation for CBS enzyme activity.
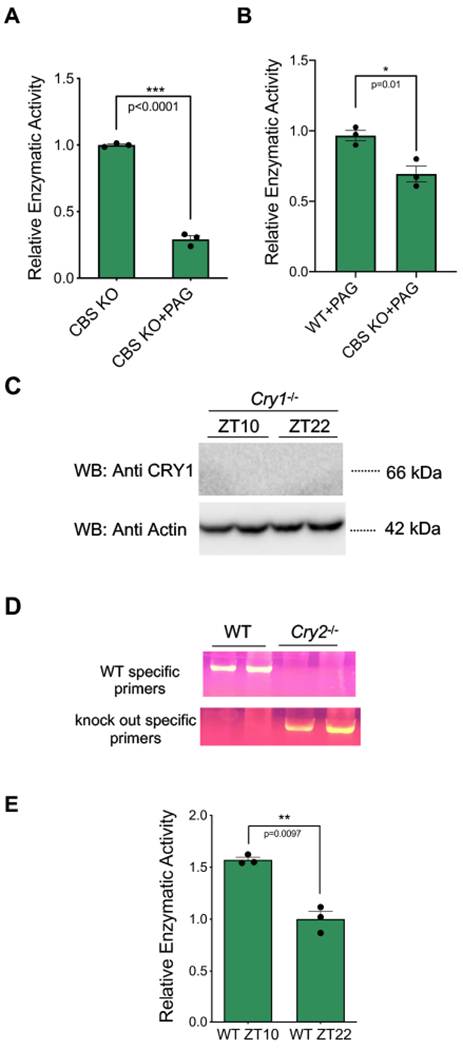
(A) 30 mM PAG (DL-proparglycine) inhibits more than 70% CSE (cystathionine gamma lyase) H2S production activity (n=3, mean ± SEM, ***p=0.0001) (unpaired, two-tailed t-test). (B) CBS in WT animals show significantly more activity than CbsZn/Zn animals in the presence of CSE inhibitor PAG (n=3, mean ± SEM, *p=0.01) (unpaired, two-tailed t-test). (C) The genotypes of the Cry1−/−animals were confirmed with Western blot using liver samples harvested at ZT10 and ZT22. The Western blot presented is representative of three different experiments. (D) Cry2−/−genotype confirmation with PCR showing wild type and Cry2−/− liver genomic DNA samples. Wild type specific and Cry2−/− specific primers were used. A representative gel image from one of three experiments is shown. (E) CBS enzyme activity in wild type samples at ZT 10 and ZT 22 (n=3, mean ± SEM, unpaired t-test, **p=0.009) (unpaired, two-tailed t-test).
We performed Western blots using cell-free protein extracts from WT livers obtained at ZT10 and ZT22. Consistent with the known oscillation in Cbs expression, there was more CBS protein at ZT10 than at ZT22 (Fig. 3C and D). The total CBS enzymatic activity was correspondingly higher at ZT10 (Fig. 8E).
Despite the comparable amounts of CBS at ZT10 across these genotypes, CBS activity was significantly lower in extracts from Cry1−/− animals as compared to WT (Fig. 9A). Similarly, CBS activity was higher in samples from Cry2−/− animals as compared to WT, consistent with the compensatory increase in CRY1 (Fig. 9A and B bottom panels). There was no statistically significant difference in CBS abundance when comparing the livers of WT, Cry1−/− and Cry2−/− animals, euthanized at the same time. (Fig. 9C and D). Thus, CRY1 concentration appears to correlate with CBS enzymatic activity in vivo.
Fig. 9: CRY1 regulates the enzymatic activity of CBS.
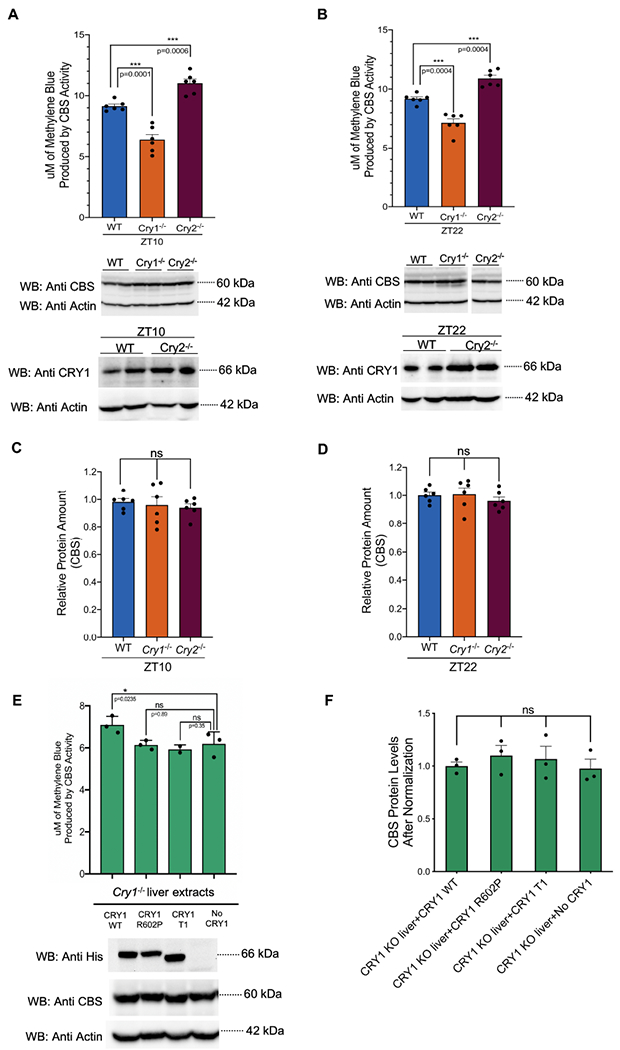
(A- Top) CBS enzymatic activity in wild type (n= 6, 3 males and 3 females), Cry1−/− (n= 6, 3 males and 3 females) and Cry2−/−(n= 6, 6 females) mouse liver samples obtained at ZT10 (14 weeks old) (mean ± SEM, ***p=0.0001, ***p=0.0006) (unpaired, two-tailed t-test). Enzymatic activity is assessed by a colorimetric H2S production assay. (A- Middle) Representative Western blots showing that samples were diluted to equalize CBS protein concentrations. (A- Bottom) Western blot indicating increased CRY1 in Cry2−/− samples. (B) The same data is shown for wild type (n= 6, 3 males and 3 females), Cry1−/− (n= 6, 3 males and 3 females) and Cry2−/−(n= 6, 3 males and 3 females) mouse liver samples obtained at ZT22 (mean ± SEM, ***p=0.0004) (unpaired, two-tailed t-test). All samples in the middle Western blot were run on the same gel. The image of the gel is cut and rearranged to keep the order consistent with the rest of the figure. (C-D) Relative CBS protein image density levels (as compared to Actin control) were quantified and normalized by the WT value for that respective time point. A two factor ANOVA including both Western blot gel identifier and genotype. Genotype did not significantly influence CBS abundance (n=6, mean ± SEM, p=0.41, p=0.72) (p values reflect the influence of genotype in the two factor ANOVA). (E) Complementation assay showing that the addition of exogenous CRY1 WT restores reduced CBS activity in Cry1−/− liver samples (n=3, mean ± SEM, *p=0.023) (unpaired two-tailed t-test) (from 14 weeks old 3 male mice). Non-binding CRY1-T1 or CRY1-R602P mutant proteins did not restore activity. The Western blot at the bottom shows the expression level of CBS, mutant and wild type CRYs used in this experiment (F) Quantification of the CBS amounts in 3 different biological replicates. (n=3, mean ± SEM) (unpaired, two-tailed t-test).
Assay results for ZT22 mice paralleled the results from ZT10 mice (Fig. 9B). In summary, liver lysate samples with absent CRY1 demonstrated reduced CBS activity, while samples with increased abundance of CRY1 demonstrated augmented CBS enzymatic activity in both ZT10 and ZT22.
We questioned if the lack of CRY1-CBS protein binding is sufficient to explain the observed reduction of CBS activity in Cry1−/− liver lysates. We tested if the addition of exogenously overexpressed CRY1 protein would restore CBS activity. Plasmids expressing wild type Cry1, Cry1-R602P and Cry1-T1 cDNA were transfected to HEK293T cells. Addition of extract containing wild type CRY1 protein to Cry1−/− liver extracts increased the relative enzymatic activity of the CBS. The addition of extracts of either CRY1-R602P or CRY1-T1 mutant proteins (both are unable to interact with CBS) did not restore CBS activity to wild type (Fig. 9E). Crude extracts were prepared from each sample and the same amount of the mutant or wild type CRY1 proteins were used in each assay (Fig. 9E, bottom panel). No significant differences were noted in CBS protein abundance (Fig. 9F).
Collectively these data support the theory that the physiologic binding of CRY1 to CBS enhances CBS enzymatic activity both in vivo and in vitro. Thus, while the circadian variation of CBS abundance has a strong influence on enzymatic activity, physiological levels of CRY1 protein have a direct and measurable effect at both time points.
Metabolomic studies support the importance of CBS-CRY1 interactions in vivo
We hypothesized that CRY1, through its dynamic binding of CBS, might influence CBS enzymatic activity and the critical pathways that depend on it (e.g. homocysteine metabolism). In order to compare the changes resulting from Cbs and Cry knockouts, we performed two independent, metabolomic studies.
Analyzing liver samples from mice euthanized at ZT12, we first identified metabolomic differences comparing CbsZn/Zn mice and WT littermate controls (n=23, ~5-6 mice of each gender and genotype). The influence of CBS genotype was far-reaching: A two factor ANOVA including gender and genotype identified 81/194 metabolites significantly modulated by CBS genotype (> FDR of 5%) (File S1). KEGG pathway analysis demonstrates that homocysteine and methionine pathway components were strongly overrepresented among the CBS affected metabolites (Fig. 10A- vertical axis and File S2) [36]. Moreover, the metabolites influenced by CBS genotype played a central role in this pathway as assessed by network centrality (Fig. 10A- horizontal axis).
Fig. 10: Metabolomic analysis of CBS and Cryptochrome Mutants.
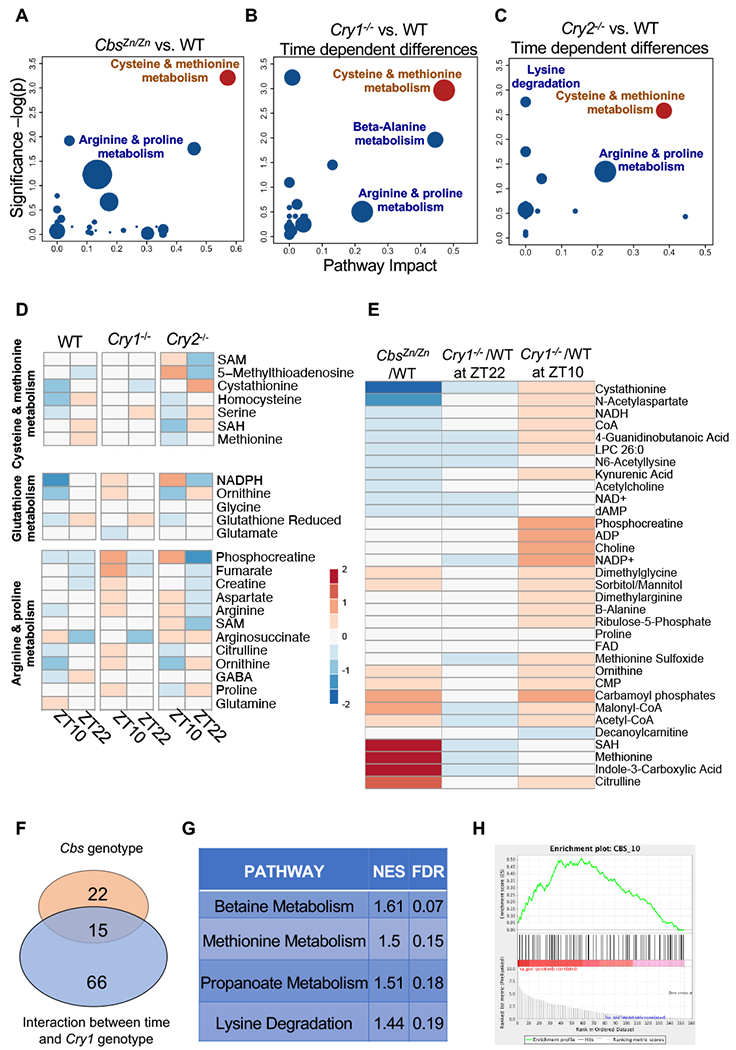
(A) Pathway overrepresentation describing metabolomic changes in the liver of CbsZn/Zn animals. Metabolites differentially abundant (FDR <5%) between CbsZn/Zn and WT littermate controls were compared to the full list of tested metabolites. KEGG pathways that are overrepresented among CBS affected metabolites are shown. The vertical axis shows the significance of overrepresentation. The horizontal axis depicts the importance of the CBS affected metabolites in the pathway as assessed by network centrality. Cysteine and methionine metabolism are strongly affected by the CBS deficiency. (B) Pathway overrepresentation describing liver metabolites influenced by the interaction of Cry1−/−genotype and circadian time. Metabolites modulated by the interaction between cryptochrome genotype (Cry1−/− vs WT) and circadian time (ZT10 vs ZT22) were identified by ANOVA (p <0.05). Cysteine and methionine metabolism are strongly affected by the interaction, consistent with the hypothesis that CRY1 binds CBS and dynamically alters its enzymatic efficiency. (C) Metabolites modulated by the interaction between cryptochrome genotype (Cry1−/− vs Cry2−/−) and circadian time (ZT10 vs ZT22) were identified by ANOVA (p <0.05). (D) Heatmaps showing the influence of time and genotype on the concentration of the listed metabolites. Metabolites are organized by KEGG pathway. (E) Heat map comparing the metabolomic influence of CBS deficiency (in CbsZn/Zn mice) with the dynamic metabolomic influence of CRY1 genotype. Metabolites significantly affected by the interaction between CRY1 genotype and time (p< 0.05) are shown. At ZT22, when CRY1 expression is highest in WT animals, the metabolite differences between WT and Cry1−/−mice appeared similar to the differences between WT and CbsZn/Zn mice. (F) Venn diagram showing overlap of individual metabolites significantly modulated in the two experiments. The blue circle depicts metabolites significantly affected by CBS genotype. Pink depicts metabolites influenced by the interaction between circadian time and Cryptochrome genotype. (G) Set enrichment analysis was performed on the full list of measured metabolites, ranked by the significance of the interaction term between time (ZT10 vs. ZT22) and genotype (Cry1−/− vs. WT) in the ANOVA. Annotated metabolite sets were obtained from the Small Molecule Pathway Database. The statistical significance of enrichment and the Normalized Enrichment Score (NES) for each set is shown. (H) Metabolites were ranked by the significance of the interaction term between time (ZT10 vs. ZT22) and genotype (Cry1−/− vs. WT) in the ANOVA. An enrichment plot shows the enrichment of a custom set of metabolites defined by responsiveness to CBS deficiency.
We next compared liver samples from Cry1−/− and WT mice sacrificed at either Z10 or ZT22 (n=5 or 6 of each gender and genotype at both time points) (Fig. 10B). Reasoning that CBS-CRY1 interactions depend on CRY1 abundance and thus circadian time, we hypothesized that Cry1−/− animals would demonstrate altered temporal modulation of CBS dependent metabolites. Hence, we analyzed these Cry1−/− vs WT data using a 3-factor ANOVA that included time, genotype, and gender (File S3). We identified metabolites modulated by the interaction between circadian time (ZT10 vs. ZT22) and CRY1 genotype (Cry1−/− vs. WT). Thirty four of 178 measured metabolites were identified at a p-value <0.05. Fifteen were identified at an FDR <15%. Pathway overrepresentation analysis with Metaboanalyst [37] was consistent with our hypothesis and demonstrates that the most prominent, time-dependent differences between Cry1−/− and WT mice occurred in homocysteine and methionine metabolism (Fig. 10B). Data from Cry2−/− female mice provide additional support. Knowing that Cry2−/− mice would have a compensatory increase in CRY1 abundance [35], we used Cry2−/− mice as a model of CRY1 overexpression. We characterized the hepatic metabolome in an available group of female Cry2−/− mice euthanized at either ZT10 or ZT22 (n=6 at both times). Again using ANOVA, we compared these data to the data from the female Cry1−/− mice. We identified metabolites modulated by the interaction of genotype (Cry1−/− vs. Cry2−/−) and time (ZT10 vs. ZT22) and performed KEGG pathway analysis. As in the comparison with WT mice, Cystathionine metabolism was among the most strongly influenced pathways (Fig. 10C).
We then focused on the individual measured metabolites that are part of the KEGG pathways describing the metabolism of cysteine, methionine, and glutathione. Fig. 10D depicts the abundance of these metabolites in WT, Cry1−/−, and Cry2−/− mice at both ZT10 and ZT22. In particular, when compared to data from WT mice, most of these metabolites generally exhibit blunted circadian variation in Cry1−/− mice and augmented circadian variation in Cry2−/− mice. These results are consistent with a dynamic CRY1 mediated increase in CBS activity. Differences were also noted in metabolites and pathways closely connected to cystathionine and homocysteine metabolism including lysine, arginine and proline metabolism. This suggests more distributed changes in amino acid metabolism. Here too, circadian modulation was generally augmented in Cry2−/−mice while the circadian differences in Cry1−/− mice were often blunted or sometimes reversed as compared to WT.
The heatmap shown in Fig. 10E focuses on the 34 metabolites we identified as being significantly modulated (p <0.05) by the interaction between circadian time (ZT10 vs. ZT22) and CRY1 genotype (Cry1−/− vs. WT). Fig. 10E compares the influence of time and cryptochrome genotype with the influence of CBS genotype. At ZT22, CRY1 expression peaks in WT animals and is expected to enhance CBS activity. Hence, we hypothesized that at ZT22, the metabolic differences between WT and Cry1−/− (Fig. 10D middle column) would generally resemble the differences between WT and CbsZn/Zn mice (Fig 10D left column). On the other hand, at ZT10 CRY1 expression is at its nadir and the influence of CRY1 expression on CBS activity is expected to diminish. Indeed, evaluating the influence of the Cry1−/− genotype at ZT22 and comparing to WT (Fig 10D left column), we find the metabolomic differences between Cry1−/− and WT animals were muted and, in a few cases, reverse direction. For example, the levels of the cystathionine and NADP+ are lower in CbsZn/Zn mice as compared to controls. When comparing Cry1−/− mice and controls, this same relationship is observed at ZT22 but not ZT10. Fig. 10F shows the significant overlap of metabolites influenced by CBS genotype and metabolites influenced by the interaction between circadian time and Cryptochrome genotype.
All of the above analysis is, at least in part, dependent on the choice numerical cutoffs (e.g. p<0.05) and the specific of the metabolic database (e.g. KEGG) that were used [38]. To confirm the robustness of our result we reevaluated the Cry1−/− vs WT ANOVA results applying metabolite set enrichment analysis. We reanalyzed the full list of tested metabolites ranked by the significance of the genotype (Cry1−/− vs WT)-time interaction. Using independent metabolite annotations provided by the Small Molecule Database, methionine metabolism was again among the pathways demonstrating the strongest enrichment (Fig. 10G). We then defined a custom set of metabolites significantly influenced by CBS genotype (FDR <10%). Repeating the set enrichment analysis but now using this custom metabolite set we find that those metabolites influenced by the interaction of time and cryptochrome genotype are significantly enriched with CBS influenced metabolites (p<0.05).
Of note, metabolomic data from the WT mice used in these experiments allows us to gauge the quality of our quality our data and compare it to prior studies. Based on separate ANOVA analyses of these two experiments, 30 metabolites were identified as being significantly influenced by gender in the WT animals for the Cry1−/− experiment while 29 were identified in the WT animals from the CbsZn/Zn experiment (FDR <15%). The overlap of 11 metabolites was highly significant (p<0.001). Notably many of these metabolites, including carnitine derivatives, have been identified as showing sexually dimorphic abundance in several tissues including liver [39]. In addition, the control data from the Cryptochrome experiments included WT animals euthanized at ZT10 and ZT22. Nine of the 18 “core circadian metabolites’’ identified” identified by Krishnaiah et al [14] showed temporal variation in our data (p <0.05, ANOVA including time and gender). These metabolites include L-histidine, Glutathione, phosphocholine, UDP-glucose, methionine, SAH, cystathionine, and 1- methylnicotinamide. Set enrichment analysis of these ANOVA results demonstrated differences in pathways relating to purine, pyrimidine, and glutamate metabolism consistent with earlier findings [2].
In summary, these metabolomics results demonstrate that the physiologic expression of CRY1 influences hepatic metabolomic profiles in a manner consistent with its ability to enhance CBS enzymatic activity.
Discussion
In addition to controlling locomotor behavior, the clock adjusts metabolic pathways in anticipation of daily changes in nutrient flux and energy needs [15]. Recent studies have highlighted the bi-directional regulation between circadian rhythms and metabolic pathways in mammals [7]. The molecular mechanism(s) underlying this regulation are, however, not well understood. In this study, we provide direct evidence that CRY1 and CBS interact both physically and functionally, contributing to the transcriptional regulation of clock-controlled genes, and more strikingly the post translational regulation of methyl cycle and amino acid metabolisms.
Proteins in the Photolyase/Cryptochrome family perform diverse functions in various organisms [40]. Sequence alignment analysis shows that CRYs have variable extended C-terminal domains that range from 30 to 300 amino acids [40]. The Intrinsically Disordered Region (IDR) of the C-terminal domain enables cryptochrome proteins to interact with various proteins, facilitating tissue and organism specific functions [40]. Our study indicates that Arg602 in the IDR region of CRY1 is essential for the interaction with CBS (Fig. 1). Further experiments showed that this interaction modulates the activity of both proteins. CBS enhances CRY1 repression activity while CRY1 in turn enhances CBS enzymatic activity (Fig. 6 and Fig. 9). The effect of CBS on CRY1 activity is likely to be important for the control of circadian period at the cellular level (Fig. 4) and may play a role in diet induced circadian alterations in the liver. While developmental effects cannot be excluded, CBS appears to contribute to the strength and robustness of in vivo circadian locomotor activity without affecting the period (Fig. 5). Several previously identified clock gene modifiers and mutants have different or more extreme effects on in vitro rhythms as compared to in vivo locomotor behavior [41]. In particular our in vitro analysis suggested that Cbs deficiency reduces but does not nearly eliminate CRY1 mediated repression. Cry1 knockdown reduces in vitro period but heterozygote Cry1−/+ mice do not demonstrate a circadian impairment in behavior [42].
Our metabolomics results highlighted the physiologic importance of this interaction. The reduction of CRY1 alters one carbon and amino acid metabolism, metabolic reactions that are central to life. The core circadian proteins CRY1, CRY2, PER1, PER2, BMAL1, and CLOCK all bind the CBS gene with CRY1 specifically binding its promoter [43]. A recent study demonstrated that the accessory circadian protein NR1D1 also binds the CBS promoter [24]. Nascent-seq and other studies highlight the importance of active, circadian regulation of CBS mRNA degradation [44, 45]. Thus, the post-translational regulation of CBS enzymatic activity by CRY1 binding provides yet another level of regulation. We speculate that this non-transcriptional influence of CRY1 on CBS activity has several key advantages. The circadian production and degradation of proteins is energetically costly. As the increases and decreases in CBS and CRY1 abundance are, well synchronized in the cytoplasm (Fig. 3F and G), where CRY1 can increase enzymatic efficiency while moderating the protein synthesis burden. Alternatively, in the nucleus, differently timed interactions may blunt CBS induced changes in redox potential and SAM availability, while allowing metabolic feedback on transcriptional circadian rhythms. We suspect that multi-leveled circadian control of CBS reflects the importance of methyl cycle and amino acid metabolism and cellular physiology. This regulatory role of CRY1 in modulating CBS activity adds to its known ability to bind and modulate G-proteins [46].
CBS and CRY1 demonstrate temporally and spatially dynamic cellular distributions. Our initial analysis focused on ZT22 and ZT10 because these are the times of peak and trough CRY1 abundance in whole cell lysates. The abundances of CRY1 and CBS are anti-phasic in whole cell lysates (Fig. 3C and E). However, the bulk of CRY1 is localized to the nucleus and the bulk of CBS is localized in cytoplasm. While we only measured two time points, focusing specifically on cytoplasmic CRY1 and CBS levels the two proteins appear to be in-phase in cytosol (Fig. 3F and G). A full understanding of this biology will likely require a more detailed time course analysis separately evaluating nuclear and cytoplasmic fractions. Indeed, we hypothesize that the sometimes-modest metabolic effects we observed may underestimate larger differences likely observed following peak and trough cytoplasmic levels.
While we have focused on the role of CBS in the synthesis of cystathionine, in the last decades the role of CBS in the synthesis of H2S has received increased attention. Indeed H2S production was directly assessed in the colorimetric assays used in the enzymatic studies above as it utilizes same CBS domains and binding sites. H2S, a gaseous transmitter, plays an important role in many physiological processes [47]. Three enzymes can independently catalyze the formation of H2S: (1) CBS, (2) cystathionine-γ-lyase (CSE) and (3) 3-mercapto-sulfurtransferase (3-MST). CBS is present in highest abundance in the central nervous system, liver and pancreas. CSE is primarily responsible for H2S production in the cardiovascular system [48]. 3-MST is located predominantly in the mitochondria and produces H2S in concert with cysteine aminotransferase. Thus, we hypothesize that the CRY1 might directly influence H2S production in brain and liver through its interaction with CBS. H2S signaling is important in maintaining proper CNS function [49]. Dysregulated H2S has been implicated in neurodegenerative diseases, including Alzheimer’s disease [50]. Our data suggest the possibility that CNS H2S production is post-transcriptionally modulated by the CRY1 and molecular circadian clock. Disturbed clock function is often a hallmark of neurodegeneration. We can only speculate if disturbed circadian rhythms in H2S production contribute to, or are a consequence of, neurodegenerative diseases. Of equal clinical interest, the relationship between H2S, CBS function, and cancer has been the subject of several recent investigations [51]. CBS mediated overproduction of H2S in colorectal and ovarian cancer cells enhances cell proliferation, migration and cellular bioenergetics. As CRY1 enhances CBS activity and H2S production, CRY1-CBS interactions could be a potential new chronotherapeutic target.
Studies with clock-disturbed mice provide increasing evidence for the importance of intact circadian rhythms for healthy metabolism. A recent study showed that 50% of evaluated metabolites exhibit a circadian rhythm in the liver [14]. Many metabolic signaling molecules also demonstrate robust circadian regulation [52]. For example, the circadian clock is required for the secretion of insulin and proper development of the beta cells in the pancreas [53]. Metabolic feedback on the regulation of core clock proteins has been described, including cross-talk between core clock proteins, nuclear receptors [54], and histone deacetylases [55, 56]. Recently, it has been shown that CLOCK directly acetylates argininosuccinate synthase to regulate arginine biosynthesis [57]. Here, we provide evidence that a new mode of bi-directional regulation, where CRY1 directly interacts with a key enzyme, CBS, enhancing its activity and regulating one-carbon and urea metabolism. Metabolomic analysis of liver samples obtained from Cry1−/−, Cry2−/−, and WT mice allowed us to demonstrate the significance of this dynamic interaction at physiological abundances (Fig. 10).
Notably CRY1 does not appear to interact with the clinically important CBS-I278T mutant (Fig. 6A and B). CBS-I278T is the cause of 25% of all CBS related homocystinuria disorders [27]. Our data raises the possibility that CBS-I278T mutation also disrupts the circadian modulation of cysteine and amino acid metabolism. Timed administration of folate which has short serum half-life may help restore the metabolic rhythms. The clinical importance of these rhythms will need to be assessed.
In conclusion, our findings indicate that physiologic CBS-CRY1 binding influences circadian physiology and metabolism. CBS-CRY1 interactions provide a post-translational switch regulating the spatio-temporal activity of CBS and CRY1. In the cytosol, CRY1 and CBS abundances both peak near ZT10 when the enhancement of CBS activity has the greatest potential effect. In the nucleus, CBS likely acts at a different time modulating the repressive activity of CRY1 on BMAL/CLOCK-driven transcription (Fig. 11). While the details of the interaction will need to be more thoroughly studied, this work highlights the importance of post-translational mechanisms in coupling central metabolic pathways with circadian control. It also opens up avenues for the study and treatment of CBS related disease.
Fig. 11:
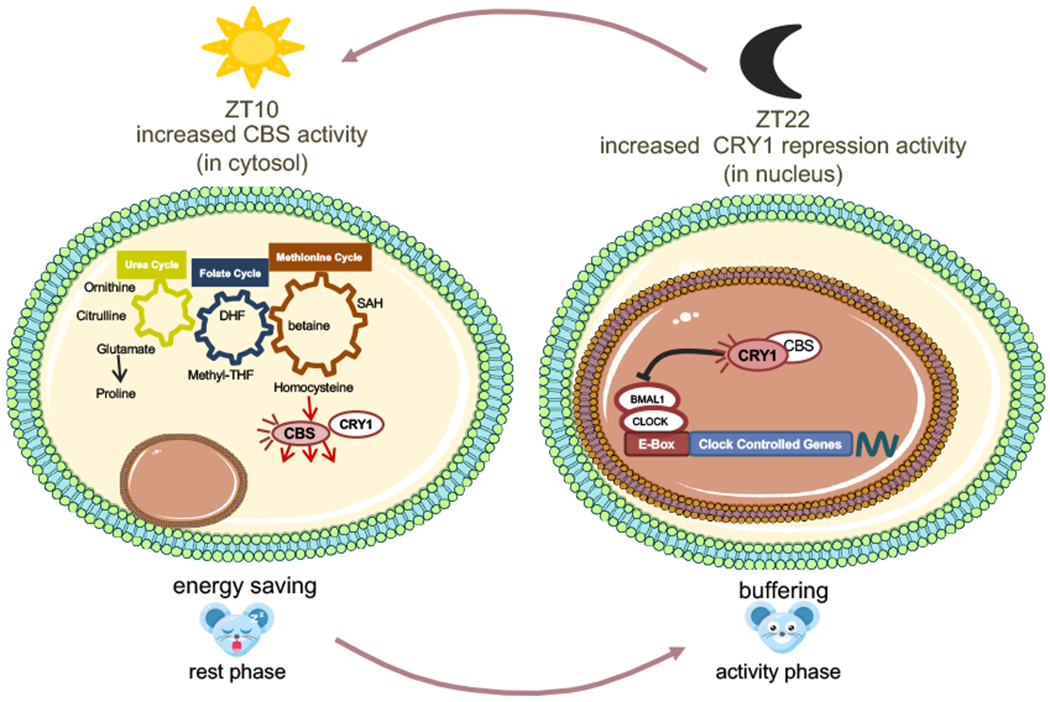
Model of CRY1-CBS interactions directly linking circadian and metabolic functions. When cytosolic CRY1 abundance is high (ZT 10 compared to ZT 22), CBS enzymatic activity is enhanced. The energetic costs that would be required to synthesize new CBS enzyme are reduced. When nuclear CBS concentration is higher (ZT22 as compared to ZT10) CBS enhances the repressive activity of CRY1 in local tissue clocks.
Materials and Methods
Reporter Assays with Transient Transfection
Plasmid Constructs
Bmal1, Clock, Per1, Per2, Per3, Cry1, Cry1-T1, Cry1-R602P and Cry2 were subcloned into the pBIND vector and Cbs and Per2 were subcloned into the pACT vector for Mammalian-Two-Hybrid experiments according to the instructions of Promega CheckMate™ Mammalian Two-Hybrid System. Luciferase gene pG5-luc was used as the reporter gene, while pGL4-Renilla was used for normalization of transfection efficiencies. Cbs, Cry1, Cry1-T1, Cry1-R602P, Bmal1 and Clock were subcloned into pCMV-sport6 vector separately for repression assay. An mPer1-luc construct was used in the transfection based-reporter assay.
Mammalian-two-hybrid
For mammalian two-hybrid assays, 25 ng of pGL5, 5 ng Renilla luciferase, 50 ng pACT, and 50 ng pBIND plasmids were transfected into HEK 293T cells in 96-well plates as previously described [18]. Transfected cells were analyzed after 30 h incubation for luciferase reporter activity with DualGlo luciferin reagent (Promega) using a luminometer (Thermo Fluoroskan Ascent FL). The firefly luciferase activity was normalized using Renilla luciferase for transfection efficiency.
Per1-Luc Reporter Gene Assay
Neuro2A (N2A) cells were grown in DMEM with 10%FBS. The day before transfection, cells were seeded into 10-cm dishes to have 80% confluency on the next day. Cells were transfected with Fugene HD (Promega) transfection reagent with the indicated amount of plasmids: 50 ng pCMV-sport6-Bmal1, 125 ng pCMV-sport6-Clock, 50 ng mPer1-luc, 5 ng pGL4-Renilla, 3 ng pcDNA-Cry1 (or pcDNA-Cry1-R602P), 20 or 30 ng pCMV-sport6-Cbs, or pCMV-sport6-Cbs I278T, or pCMV-sport6-GAPDH and empty pCMV-sport6 in order to bring the total DNA amount to 300 ng. The preparation of cell lysates and dual luciferase assay were carried out according to the manufacturer’s protocol (Promega). After 24 h, activity of both firefly and Renilla luciferase was measured using a luminometer (Thermo Fluoroskan Ascent FL). The firefly luciferase activity was normalized using Renilla luciferase for transfection efficiency. All experimental results are the average of three independent experiments.
Cell Based Circadian Assay
Either U2-OS or NIH3T3 cells were plated on 35-mm dishes, cultured for 1 day in siRNA medium (DMEM (Gibco) with 10% fetal bovine serum and 2 mM L-Glutamine (Gibco)) to reach 80-90% confluency [58]. Then, cells were transfected with the following siRNAs (Allstars Negative Control siRNA (Cat. No. 1027280), Hs Cbs siRNA mix (Cat. No. SI03058391, SI02777159, SI00001316, SI02777166), Mm Cbs siRNA mix (SI00942606, SI00942620, SI00942613, SI00942599), Hs Cry1 siRNA mix (SI00059430, SI00059416, SI04434780, SI02757370), Mm Cry1 mix (SI02708041, SI02686271, SI02666580, SI02732086) using the Thermo Scientific Lipofectamine RNAiMAX Reagent manufacturer’s instructions. After 2 days, dexamethasone (final 0.2 µM) was added to the medium. After 2 hours of incubation, the medium was replaced with medium (DMEM (Sigma, D2902) supplemented with 10 mM HEPES, 0.35 mg/ml sodium bicarbonate, 100 μg/μl Streptomycin and 100 μg/μl Penicillin (Gibco), 2 mM L-Glutamine (Gibco) and 1 mM luciferin, pH 7.2) and the luminescence was recorded every 10 minutes for 6 days in U2-OS: P(Bmal1)-dluc and NIH 3T3: P(Per1)-dluc cells.
In vitro Experiments
Bimolecular Fluorescence Complementation (Bi-FC)
HEK293T cells in 6-well dishes were transfected with venus plasmids (200 ng CRY1-VC (venus C-terminal, 300 ng CBS-VN (venus N-terminal) and 200 ng pmCherry-C1 plasmids) by using Fugene HD (Promega). At 24 h post-transfection, the cells were visualized using the YFP and mCherry fluorescence microscopy filter sets as described in [11].
Co-immunoprecipitation
HEK 293T cells were grown in Dulbecco’s modified Eagle’s medium (DMEM; Invitrogen) supplemented with 10% fetal bovine serum. The day before transfection, 4 × 10⁵ cells were seeded and then a total of 2 μg of equimolar amounts of plasmid DNA constructs (Cry1-pcDNA (either wild type, or T1, or R602P) and Cbs-pCMV-sport6 (either wild type or I278T) were transfected into the cells with Fugene HD (Promega). Cells were incubated for 48 hours and then DMEM was removed. After washing the cell with PBS 3X, cells were collected by centrifugation at 1000 xg at 4ºC for 5 minutes. Pellets were resuspended, dissolved in lysis buffer (50 mM pH 8 Tris-Cl, 150 mM NaCl, 1 mM EDTA and 1% Triton-X supplemented freshly with Protease Inhibitor Cocktail (Sigma)) and sonicated 2 times for 10 seconds with 15% power (Bandelin, Germany). Samples were centrifuged at 14000xg at 4ºC for 40 minutes to get rid of cellular debris. Anti-FLAG M2-FLAG resin or Ni-NTA-His resin equilibration was achieved by washing the resin 2 times with TBS to equilibrate with lysis buffer. Then resin was added to cleared cell lysate and incubated at 4 oC overnight. The next day, beads were washed 3 times with TBS to eliminate non-specific binding, and then beads were boiled with 6x loading dye and elutes were processed for Western blot.
Generating CRY1 Mutant Library and Lentiviral Cloning Processes
Construction of CRY1 Mutant Library Using Degenerate Primers
Random mutagenesis of the last 20 amino acids of the pACT-mCry1 construct was performed with degenerate reverse primers. PCR was performed in a total volume of 50 μl containing approximately 50 ng of plasmid samples, 20 pmol of each primer, 0.2 mM dNTPs, and 2.5 unit Phusion Taq DNA polymerase. Conditions for the 18 cycles of amplification were 95°C for 30 s, 50°C for 30 s and 68°C for 14 min. Before the first cycle, reaction mixtures were kept at 95°C for 4 min and at the end of the 18th cycle an additional 68°C extension period was applied for 10 min. Samples were then treated with DpnI restriction enzyme to remove the template DNA and transformed into E coli DH5α. Transformed cells were plated and selected on appropriate selective media. Mutagenesis results were verified by DNA sequencing carried out by Macrogen (Amsterdam, Netherland).
Site Directed Mutagenesis
PCR-based site directed mutagenesis was performed to generate the CRY1-R602P mutant. The PCR reaction contained 30 fmol of DNA, 20 pmol of primers, 0.2 mM dNTPs, and 2.5 units of Pfu Turbo DNA polymerase. The PCR was carried out for 12 cycles under the following conditions: 40 s at 94 °C, 40 s at 55 °C, and 11 min at 68 °C. The PCR products were digested with DpnI to remove template plasmid DNA and transformed into E. coli DH5α. The presence of the site-directed mutations was confirmed by DNA sequencing through the Macrogen sequencing facility.
Immunoblotting
Cell lysates were mixed with Western Blot loading dye (final concentrations, 50 mM Tris-Cl, 2 mM EDTA pH 8, 1 % SDS, 1% beta-mercaptoethanol, 8% glycerol, 0.02% bromophenol blue) and boiled for 5 minutes at 95 ºC. Samples were subjected to 10% SDS-PAGE to separate proteins. Proteins were transferred to PVDF membrane (Millipore, Immobilon-P-Transfer Membrane) using a BioRad wet-transfer system. After transfer, the membrane was blocked with 5% non-fat milk (Chem Cruz SC2325) prepared in 0.15% TBS-T (Tris-buffered saline with 0.15% tween 20)(Sigma Aldrich Tween 20). After blocking, the membrane was incubated for 45 minutes with either Anti-HIS antibody (Santa Cruz SC-8036), Anti-FLAG antibody (Sigma A9469), Anti-CRY1 antibody (Bethyl), Anti-CBS antibody (Abcam ab54883), Anti-VP16 (Santa Cruz, sc-7545), Anti GAL4 DBD (Santa Cruz, sc-577), Anti ACTIN (Cell Signaling, 8H10D10), Anti α-TUBULIN (Sigma, T9026), or Anti HISTONE-H3 (Abcam, ab1791). Following primary antibody incubation, the membrane was washed 3 times with 0.15% TBS-T for 5 minutes. Then, membranes were incubated with secondary antibodies, either anti-mouse (Santa Cruz SC-358920), or anti-rabbit (abcam ab97051), for 50 min. Next, membranes were washed 3-times with TBS-T for 15 min total. In order to visualize the membrane with chemiluminescent detection, Advansta ECL HRP substrate was used (WesternBright Sirius). Images were taken and quantified by BioRad Chemidoc. Similar procedure was used for gradient blue native-PAGE analysis by preparing the samples without using SDS or any denaturant. Gradient native gel (from 3 to 10 %) was used. The pH of running buffer was adjusted to 7.8 which provides negative charged BSA and CBS proteins, since their isoelectric points are close (5.4 and 5.9 respectively).
RNA Isolation and Real-Time PCR
RNA Isolation
RNA isolation was performed from both cells and livers with RNeasy Mini Kit (Qiagen Cat. No.74106).
cDNA Synthesis
RevertAid First Strand cDNA Synthesis Kit (Thermo) was used for cDNA synthesis.
Real-Time PCR
SYBR Green real time PCR mix was used with real time PCR primers of target genes.
Cystathionine-Beta Synthase Enzymatic Activity Detection
Liver Lysate Preparation and Determination of CBS Enzymatic Activity
A total 12 mg of mouse liver was homogenized with Dounce homogenizer for 5 minutes in phosphate buffer with pH 6.8 with protease inhibitor. After homogenization, samples were sonicated 6 times for 8 seconds with 90 % power and were centrifuged at 20,0000 xg at 4ºC for 45 min. The supernatants, or cell free extracts were used to assay CBS activity. Each reaction consists of 100 mM potassium phosphate buffer (pH 7.4), 10 mM L-cysteine, 2.5 mM pyridoxal-5-phosphate, 30 mM DL-proparglycine (PAG), 100 µg of total protein and 2.5 mM homocysteine in total volume of 800 µl. To minimize the confounding influence of CSE activity on our results, we included DL-proparglycine, an inhibitor of CSE in these experiments. A second tube that included 750 µl 1 % zinc-acetate and 50 mg cotton were placed in the reaction tube to capture produced gaseous hydrogen sulfide. After the mixing of the 1,5-2 mg of liver with the reaction mixture, nitrogen gas was applied for 5 minutes inside of the tubes in order to deplete oxygen, and reactions were carried out for 1.5 h at 37 ºC. Reaction were terminated by mixing with 500 ul 50% trichloroacetic acid. Then, the pieces of cotton were removed from the outer tubes to measure the amount of H2S. Cotton was transferred to glass tubes containing 3.5 ml distilled water. Then following reagents were added to each sample for color development: 400 µl 20 mM N,N-dimethyl-p-phenylenediamine sulphate prepared in 7.2 M HCl, and 400 µl 30 mM FeCl3 prepared in 1.2 M hydrochloric acid. After color development, the absorbance of each sample at 670 nm was measured in a microplate reader (Synergy H1 Multi-Mode Reader-Biotek) so as to calculate the amount of product.
Cytosol-Nuclear Fractionation
Wild type animal livers harvested at ZT22 and ZT10 were used for fractionation analysis. 10 mg liver was suspended in 500 ul cytosolic lysis buffer (10 mM HEPES pH 7.9, 10 mM KCl, 0.1 mM EDTA, 0.05 % NP40 with protease inhibitors) and incubated on ice for 10 minutes. The lysate was centrifuged for 3 minutes at 4,000 xg at 4 ºC. The resulting supernatant was centrifuged one more time and supernatant collected as the cytosolic fraction. The resulting pellet from lysate centrifugation was suspended in nuclear lysis buffer (20 mM HEPES pH 7.9, 0.4 M NaCl, 1 mM EDTA, 10 % glycerol with protease inhibitors) and sonicated 2 times 10 seconds with 60% power. After centrifugation at 15,000 g for 5 minutes at 4 ºC, the supernatant was collected as nuclear fraction. Collected fractions were mixed with Western Blot loading dye. Fractionation efficiency was checked with Western blot by using TUBULIN (Sigma T9026) as cytosolic marker and HISTONE-H3 (abcam ab1791) as nuclear marker.
Generation of Cry1−/−, Cry2−/− and Cbs −/− Mice
For the generation and maintenance of Cry1−/− or Cry2−/− mice, methods were performed as previously described in [34]. Briefly, the original Cry1−/− or Cry2−/− lines of partial C57BL/6J background were repeatedly backcrossed with C57Bl/6J mice to generate Cry1−/− and Cry2−/− mice. The homozygous Cry1−/− and Cry2−/− mice were entrained to a 12 hour light:dark cycle with ad libitum food and water. After approximately 8 weeks, mice were sacrificed by asphyxiation with CO2 at either ZT10 or ZT22.
Liver samples were frozen instantly. During the generation of CbsZn/Zn mice, controlled expression of mutant human CBS rescued neonatal lethality as described by Wang et al [27]. Briefly, Cbs−/+ heterozygous animals were obtained from Dr. Warren Kruger’s lab). The backcrossed heterozygous animals were provided with 25 mol/L ZnSO4 containing water for induction of the transgene. Then, the siblings were intercrossed and fed with zinc to generate homozygous CbsZn/Zn mice. The generation and maintenance of the transgenic mice that express the human Cbs-I278T gene is described in [27].
Circadian Behavioral Analysis
Mice were housed with ad libitum food and water in individual cages containing running wheels. Temperature, humidity and light were tightly controlled. 21 wild-type and 26 CbsZn/Zn mice were entrained for 2 weeks with 12 hours light-dark cycles, and then they were maintained in constant darkness. ClockLab Data Collection (Actimetrics) were used for locomotor activity detection and analysis [11]. The Fourier power spectrum was directly output using ClockLab v 6.0 and used to compute the fraction of total power explained in the circadian period range. The included ClockLab functions for non parametric circadian analysis as described in [28] including rhythm amplitude and inter-daily stability were also used.
Metabolomics Analysis
Liver tissues (50 mg) were thawed on ice and metabolite extraction was performed with Bligh-Dyer method [59, 60]. Briefly, cell pellets were dissolved in a mixture of 2:1 methanol:chloroform, and then they were vortexed and sonicated. Following the addition of chloroform and water, samples were vortexed and organic and aqueous layers were separated by centrifugation. The aqueous layer was vacuum dried and re-dissolved in an acetonitrile:water (2:1) mixture. After centrifugation to remove fine particulates, the supernatant was transferred to LC-MS certified sample vial for Ultra-performance liquid chromatography.
Metabolomics/Mass spectroscopy data processing and enrichment analysis
Mass spectroscopy and data analysis was performed as previously described [14]. Briefly, ion counts which were obtained from TargetLynx during mass spectroscopy data processing were processed in version 3.2 R. For the LC column equilibration, a QC (quality control) sample mixture injected at the beginning of every 6 injections to account for instrumental drift. QC data was also used for the normalization of the results. Two samples were excluded based on lab QC standards.
ANOVA analysis was performed in R using the aov() command. The comparison of CbsZn/Zn and WT involved only two factors: gender and genotype. A three factor ANOVA, including time and the interaction term between time and genotype was used in the analysis of Cryptochrome mutants. Multiple corrections were performed using the method of Benjimini and Hochberg as implemented in the p.adjust() command.
Overrepresentation analysis was performed using Metaboanalyst.ca website (v 4.0) [37]. Lists of metabolites with significant ANOVA results (p<0.05 for cryptochrome results, q<.05 for CBS results were using the pathway tool and a custom background comprised of the metabolite identified in the corresponding study. The full, pre-ranked metabolite lists, ordered by -log(p) were separately analyzed using the GSEA Java program [38] and metabolite sets downloaded from the Small Molecule Pathway Database [61] and converted to GMT file format.
Ethics Statement:
The relevant institutional review boards approved all procedures involving the use of experimental animals. Experiments utilizing Cryptochrome mutant mice and corresponding controls were approved by the University of North Carolina Institutional Animal Care and Use Committee. Experiments utilizing CBS transgenic mice were approved the University of Pennsylvania Institutional Animal Care and Use Committee
Supplementary Material
Acknowledgements
This work was supported in part by a grant from that Istanbul Development Agency, (ISTKA-TR/14/EVK/0039 to IHK), a grant from the Defense Advanced Research Projects Agency (DARPA D17AP00003 to RCA), a grant from the National Cancer Institute (R01 CA227485 to RCA and JBH), and a grant from the National Institute of Neurological Disorders and Stroke (1R01NS054794-06 to JBH). This work was also supported by TUBITAK BIDEB 2214-A Scholarship given to SCK.
Abbreviations
- CBS
Cystathionine β-synthase
- CRY
cryptochrome
- TTFLs
transcription/translation feedback loops
- CLOCK
circadian locomotor output cycles caput
- BMAL1
Brain and muscle Arnt-like protein-1 (BMAL1), brain and muscle
- SCN
suprachiasmatic nuclei
- qPCR
quantitative PCR
- bHLH
basic helix loop helix
- DMEM
Dulbecco’s modified Eagle’s medium
- ANOVA
analysis of variance
Footnotes
Competing interests
The authors declare that they have no competing interests.
References
- 1.Gachon F, Nagoshi E, Brown SA, Ripperger J & Schibler U (2004) The mammalian circadian timing system: from gene expression to physiology, Chromosoma. 113, 103–12. [DOI] [PubMed] [Google Scholar]
- 2.Eckel-Mahan KL & Storm DR (2009) Circadian rhythms and memory: not so simple as cogs and gears, EMBO Rep. 10, 584–91. [DOI] [PMC free article] [PubMed] [Google Scholar]
- 3.Franken P & Dijk DJ (2009) Circadian clock genes and sleep homeostasis, Eur J Neurosci. 29, 1820–9. [DOI] [PubMed] [Google Scholar]
- 4.Kyriacou CP & Hastings MH (2010) Circadian clocks: genes, sleep, and cognition, Trends Cogn Sci. 14, 259–67. [DOI] [PubMed] [Google Scholar]
- 5.Sahar S & Sassone-Corsi P (2009) Metabolism and cancer: the circadian clock connection, Nat Rev Cancer. 9, 886–96. [DOI] [PubMed] [Google Scholar]
- 6.Kohsaka A, Laposky AD, Ramsey KM, Estrada C, Joshu C, Kobayashi Y, Turek FW & Bass J (2007) High-fat diet disrupts behavioral and molecular circadian rhythms in mice, Cell Metab. 6, 414–21. [DOI] [PubMed] [Google Scholar]
- 7.Pendergast JS, Branecky KL, Yang W, Ellacott KLJ, Niswender KD & Yamazaki S (2013) High-fat diet acutely affects circadian organisation and eating behavior, Eur J Neurosci. 37, 1350–1356. [DOI] [PMC free article] [PubMed] [Google Scholar]
- 8.McIntosh BE, Hogenesch JB & Bradfield CA (2010) Mammalian Per-Arnt-Sim proteins in environmental adaptation, Annu Rev Physiol. 72, 625–45. [DOI] [PubMed] [Google Scholar]
- 9.Cox KH & Takahashi JS (2019) Circadian clock genes and the transcriptional architecture of the clock mechanism, J Mol Endocrinol. 63, R93–R102. [DOI] [PMC free article] [PubMed] [Google Scholar]
- 10.Takahashi JS (2017) Transcriptional architecture of the mammalian circadian clock, Nat Rev Genet. 18, 164–179. [DOI] [PMC free article] [PubMed] [Google Scholar]
- 11.Anafi RC, Lee Y, Sato TK, Venkataraman A, Ramanathan C, Kavakli IH, Hughes ME, Baggs JE, Growe J, Liu AC, Kim J & Hogenesch JB (2014) Machine learning helps identify CHRONO as a circadian clock component, PLoS Biol. 12, e1001840. [DOI] [PMC free article] [PubMed] [Google Scholar]
- 12.Robles MS, Boyault C, Knutti D, Padmanabhan K & Weitz CJ (2010) Identification of RACK1 and protein kinase Calpha as integral components of the mammalian circadian clock, Science. 327, 463–6. [DOI] [PubMed] [Google Scholar]
- 13.Takahashi JS (2016) Molecular Architecture of the Circadian Clock in Mammals in A Time for Metabolism and Hormones (Sassone-Corsi P. & Christen Y., eds), Cham (CH). [PubMed] [Google Scholar]
- 14.Krishnaiah SY, Wu G, Altman BJ, Growe J, Rhoades SD, Coldren F, Venkataraman A, Olarerin-George AO, Francey LJ, Mukherjee S, Girish S, Selby CP, Cal S, Er U, Sianati B, Sengupta A, Anafi RC, Kavakli IH, Sancar A, Baur JA, Dang CV, Hogenesch JB & Weljie AM (2017) Clock Regulation of Metabolites Reveals Coupling between Transcription and Metabolism, Cell Metab. 25, 961–974 e4. [DOI] [PMC free article] [PubMed] [Google Scholar]
- 15.Zhang R, Lahens NF, Ballance HI, Hughes ME & Hogenesch JB (2014) A circadian gene expression atlas in mammals: implications for biology and medicine, Proc Natl Acad Sci U S A. 111, 16219–24. [DOI] [PMC free article] [PubMed] [Google Scholar]
- 16.Kruger WD (2017) Cystathionine beta-synthase deficiency: Of mice and men, Mol Genet Metab. 121, 199–205. [DOI] [PMC free article] [PubMed] [Google Scholar]
- 17.Maclean KN, Sikora J, Kozich V, Jiang H, Greiner LS, Kraus E, Krijt J, Crnic LS, Allen RH, Stabler SP, Elleder M & Kraus JP (2010) Cystathionine beta-synthase null homocystinuric mice fail to exhibit altered hemostasis or lowering of plasma homocysteine in response to betaine treatment, Mol Genet Metab. 101, 163–71. [DOI] [PMC free article] [PubMed] [Google Scholar]
- 18.Ozber N, Baris I, Tatlici G, Gur I, Kilinc S, Unal EB & Kavakli IH (2010) Identification of two amino acids in the C-terminal domain of mouse CRY2 essential for PER2 interaction, BMC Mol Biol. 11, 69. [DOI] [PMC free article] [PubMed] [Google Scholar]
- 19.Geer LY, Marchler-Bauer A, Geer RC, Han L, He J, He S, Liu C, Shi W & Bryant SH (2010) The NCBI BioSystems database, Nucleic Acids Res. 38, D492–6. [DOI] [PMC free article] [PubMed] [Google Scholar]
- 20.Pizarro A, Hayer K, Lahens NF & Hogenesch JB (2013) CircaDB: a database of mammalian circadian gene expression profiles, Nucleic Acids Res. 41, D1009–13. [DOI] [PMC free article] [PubMed] [Google Scholar]
- 21.Hughes ME, DiTacchio L, Hayes KR, Vollmers C, Pulivarthy S, Baggs JE, Panda S & Hogenesch JB (2009) Harmonics of circadian gene transcription in mammals, PLoS Genet. 5, e1000442. [DOI] [PMC free article] [PubMed] [Google Scholar]
- 22.Anafi RC, Francey LJ, Hogenesch JB & Kim J (2017) CYCLOPS reveals human transcriptional rhythms in health and disease, Proc Natl Acad Sci U S A. 114, 5312–5317. [DOI] [PMC free article] [PubMed] [Google Scholar]
- 23.Miller BH, McDearmon EL, Panda S, Hayes KR, Zhang J, Andrews JL, Antoch MP, Walker JR, Esser KA, Hogenesch JB & Takahashi JS (2007) Circadian and CLOCK-controlled regulation of the mouse transcriptome and cell proliferation, Proc Natl Acad Sci U S A. 104, 3342–7. [DOI] [PMC free article] [PubMed] [Google Scholar]
- 24.Zhang T, Chen M, Guo L, Yu F, Zhou C, Xu H & Wu B (2019) Reverse Erythroblastosis Virus alpha Antagonism Promotes Homocysteine Catabolism and Ammonia Clearance, Hepatology. 70, 1770–84 [DOI] [PubMed] [Google Scholar]
- 25.Katzenberg D, Young T, Finn L, Lin L, King DP, Takahashi JS & Mignot E (1998) A CLOCK polymorphism associated with human diurnal preference, Sleep. 21, 569–76. [DOI] [PubMed] [Google Scholar]
- 26.Lee Y, Jang AR, Francey LJ, Sehgal A & Hogenesch JB (2015) KPNB1 mediates PER/CRY nuclear translocation and circadian clock function, Elife. 4. [DOI] [PMC free article] [PubMed] [Google Scholar]
- 27.Wang L, Chen X, Tang B, Hua X, Klein-Szanto A & Kruger WD (2005) Expression of mutant human cystathionine beta-synthase rescues neonatal lethality but not homocystinuria in a mouse model, Hum Mol Genet. 14, 2201–8. [DOI] [PMC free article] [PubMed] [Google Scholar]
- 28.van Someren EJ, Hagebeuk EE, Lijzenga C, Scheltens P, de Rooij SE, Jonker C, Pot AM, Mirmiran M & Swaab DF (1996) Circadian rest-activity rhythm disturbances in Alzheimer’s disease, Biol Psychiatry. 40, 259–70. [DOI] [PubMed] [Google Scholar]
- 29.Kozich V, Sokolova J, Klatovska V, Krijt J, Janosik M, Jelinek K & Kraus JP (2010) Cystathionine beta-Synthase Mutations: Effect of Mutation Topology on Folding and Activity, Human Mutation. 31, 809–819. [DOI] [PMC free article] [PubMed] [Google Scholar]
- 30.Asimakopoulou A, Panopoulos P, Chasapis CT, Coletta C, Zhou ZM, Cirino G, Giannis A, Szabo C, Spyroulias GA & Papapetropoulos A (2013) Selectivity of commonly used pharmacological inhibitors for cystathionine synthase (CBS) and cystathionine lyase (CSE), Brit J Pharmacol. 169, 922–932. [DOI] [PMC free article] [PubMed] [Google Scholar]
- 31.Stipanuk MH & Beck PW (1982) Characterization of the Enzymic Capacity for Cysteine Desulfhydration in Liver and Kidney of the Rat, Biochem J. 206, 267–277. [DOI] [PMC free article] [PubMed] [Google Scholar]
- 32.DeRatt B, Ralat M & Gregory J (2016) Characterization of Cystathionine Beta-Synthase and Cystathionine Gamma-Lyase in the Production of Hydrogen Sulfide Biomarkers, Lanthionine and Homolanthionine, in a HepG2 Cell Culture Model, Faseb J. 30. [Google Scholar]
- 33.Thresher RJ, Vitaterna MH, Miyamoto Y, Kazantsev A, Hsu DS, Petit C, Selby CP, Dawut L, Smithies O, Takahashi JS & Sancar A (1998) Role of mouse cryptochrome blue-light photoreceptor in circadian photoresponses, Science. 282, 1490–4. [DOI] [PubMed] [Google Scholar]
- 34.Vitaterna MH, Selby CP, Todo T, Niwa H, Thompson C, Fruechte EM, Hitomi K, Thresher RJ, Ishikawa T, Miyazaki J, Takahashi JS & Sancar A (1999) Differential regulation of mammalian period genes and circadian rhythmicity by cryptochromes 1 and 2, Proc Natl Acad Sci U S A. 96, 12114–9. [DOI] [PMC free article] [PubMed] [Google Scholar]
- 35.Papp SJ, Huber AL, Jordan SD, Kriebs A, Nguyen M, Moresco JJ, Yates JR & Lamia KA (2015) DNA damage shifts circadian clock time via Hausp-dependent Cry1 stabilization, Elife. 4. [DOI] [PMC free article] [PubMed] [Google Scholar]
- 36.Kanehisa M & Goto S (2000) KEGG: kyoto encyclopedia of genes and genomes, Nucleic Acids Res. 28, 27–30. [DOI] [PMC free article] [PubMed] [Google Scholar]
- 37.Chong J, Soufan O, Li C, Caraus I, Li S, Bourque G, Wishart DS & Xia J (2018) MetaboAnalyst 4.0: towards more transparent and integrative metabolomics analysis, Nucleic Acids Res. 46, W486–W494. [DOI] [PMC free article] [PubMed] [Google Scholar]
- 38.Subramanian A, Tamayo P, Mootha VK, Mukherjee S, Ebert BL, Gillette MA, Paulovich A, Pomeroy SL, Golub TR, Lander ES & Mesirov JP (2005) Gene set enrichment analysis: a knowledge-based approach for interpreting genome-wide expression profiles, Proc Natl Acad Sci U S A. 102, 15545–50. [DOI] [PMC free article] [PubMed] [Google Scholar]
- 39.Ruoppolo M, Caterino M, Albano L, Pecce R, Di Girolamo MG, Crisci D, Costanzo M, Milella L, Franconi F & Campesi I (2018) Targeted metabolomic profiling in rat tissues reveals sex differences, Sci Rep. 8, 4663. [DOI] [PMC free article] [PubMed] [Google Scholar]
- 40.Kavakli IH, Baris I, Tardu M, Gul S, Oner H, Cal S, Bulut S, Yarparvar D, Berkel C, Ustaoglu P & Aydin C (2017) The Photolyase/Cryptochrome Family of Proteins as DNA Repair Enzymes and Transcriptional Repressors, Photochem Photobiol. 93, 93–103. [DOI] [PubMed] [Google Scholar]
- 41.Michael AK, Harvey SL, Sammons PJ, Anderson AP, Kopalle HM, Banham AH & Partch CL (2015) Cancer/Testis Antigen PASD1 Silences the Circadian Clock, Mol Cell. 58, 743–754. [DOI] [PMC free article] [PubMed] [Google Scholar]
- 42.Anand SN, Maywood ES, Chesham JE, Joynson G, Banks GT, Hastings MH & Nolan PM (2013) Distinct and separable roles for endogenous CRY1 and CRY2 within the circadian molecular clockwork of the suprachiasmatic nucleus, as revealed by the Fbxl3(Afh) mutation, J Neurosci. 33, 7145–53. [DOI] [PMC free article] [PubMed] [Google Scholar]
- 43.Koike N, Yoo SH, Huang HC, Kumar V, Lee C, Kim TK & Takahashi JS (2012) Transcriptional architecture and chromatin landscape of the core circadian clock in mammals, Science. 338, 349–54. [DOI] [PMC free article] [PubMed] [Google Scholar]
- 44.La Manno G, Soldatov R, Zeisel A, Braun E, Hochgerner H, Petukhov V, Lidschreiber K, Kastriti ME, Lonnerberg P, Furlan A, Fan J, Borm LE, Liu ZH, van Bruggen D, Guo JM, He XL, Barker R, Sundstrom E, Castelo-Branco G, Cramer P, Adameyko I, Linnarsson S & Kharchenko PV (2018) RNA velocity of single cells, Nature. 560, 494-+. [DOI] [PMC free article] [PubMed] [Google Scholar]
- 45.Menet JS, Rodriguez J, Abruzzi KC & Rosbash M (2012) Nascent-Seq reveals novel features of mouse circadian transcriptional regulation, Elife. 1. [DOI] [PMC free article] [PubMed] [Google Scholar]
- 46.Zhang EE, Liu Y, Dentin R, Pongsawakul PY, Liu AC, Hirota T, Nusinow DA, Sun X, Landais S, Kodama Y, Brenner DA, Montminy M & Kay SA (2010) Cryptochrome mediates circadian regulation of cAMP signaling and hepatic gluconeogenesis, Nat Med. 16, 1152–6. [DOI] [PMC free article] [PubMed] [Google Scholar]
- 47.Linden DR, Sha L, Mazzone A, Stoltz GJ, Bernard CE, Furne JK, Levitt MD, Farrugia G & Szurszewski JH (2008) Production of the gaseous signal molecule hydrogen sulfide in mouse tissues, J Neurochem. 106, 1577–1585. [DOI] [PMC free article] [PubMed] [Google Scholar]
- 48.Abe K & Kimura H (1996) The possible role of hydrogen sulfide as an endogenous neuromodulator, J Neurosci. 16, 1066–1071. [DOI] [PMC free article] [PubMed] [Google Scholar]
- 49.Shefa U, Kim MS, Jeong NY & Jung J (2018) Antioxidant and Cell-Signaling Functions of Hydrogen Sulfide in the Central Nervous System, Oxid Med Cell Longev. [DOI] [PMC free article] [PubMed] [Google Scholar]
- 50.Eto K, Asada T, Arima K, Makifuchi T & Kimura H (2002) Brain hydrogen sulfide is severely decreased in Alzheimer’s disease, Biochem Biophys Res Commun. 293, 1485–8. [DOI] [PubMed] [Google Scholar]
- 51.Hellmich MR, Coletta C, Chao C & Szabo C (2015) The therapeutic potential of cystathionine beta-synthetase/hydrogen sulfide inhibition in cancer, Antioxid Redox Signal. 22, 424–48. [DOI] [PMC free article] [PubMed] [Google Scholar]
- 52.Bass J (2012) Circadian topology of metabolism, Nature. 491, 348–56. [DOI] [PubMed] [Google Scholar]
- 53.Marcheva B, Ramsey KM, Buhr ED, Kobayashi Y, Su H, Ko CH, Ivanova G, Omura C, Mo S, Vitaterna MH, Lopez JP, Philipson LH, Bradfield CA, Crosby SD, JeBailey L, Wang X, Takahashi JS & Bass J (2010) Disruption of the clock components CLOCK and BMAL1 leads to hypoinsulinaemia and diabetes, Nature. 466, 627–31. [DOI] [PMC free article] [PubMed] [Google Scholar]
- 54.Lazar MA (2016) Rev-erbs: Integrating Metabolism Around the Clock in A Time for Metabolism and Hormones (Sassone-Corsi P. & Christen Y., eds) pp. 63–70, Cham (CH). [PubMed] [Google Scholar]
- 55.Asher G, Gatfield D, Stratmann M, Reinke H, Dibner C, Kreppel F, Mostoslavsky R, Alt FW & Schibler U (2008) SIRT1 regulates circadian clock gene expression through PER2 deacetylation, Cell. 134, 317–328. [DOI] [PubMed] [Google Scholar]
- 56.Ramsey KM, Yoshino J, Brace CS, Abrassart D, Kobayashi Y, Marcheva B, Hong HK, Chong JL, Buhr ED, Lee C, Takahashi JS, Imai SI & Bass J (2009) Circadian Clock Feedback Cycle Through NAMPT-Mediated NAD(+) Biosynthesis, Science. 324, 651–654. [DOI] [PMC free article] [PubMed] [Google Scholar]
- 57.Lin R, Mo Y, Zha H, Qu Z, Xie P, Zhu ZJ, Xu Y, Xiong Y & Guan KL (2017) CLOCK Acetylates ASS1 to Drive Circadian Rhythm of Ureagenesis, Mol Cell. 68, 198–209 e6. [DOI] [PubMed] [Google Scholar]
- 58.Doruk YU, Yarparvar D, Akyel YK, Gul S, Taskin AC, Yilmaz F, Baris I, Ozturk N, Turkay M, Ozturk N, Okyar A & Kavakli IH (2020) A CLOCK-binding small molecule disrupts the interaction between CLOCK and BMAL1 and enhances circadian rhythm amplitude, J Biol Chem. 295, 3518–3531. [DOI] [PMC free article] [PubMed] [Google Scholar]
- 59.Bligh EG & Dyer WJ (1959) A rapid method of total lipid extraction and purification, Can J Biochem Physiol. 37, 911–7. [DOI] [PubMed] [Google Scholar]
- 60.Tambellini NP, Zaremberg V, Turner RJ & Weljie AM (2013) Evaluation of extraction protocols for simultaneous polar and non-polar yeast metabolite analysis using multivariate projection methods, Metabolites. 3, 592–605. [DOI] [PMC free article] [PubMed] [Google Scholar]
- 61.Jewison T, Su Y, Disfany FM, Liang Y, Knox C, Maciejewski A, Poelzer J, Huynh J, Zhou Y, Arndt D, Djoumbou Y, Liu Y, Deng L, Guo AC, Han B, Pon A, Wilson M, Rafatnia S, Liu P & Wishart DS (2014) SMPDB 2.0: big improvements to the Small Molecule Pathway Database, Nucleic Acids Res. 42, D478–84. [DOI] [PMC free article] [PubMed] [Google Scholar]
Associated Data
This section collects any data citations, data availability statements, or supplementary materials included in this article.