Abstract
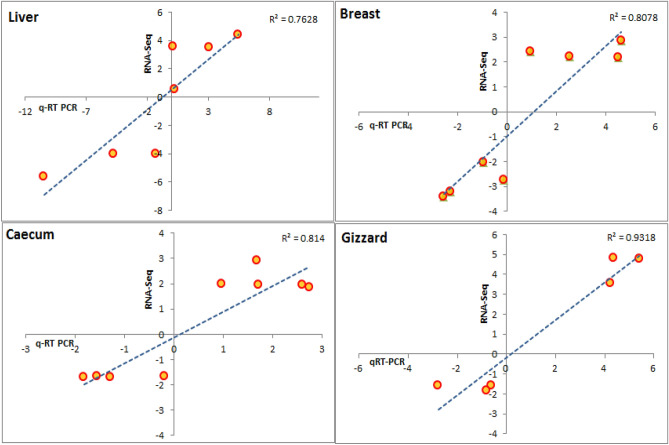
Transcriptome expression reflects genetic response in diverse conditions. In this study, RNA sequencing was utilized to profile multiple tissues such as liver, breast, caecum, and gizzard of Korean commercial chicken raised in Korea and Kyrgyzstan. We analyzed ten samples per tissue from each location to identify candidate genes which are involved in the adaptation of Korean commercial chicken to Kyrgyzstan. At false discovery rate (FDR) < 0.05 and fold change (FC) > 2, we found 315, 196, 167 and 198 genes in liver, breast, cecum, and gizzard respectively as differentially expressed between the two locations. GO enrichment analysis showed that these genes were highly enriched for cellular and metabolic processes, catalytic activity, and biological regulations. Similarly, KEGG pathways analysis indicated metabolic, PPAR signaling, FoxO, glycolysis/gluconeogenesis, biosynthesis, MAPK signaling, CAMs, citrate cycles pathways were differentially enriched. Enriched genes like TSKU, VTG1, SGK, CDK2 etc. in these pathways might be involved in acclimation of organisms into diverse climatic conditions. The qRT-PCR result also corroborated the RNA-Seq findings with R2 of 0.76, 0.80, 0.81, and 0.93 for liver, breast, caecum, and gizzard respectively. Our findings can improve the understanding of environmental acclimation process in chicken.
Subject terms: Computational biology and bioinformatics, Genetics
Introduction
Recently, consumption of chicken meat has increased worldwide because of its rich nutrition, low cost, high quality protein, low cholesterol, and low fat1. Climatic changes have a significant effect on development, growth, physiology, immunity and productivity of chicken2. Improving adaptation efficiency of the birds to different climatic condition is an important economic goal in production of Korean commercial chicken3. Kyrgyzstan imports significant amount of agricultural products including Korean commercial chicken (Hanhyup-3)4. However there are considerable differences in climatic conditions between Korea and Kyrgyzstan, which could have significant impact on Korean commercial chicken productivity in Kyrgyzstan. Diverse environmental parameters between two countries such as, Korea located at 250 m and Kyrgyzstan at 2500 m above mean sea level. The average humidity in Korea is 70% while in Kyrgyzstan it’s about 40%. Environmental stresses such as temperature, humidity, altitude, and latitude negatively affects livestock productivity5. Profiling transcriptome of various tissues allows interpreting the genetic response of the animal during adaptation to new climatic condition6. The involvement of liver in carbohydrate, protein, and lipid metabolism, bile secretion, immune defense, and various other metabolic functions are very well known7. Similarly breast, gizzard, and cecum are metabolically active organs8,9. Though these organs are central for multiple metabolic, digestive, and productive activities, little is known about their transcriptome response in regulation of molecular mechanism during adaptation to climatic conditions10. It is an utmost need to explore these organ’s transcriptome profile to know their response during environmental changes11. Transcriptome analysis has been widely applied to explore and identify differentially expressed genes (DEGs) involved in adaptation of chicken in various climatic stresses12. Measuring the gene expression also facilitates the pathways involved during environmental stresses13. The availability of the chicken reference genome sequence provides an opportunity for detailed analysis of stress resistant genes through their transcriptome14. Multiple reports confirm that even mild change (32–35 °C) in environmental temperature may negatively affect fertility in chicken15–17.
We considered four tissues including breast, liver, cecum, and gizzard of Korean commercial chicken (Hanhyup-3) raised in two diverse climatic conditions in Korea and Kyrgyzstan respectively, for transcriptome analysis through RNA-Seq. We investigated GO and KEGG pathways to identify significantly enriched GO terms and pathways involved in acclimatization into diverse environmental conditions. Our integrated study also provides tissue level insights into the molecular mechanisms involved in response to such different conditions.
Results
Transcriptome of four tissues; liver, breast, cecum, and gizzard of ten chickens (4 tissues /bird) from each location i.e. Korea and Kyrgyzstan have been compared. High-throughput RNA-Seq using Illumina HiSeq 2500 was performed and different quality measures of raw data have been measured through Illumina package bcl2fastq such as total bases, read count, GC (%), AT (%), Q20 (%), Q30 (%). Around 67 to 108 million raw reads per sample were generated, comprising GC percentage between 45 and 48% of generated transcripts. Complete raw data statistics of both Korean and Kyrgyzstan paired end data is provided in the supplementary file 1 and 2 respectively. After trimming adapter sequences and low quality reads through reads trimming, the quality of the reads were accessed and trimmed sequences were considered for further downstream analysis.
Mapping, differential expression, and clustering analysis of transcriptomes
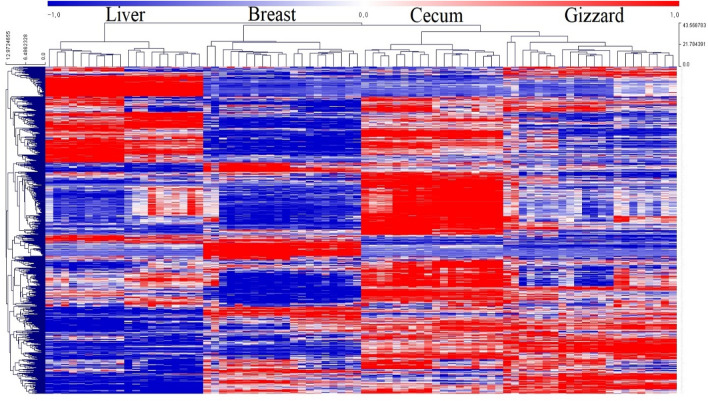
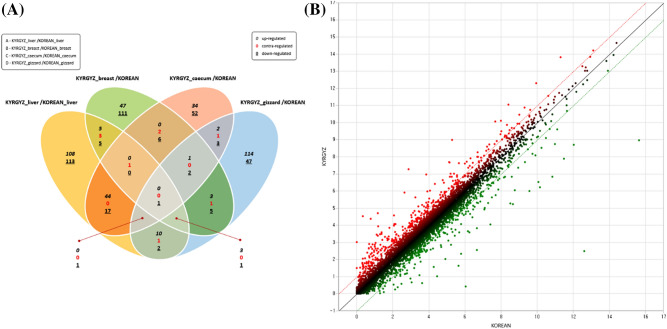
Genes having low expression value (FPKM < 1) were removed and differentially expressed genes (DEGs) were identified between Korea and Kyrgyzstan chicken. According to cutoff values of fold change ≥ 2 and adjusted FDR correction p-value < 0.05, we found 174 and 141 up- and down-regulated genes respectively in liver tissue (Supplementary File 3). In case of breast tissue, 59 and 137 up- and down-regulated genes respectively (Supplementary File 4), likewise, in case of cecum 82 and 84 up- and down-regulated genes respectively (Supplementary File 5), and 135 and 62 up- and down-regulated genes respectively in case of gizzard (Supplementary File 6). We performed hierarchical clustering for all 80 samples to explore the relative amount of variation between each location and compared to that among the four tissues. A heatmap of normalized gene expression (FPKM) counts for each tissue was generated by comparing Korea and Kyrgyzstan (Fig. 1). Venn diagram and boxplot of DEGs showing up- and down-regulated genes are shown in Fig. 2A,B respectively.
Figure 1.
DEGs hierarchical clustering, heat map showing genes (rows) with differential expression (fold ≥ 2, FDR ≤ 0.05) among ten replicates of liver, breast, cecum, and gizzard samples, expression values are log2-transformed and median-centered by gene.
Figure 2.
(A) Venn diagram of DEGs in all four tissues, (B) Scatter plot of DEGs identified in liver tissue between Korean and Kyrgyzstan.
Gene ontology analysis
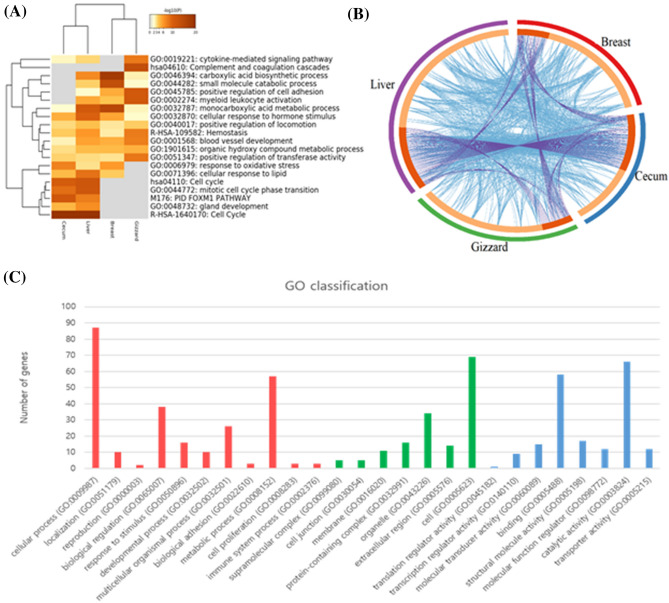
GO enriched terms in all four tissues shown in Fig. 3A18. A circos image has been generated to show the overlap between DE genes among four tissues (Fig. 3B), blue curved link genes shows that belong to the same enriched ontology term, and the inner circle represents gene lists, where hits are arranged along the arc. Genes that hit multiple lists are colored in dark orange, and genes unique to a list are shown in light orange (Fig. 3A).
Figure 3.
(A) Heatmap of enriched terms, colored by p-values (B) Overlap between gene lists, including the shared GO term level (C) GO enrichment under different environmental conditions between Korea and Kyrgyzstan. GO categories are such as biological processes, cellular components, and molecular functions are shown in red, green, and blue color respectively.
The functional annotations and annotated genes were categorized into three groups such as molecular function, cellular component, and biological process. In case of liver, all DEGs were assigned to 27 GO terms among three major categories. Most significant (corrected p-value < 0.05) GO terms such as cellular process (GO: 0009987), cell (GO: 0005623), and binding (GO: 0005488) were enriched in biological process, cellular component, and molecular function respectively. Likewise in case of breast, cecum and gizzard, significant GO terms are metabolic and cellular process (GO: 0008152 and GO: 0009987), cell and organelle (GO: 0005623, and GO: 0043226), catalytic activity and binding (GO: 0003824 and GO: 0005488) were enriched in biological process, cellular component, and molecular function respectively (Fig. 3C).
KEGG pathway analysis
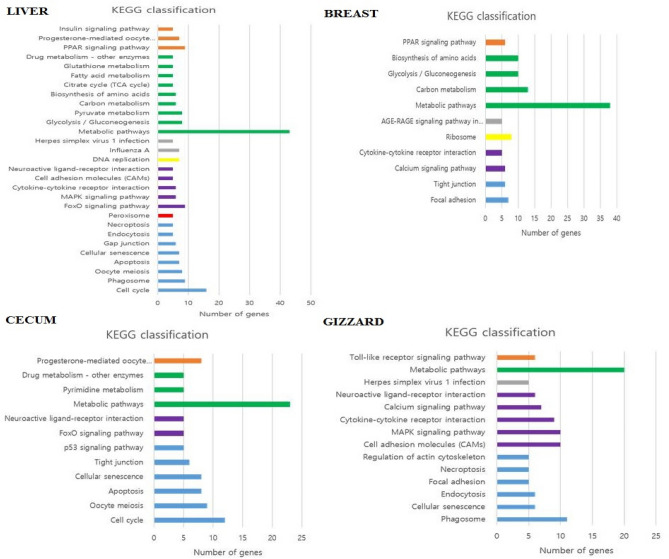
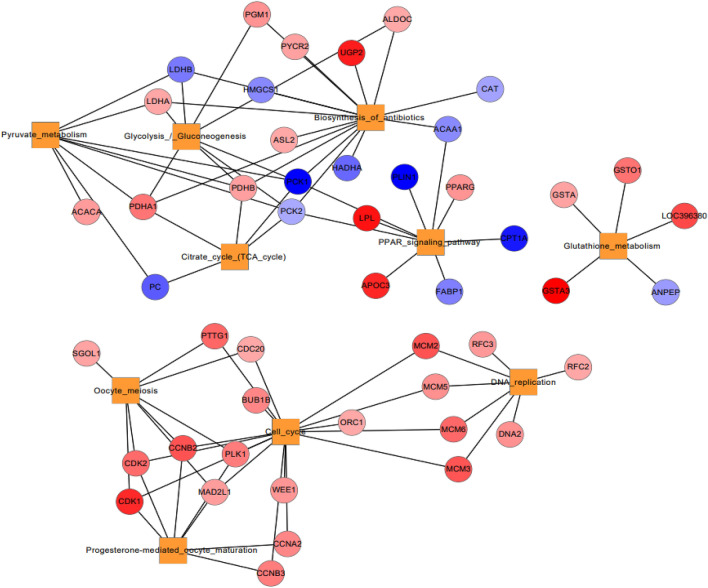
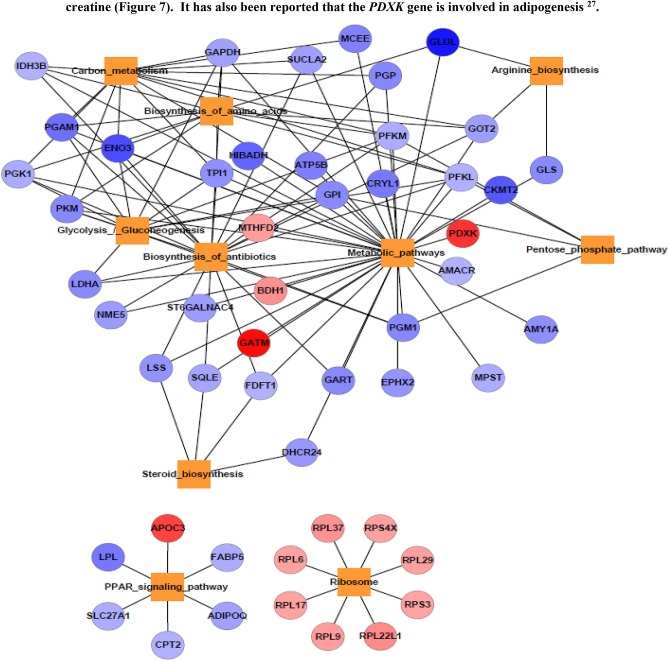
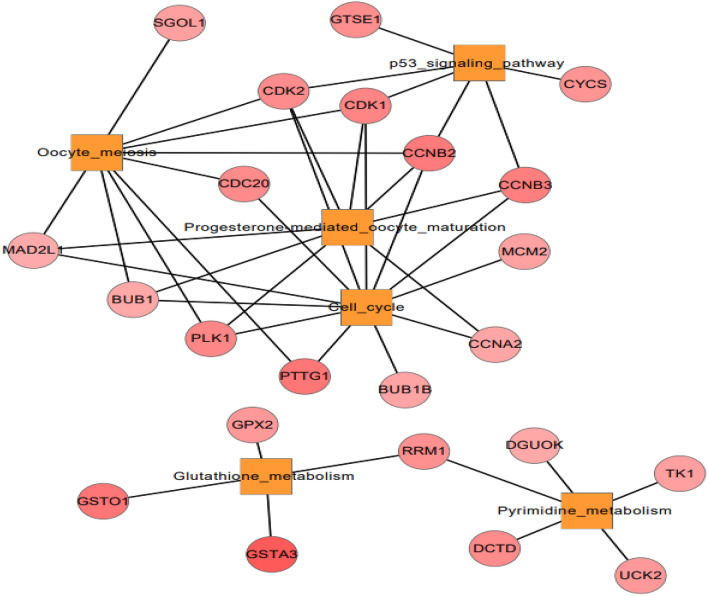
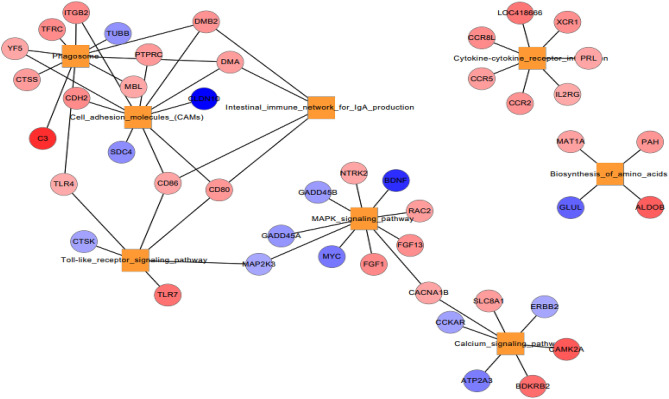
KEGG pathway analysis has been performed to explore the molecular interaction networks within cells and putative biological functions of DE genes. As shown in Fig. 4, metabolic pathway is the most frequently enriched pathway in all four tissues during acclimatization in Kyrgyzstan environment. PPAR signaling pathway, biosynthesis of amino acids, glycolysis/gluconeogenesis, cytokine-cytokine receptor interaction, and carbon metabolism were commonly enriched in liver and breast both tissues. Likewise, some of the pathways such as progesterone mediated oocyte, drug metabolism, neuroactive ligand receptor interaction, FoxO signaling pathway, cellular senescence, apoptosis, oocyte meiosis, cell cycle was commonly enriched in liver and cecum tissues. Similarly, pathways such as neuroactive ligand receptor interaction, neuroactive ligand receptor interaction, cell adhesion molecules, MAPK signaling pathway, necroptosis, endocytosis, cellular senescence, and phagosome were commonly enriched in liver and gizzard (Fig. 4). The DE genes involved in all pathways have been provided in supplementary materials. Ingenuity Pathway Analysis (IPA) was used to decipher the genetic networks of DE genes involved in particular pathways during acclimatization in Kyrgyz environment. As shown in Figs. 6,7,8and9, network of enriched pathways involved in tissues showing the DE genes. Color gradient blue to red indicates the down to upregulated genes respectively.
Figure 4.
Enriched KEGG pathways of all four tissues such as liver, breast, caecum, and gizzard based on number of DE genes.
Figure 6.
Network of enriched pathways and DE genes in liver tissue. Color gradient blue to red indicates the down to upregulated genes respectively.
Figure 7.
Network of enriched pathways and involved DE genes in breast muscle. Color gradient blue to red indicates the down to upregulated genes respectively.
Figure 8.
Network of enriched pathways and involved DE genes in caecum tissue.
Figure 9.
Network of enriched pathways and involved DE genes in gizzard. Color gradient blue to red indicates the down to upregulated genes respectively.
Validation of RNA-seq results by qRT-PCR
We have validated the DE genes obtained from RNA-seq data by real-time RT–PCR analysis. The expression of top 5 up and down regulated genes was analyzed in the 10 samples of each location Korea and Kyrgyzstan. Our analysis revealed similar genetic expression pattern of all the selected genes in real-time PCR analysis we found in RNA-seq data. The statistical analysis also showed very good correspondence as correlation coefficient (R2) of liver, breast, caecum, and gizzard are 0.7628, 0.8078, 0.814, and 0.9318 respectively among the results of real-time PCR and RNA-Seq data analyses as shown in Fig. 5.
Figure 5.
The gene expression correlation results of top 5 up and down regulated genes and the mRNA expression level obtained from real-time PCR analysis and RNA-seq genes shown as liver, breast, cecum, and gizzard.
Discussion
Genes expressed in cells of specific tissue’s represents important information for understanding the function of tissue and their physiology19,20. Our study cataloged the collection of expressed genes in four chicken tissues such as liver, breast, caecum, and gizzard, and reported significant changes among the tissues from each other. We identified the most abundant transcripts and the collection of genes showed tissue specific expression. GO enrichment and KEGG pathways analyses provided confidence that the dataset is of both location Korean and Kyrgyzstan is of high quality and useful for downstream analysis. Number of studies have been focused on the transcriptional changes on chicken, but little is known about the impact of environmental changes on commercially important Korean chicken breed11,21.
Impact of changes on liver tissue between Korean and Kyrgyzstan environment
Liver is an important metabolic organ that plays a critical role in lipid synthesis, degradation, and transport. However, the molecular regulatory mechanisms of lipid metabolism remain unclear in chicken22. In response to environmental changes, 174 and 141 genes were identified as significantly up and downregulated respectively in liver tissue. Differences in expressed genes were found between the Korean and Kyrgyzstan environment, including highly expressed novel genes and pathways7. Significantly important changes were observed in pyruvate metabolism related genes such as LDHA, ACACA, PDHA1, PDHB, are upregulated, whereas PCK1, PCK2, LDHB and PC were down-regulated (Fig. 6). Imagawa, T., et al. (2006) indicated that expression of lactate dehydrogenase (LDH) involved in inter-conversion of lactate and pyruvate23. ACACA is a significant enzyme in TCA cycle and under changed nutritional condition pyruvate is carboxylate by the pyruvate carboxylase enzyme24. Likewise, in cell cycle pathway (CDK1-2, CDC20, MCM1-3, PTTG1), Oocyte meiosis (SGOL1, PTTG1, CDC20, CCNB2, CDK2, CDK1), Progesterone mediated oocyte maturation (CDK1, CDK2, CCNB2, MAD2L1, PLK1, CCNB3, CCNA2), DNA replication (RFC3, RFC2, DNA2, MCM-2,3,5,6), all genes were downregulated. In PPAR signaling pathway LPL and APOC3 genes were upregulated whereas CPT1A, PLIN1, PPARG, FABP1, PCK2, PCK1 were downregulated. In Glycolysis/Gluconeogenesis upregulated genes were PDHA1, PDHB, LDHA, and downregulated genes were LDHB, HMGCS1, and LDHBPCK1 (Fig. 6). In citrate cycle PDHA1, PDHB were upregulated and genes such as PC, PCK1, PCL2 were downregulated. Similarly in GO terms investigations, energy related GO terms such as pyruvate, lactate, glycerol catabolic process, phosphorylation (Table 1), glutathione, glutathione transferase activity were significantly enriched in various categories of GO25.
Table 1.
Tissue wise enriched KEGG pathways and associated genes.
| Tissue | KEGG pathway | Count | Fold enrichment | − log10 (p-value) | Genes |
|---|---|---|---|---|---|
| Liver | Cell cycle | 16 | 4.728913 | 6.076795 | CDK1, CDC20, MCM2, PTTG1, MCM3, CDK2, MCM5, WEE1, MCM6, CCNB3, MAD2L1, CCNB2, PLK1, BUB1B, CCNA2, ORC1 |
| Pyruvate metabolism | 8 | 7.649713 | 4.244594 | LDHB, LDHA, ACACA, PDHA1, PCK2, PDHB, PCK1, PC | |
| DNA replication | 7 | 7.585965 | 3.629713 | DNA2, RFC3, RFC2, MCM2, MCM3, MCM5, MCM6 | |
| PPAR signaling pathway | 9 | 4.959348 | 3.438575 | LPL, PLIN1, APOC3, PPARG, FABP1, PCK2, CPT1A, PCK1, ACAA1 | |
| Glycolysis/gluconeogenesis | 8 | 5.099808 | 3.099527 | LDHB, LDHA, ALDOC, PGM1, PDHA1, PCK2, PDHB, PCK1 | |
| Biosynthesis of antibiotics | 15 | 2.679501 | 2.937769 | LDHB, LDHA, ASL2, ALDOC, HMGCS1, PCK2, HADHA, PDHB, PCK1, PYCR2, PGM1, PDHA1, CAT, UGP2, ACAA1 | |
| Citrate cycle (TCA cycle) | 5 | 5.805585 | 2.016859 | PDHA1, PCK2, PDHB, PCK1, PC | |
| Breast | Biosynthesis of antibiotics | 20 | 5.001735 | 8.187750758 | LDHA, PFKL, PGAM1, IDH3B, LSS, PFKM, FDFT1, GART, PKM, GOT2, GPI, NME5, TPI1, PGP, SQLE, PGM1, ENO3, SUCLA2, PGK1, GAPDH |
| Glycolysis/gluconeogenesis | 11 | 9.817131 | 7.050261023 | PKM, GPI, LDHA, TPI1, PFKL, PGM1, PGAM1, ENO3, PFKM, PGK1, GAPDH | |
| Carbon metabolism | 14 | 6.637719 | 7.017104542 | PKM, GOT2, GPI, PGP, TPI1, PFKL, MCEE, PGAM1, ENO3, IDH3B, PFKM, PGK1, SUCLA2, GAPDH | |
| Biosynthesis of amino acids | 11 | 8.783749 | 6.56804503 | PKM, GOT2, GLUL, TPI1, PFKL, PGAM1, ENO3, IDH3B, PFKM, PGK1, GAPDH | |
| Metabolic pathways | 37 | 1.590259 | 2.732261046 | LDHA, ATP5B, PGAM1, LSS, HIBADH, FDFT1, GOT2, PKM, MTHFD2, PGP, TPI1, CRYL1, ST6GALNAC4, MCEE, CKMT2, ENO3, SUCLA2, BDH1, GAPDH, DHCR24, PDXK, GATM, PFKL, AMACR, EPHX2, IDH3B, PFKM, GART, GPI, NME5, GLUL, SQLE, GLS, PGM1, PGK1, AMY1A, MPST | |
| Steroid biosynthesis | 4 | 10.7096 | 2.265676219 | SQLE, LSS, FDFT1, DHCR24 | |
| PPAR signaling pathway | 6 | 4.628724 | 2.062731216 | SLC27A1, LPL, CPT2, APOC3, ADIPOQ, FABP5 | |
| Caecum | Cell cycle | 12 | 6.206699 | 5.660312 | CDK1, CCNB3, CCNB2, MAD2L1, PLK1, BUB1, BUB1B, CDC20, MCM2, PTTG1, CCNA2, CDK2 |
| Oocyte meiosis | 9 | 5.7534 | 3.891816 | CDK1, CCNB2, MAD2L1, PLK1, SGOL1, BUB1, CDC20, PTTG1, CDK2 | |
| Progesterone-mediated oocyte maturation | 8 | 6.068772 | 3.560625 | CDK1, CCNB3, CCNB2, MAD2L1, PLK1, BUB1, CCNA2, CDK2 | |
| p53 signaling pathway | 6 | 5.596204 | 2.416468 | CDK1, CCNB3, CCNB2, CYCS, CDK2, GTSE1 | |
| Glutathione metabolism | 4 | 5.98892 | 1.562493 | GPX2, GSTA3, RRM1, GSTO1 | |
| Pyrimidine metabolism | 5 | 3.307834 | 1.214186 | DCTD, RRM1, DGUOK, UCK2, TK1 | |
| Gizzard | Cell adhesion molecules (CAMs) | 10 | 4.779485 | 3.730487 | PTPRC, CD86, CD80, DMA, CLDN10, ITGB2, CDH2, SDC4, YF5, DMB2 |
| Phagosome | 10 | 4.270196 | 3.360878 | TUBB, MBL, TFRC, C3, DMA, ITGB2, TLR4, CTSS, YF5, DMB2 | |
| MAPK signaling pathway | 10 | 2.469023 | 1.757301 | BDNF, RAC2, MAP2K3, NTRK2, FGF13, GADD45B, FGF1, GADD45A, MYC, CACNA1B | |
| Toll-like receptor signaling pathway | 6 | 3.766004 | 1.701982 | CTSK, CD86, CD80, MAP2K3, TLR4, TLR7 | |
| Intestinal immune network for IgA production | 4 | 6.722114 | 1.695366 | CD86, CD80, DMA, DMB2 | |
| Cytokine-cytokine receptor interaction | 7 | 2.497772 | 1.241337 | CCR5, CCR8L, CCR2, LOC418666, IL2RG, XCR1, PRL | |
| Calcium signaling pathway | 7 | 2.26506 | 1.07805 | CCKAR, SLC8A1, ATP2A3, ERBB2, BDKRB2, CAMK2A, CACNA1B | |
| Biosynthesis of amino acids | 4 | 3.655887 | 1.032526 | GLUL, MAT1A, ALDOB, PAH |
Impact of changes in breast muscle transcriptome between Korean and Kyrgyzstan environment
In recent years, the importance of transcriptome changes in breast muscle function of Korean chickens and of the corresponding effects on meat quality has increased. It has been reported that Korean chickens are more sensitive to heat stress during transport and at high ambient temperatures than other chickens26. In response to environmental challenges, 60 and 136 genes were identified as significantly up and downregulated respectively in breast muscle. We validated top upregulated genes such as GATM, PDXK, PIT54, SLC38A4 and top downregulated genes are MN, NRGN, GLUL, PDK4, GATM involved in energy metabolism in muscle tissues by catalyzing the biosynthesis of guanidinoacetate which is a precursor of creatine (Fig. 7). It has also been reported that the PDXK gene is involved in adipogenesis27.
GO terms such as glycolytic pathway (PKM, BPI, TPI1, and PFKL etc.), gluconeogenesis (GOT2, GPI, TPI1, PGAM1, ENO3, and PGK1 etc.), myosin complex (MYH1E-F, MYL1 etc.). Likewise KEGG pathways investigation showed that PPAR signaling pathway, ribosome, steroid biosynthesis, metabolic pathways, biosynthesis of antibiotics, pentose phosphate pathways, glycolysis/gluconeogenesis, carbon metabolism, pentose phosphate pathways were enriched in Kyrgyzstan. APOC3 gene is downregulated in PPAR pathway, indicates that the level of triglycerides decreasing by inhibiting the hydrolysis of lipoprotein in plasma28.
Impact of changes on caecum between Korean and Kyrgyzstan environment
The cecum is an important part of the animal digestive system. Recent transcriptome studies have been focused on digestive system of chicken, but the molecular mechanisms underlying chicken cecum metabolism remain poorly understood. To identify genes related to cecal metabolism and to reveal molecular regulation mechanisms, we sequenced and compared the transcriptomes of cecum. In response to environmental challenges, a total of 167 genes were identified as significantly differentiated in caecum tissue.
KEGG pathways investigation indicates that Oocyte meiosis (SGOL1, MAD2L1, BUB1, PLK1, CDC20, CDK2), p53-signaling pathway (CDK1, CDK2, CCNB2, CCNB3, CYCS, GTSE1), progesterone mediated oocyte maturation (CCNB2-3, CDK1-2, BUB1, MAD2L1), cell cycle, glutathione metabolism (PTTG1, BUB1B, CCNA2, MCM2, CCNB2-3, PLK1), pyrimidine metabolism (UCK2, DCTD, TK1, DGUOK, RRM1). All mentioned genes were downregulated as shown in Fig. 8.
Impact of changes on gizzard between Korean and Kyrgyzstan environment
Analysis of the RNA-seq data of gizzard tissue showed a total of 198 differentially expressed transcripts between the Korean and Kyrgyzstan environment. GO terms such as immune response (CCL1, FYB, C7, C8B, CCR5 etc.), extracellular region (CCL1, BMP4, MBL, C3, FETUB etc.), extracellular space (GC, BMP4, XDH etc.) were significantly enriched in these two geographically diverse locations.
KEGG pathways showed that MAPK signaling pathway (up regulated—NTRK2, FGF1, FGF13, RAC2, CACNA1B, and downregulated—MYC, MAP2K3, GADD45A, BDNF), calcium signaling pathway (up regulated—CAMK2A, BDKRB2, SLC8A1, and downregulated—ATP2A3, CDKAR, ERBB2), toll like receptor signaling pathway (upregulated—TLR7, CD80, CD86, and downregulated—CTSK), cell adhesion molecules, phagosome, intestinal immune network for IgA production (Fig. 9).
Conclusion
Primary objective of this study was to explore the molecular mechanism involved in tissues such as liver, breast, cecum, and gizzard when chicken encounters the environmental changes. In conclusion, our results give new insight to understand the changes in transcriptome that may occur during acclimatization into different locations. GO terms analyses showed that the metabolic and cellular process, cell and organelle, catalytic activity and binding were significantly enriched in almost all tissues during acclimatization into Kyrgyzstan. Similarly, KEGG pathway investigation showed that pathways such as PPAR, MAPK, FoxO, and CAM are significantly enriched in Kyrgyzstan environment. Our findings can be a useful resource for the transcriptomic investigations of adaptation efficiency-related genes in chicken and may provide significant clue for understanding the molecular genetic mechanisms in other chicken breeds.
Materials and methods
Preparation of tissues
We considered 2 months old female Hanhyup-3 chickens obtained from Hanhyup breeder, a poultry breeding company in South Korea, and grown in rearing facility of NIAS South Korea at 28 °C, humidity 80%, and pressure 1008 mbar. Four tissues such as liver, breast, cecum, and gizzard were considered for sampling. Similarly, same breeds of chicken were grown in rearing facility of Institute of Biotechnology, National Academy of Science of Kyrgyz Republic at temperature 26 °C, humidity 40%, and pressure 1003 mbar. 10 samples for each tissue from each location were considered for the experiment. Dissected tissues samples were stored at − 80 °C for further use.
RNA isolation and quality assessment
The total RNA was extracted by using Trizol/chloroform/isopropanol method (InvitrogenTM, Carlsbad, CA, USA) from all four samples liver, breast, cecum, and gizzard. The purity and integrity of RNA was estimated by the nano photometer (IMPLEN, CA, USA). RNA quality was checked by Bioanalyzer 2100 system using RNA Nano 6000 Assay kit (Agilent Technologies, CA, USA).
cDNA library construction, sequencing, and quality control
The Illumina TruSeq stranded library preparation kit (TruSeq Stranded Total RNA LT Sample Prep Kit) was used to prepare the library for 10 samples from each tissues and each location Korea and Kyrgyzstan. Illumina Hiseq 2500 platform was used and 100‐bp paired‐end reads were generated. The PCR products have been purified through AMPure XP system (Beckman Coulter, Beverly, USA), and Agilent Bioanalyzer 2100 system (Agilent Technologies, CA, USA) was used to check the quality of library29. Quality of Illumina reads were checked through FastQC software by considering Q > 30, GC-content, sequence duplication level, and other default FastQC parameters30. Trimmomatic software (Version 0.39) with using parameters (ILLUMINACLIP:TruSeq3-PE.fa:2:30:10 LEADING:3 TRAILING:3 SLIDINGWINDOW:4:15 MINLEN:36) to remove adaptor and low quality sequence and transformed it into clean and ready to use for mapping31.
Reads mapping, quantification of gene expression level, and differential expression analysis
Qualified reads were mapped through Tophat2 (v2.1.1) software with default parameters to the chicken reference genome (GalGal5)32–34. The mapped BAM file has been used to estimate the gene expression through fragments per kilo base of transcript per million fragments mapped (FPKM) through cufflinks (version 2.2.1)35. Differential expression (DE) analysis of Korean and Kyrgyzstan groups (10 biological replicates from each location) was performed using the DESeq2 R package (version: 1.28.1). The P values adjustment had been done using the Benjamini and Hochberg's approach for controlling the FDR. Genes with a P value < 0.05 and fold change ≥ 2 were used as threshold for DE by DESeq236.
GO and KEGG enrichment analysis of differentially expressed genes
GO and KEGG pathways enrichment analysis were done by Database for Annotation, Visualization and Integrated Discovery (DAVID, https://david.ncifcrf.gov/)37 and Meatascape (https://metascape.org/gp/index.html#/main/step1)18. For significant enrichment, we consider Benjamini-corrected value P ≤ 0.0538.
Quantitative reverse-transcription-PCR (qRT-PCR)
We carried qRT-PCR for top ten DE genes obtained from RNA-seq for the purpose of validation. Primers were designed via Primer3 (https://bioinfo.ut.ee/primer3-0.4.0/primer3/input.htm)39. The mRNA levels of the DEGs were normalized by the housekeeping genes β-Actin and GAPDH (Glyceraldehyde 3-phosphate dehydrogenase). The relative gene expression values were calculated using the 2 − ΔΔCt method. Finally, the correlations between RNA-Seq of top 5 up and down regulated genes and the mRNA expression level from qRT-PCR were estimated.
Ethics statement
All experiments were performed in accordance with relevant guidelines and regulations. The experiments were also conducted according to norms approved by the National Institute of Animal Science (NIAS), South Korea. The animals used for these experiments performed on the basis of approved by ethical committee of NIAS, South Korea (Approval number: 2018-262).
Supplementary information
Acknowledgements
The authors are thankful to Rural Development Administration (RDA), Republic of Korea, for supporting this research. Authors are also thankful to Ebiogen Pvt. Ltd. Korea for providing technical support to complete this project. We are thankful to Hanhyup breeder, Korean Poultry breeding company for providing the technical support and sampling information.
Author contributions
Conceptualization, H.K. (Himansu Kumar), K.S.,A.T.Z., H.C., Y.L., G.W.J, K.D.S., and J.E.P.; data curation, H.K. (Himansu Kumar), A.U.I.; formal analysis, H.K. (Himansu Kumar), H.C, K.S., H.K. (Hana Kim), A.U.I. and J.E.P.; funding acquisition, G.W.J., K.D.S., A.Z., J.E.P.; investigation, H.K., A.Z., H.C., Y.L., G.W.J., and J.E.P.; methodology, H.K. (Himansu Kumar) and J.E.P.; writing—review and editing, H.K. (Himansu Kumar), K.S., and J.E.P.
Funding
This work was carried out with the support of Rural Development Administration (RDA), Republic of Korea and also supported RDA Fellowship Program 2018 of National Institute of Animal Science, RDA, Republic of Korea and Institute of Biotechnology, National Academy of Science of Kyrgyzstan under the Cooperative Research Project: Project No. PJ0130892019 and Golden Seed Project: Project No. PJ0128202019 (213010-05-3-SB210). Himansu K and K.S were supported by RDA postdoctoral Fellowship Program 2018–2019 of the National Institute of Animal Science, RDA, and Republic of Korea.
Data availability
Sequencing reads are submitted into NCBI under SRA submission portal with Project Code PRJNA577590.
Competing interests
The authors declare no competing interests.
Footnotes
Publisher's note
Springer Nature remains neutral with regard to jurisdictional claims in published maps and institutional affiliations.
Supplementary information
is available for this paper at 10.1038/s41598-020-76234-8.
References
- 1.Whitnall T, Pitts N. Global trends in meat consumption. Agric. Commod. 2019;9:96. [Google Scholar]
- 2.Irfan M, et al. Effect of different bedding materials on growth performance, physiological response and economic efficiency in three commercial broiler strains. Indian J. Anim. Res. 2019;53:545–550. [Google Scholar]
- 3.Izar-Tenorio, J., Jaramillo, P., Griffin, W. M. & Small, M. Impacts of projected climate change scenarios on heating and cooling demand for industrial broiler chicken farming in the Eastern US. J. Clean. Prod. 120306 (2020).
- 4.Gwag, J. et al. Agricultural Status in Kirgyz Republic and Korean strategies for agriculture technical cooperation with Kirgyzstan. J. Korean Soc. Int. Agric. (2012).
- 5.Wu, P. et al. Transcriptome profile analysis of leg muscle tissues between slow-and fast-growing chickens. PloS ONE13 (2018). [DOI] [PMC free article] [PubMed]
- 6.Desert C, et al. Multi-tissue transcriptomic study reveals the main role of liver in the chicken adaptive response to a switch in dietary energy source through the transcriptional regulation of lipogenesis. BMC Genomics. 2018;19:187. doi: 10.1186/s12864-018-4520-5. [DOI] [PMC free article] [PubMed] [Google Scholar]
- 7.Li H, et al. Transcriptome profile of liver at different physiological stages reveals potential mode for lipid metabolism in laying hens. BMC Genomics. 2015;16:763. doi: 10.1186/s12864-015-1943-0. [DOI] [PMC free article] [PubMed] [Google Scholar]
- 8.Désert C, et al. Transcriptome profiling of the feeding-to-fasting transition in chicken liver. BMC Genomics. 2008;9:611. doi: 10.1186/1471-2164-9-611. [DOI] [PMC free article] [PubMed] [Google Scholar]
- 9.Yu S, Wang G, Liao J, Tang M, Sun W. Transcriptome profile analysis of mechanisms of black and white plumage determination in black-bone chicken. Cell. Physiol. Biochem. 2018;46:2373–2384. doi: 10.1159/000489644. [DOI] [PubMed] [Google Scholar]
- 10.Ferdous, F. et al. Transcriptome profile of the chicken thrombocyte: new implications as an advanced immune effector cell. PloS ONE11 (2016). [DOI] [PMC free article] [PubMed]
- 11.Sun H, et al. Transcriptome responses to heat stress in hypothalamus of a meat-type chicken. J. Anim. Sci. Biotechnol. 2015;6:6. doi: 10.1186/s40104-015-0003-6. [DOI] [PMC free article] [PubMed] [Google Scholar]
- 12.Yi, B. et al. Transcriptome profile analysis of breast muscle tissues from high or low levels of atmospheric ammonia exposed broilers (gallus gallus). PloS ONE11 (2016). [DOI] [PMC free article] [PubMed]
- 13.Coble DJ, et al. RNA-seq analysis of broiler liver transcriptome reveals novel responses to high ambient temperature. BMC Genomics. 2014;15:1084. doi: 10.1186/1471-2164-15-1084. [DOI] [PMC free article] [PubMed] [Google Scholar]
- 14.Guo, A. et al. Transcriptome analysis in chicken cecal epithelia upon infection by Eimeria tenella in vivo. PloS ONE8 (2013). [DOI] [PMC free article] [PubMed]
- 15.Karaca A, Parker H, Yeatman J, McDaniel C. The effects of heat stress and sperm quality classification on broiler breeder male fertility and semen ion concentrations. Br. Poult. Sci. 2002;43:621–628. doi: 10.1080/0007166022000004552. [DOI] [PubMed] [Google Scholar]
- 16.Karaca A, Parker H, Yeatman J, McDaniel C. Role of seminal plasma in heat stress infertility of broiler breeder males. Poult. Sci. 2002;81:1904–1909. doi: 10.1093/ps/81.12.1904. [DOI] [PubMed] [Google Scholar]
- 17.Mcdaniel CD, Bramwell RK, Wilson JL, Howarth B., Jr Fertility of male and female broiler breeders following exposure to elevated ambient temperatures. Poult. Sci. 1995;74:1029–1038. doi: 10.3382/ps.0741029. [DOI] [PubMed] [Google Scholar]
- 18.Zhou Y, et al. Metascape provides a biologist-oriented resource for the analysis of systems-level datasets. Nat. Commun. 2019;10:1–10. doi: 10.1038/s41467-018-07882-8. [DOI] [PMC free article] [PubMed] [Google Scholar]
- 19.Park W, et al. RNA-seq analysis of the kidneys of broiler chickens fed diets containing different concentrations of calcium. Sci. Rep. 2017;7:1–11. doi: 10.1038/s41598-016-0028-x. [DOI] [PMC free article] [PubMed] [Google Scholar]
- 20.Kumar H, et al. Transcriptome of chicken liver tissues reveals the candidate genes and pathways responsible for adaptation into two different climatic conditions. Animals. 2019;9:1076. doi: 10.3390/ani9121076. [DOI] [PMC free article] [PubMed] [Google Scholar]
- 21.Jastrebski, S. F., Lamont, S. J. & Schmidt, C. J. Chicken hepatic response to chronic heat stress using integrated transcriptome and metabolome analysis. PloS ONE12 (2017). [DOI] [PMC free article] [PubMed]
- 22.Lan X, Hsieh JC, Schmidt CJ, Zhu Q, Lamont SJ. Liver transcriptome response to hyperthermic stress in three distinct chicken lines. BMC Genomics. 2016;17:955. doi: 10.1186/s12864-016-3291-0. [DOI] [PMC free article] [PubMed] [Google Scholar]
- 23.Imagawa T, Yamamoto E, Sawada M, Okamoto M, Uehara M. Expression of lactate dehydrogenase-A and-B messenger ribonucleic acids in chick glycogen body. Poult. Sci. 2006;85:1232–1238. doi: 10.1093/ps/85.7.1232. [DOI] [PubMed] [Google Scholar]
- 24.Gray LR, et al. Hepatic mitochondrial pyruvate carrier 1 is required for efficient regulation of gluconeo genesis and whole-body glucose homeostasis. Cell Metab. 2015;22:1–13. doi: 10.1016/j.cmet.2015.07.027. [DOI] [PMC free article] [PubMed] [Google Scholar]
- 25.Yi, G. et al. In-depth duodenal transcriptome survey in chickens with divergent feed efficiency using RNA-Seq. PloS ONE10 (2015). [DOI] [PMC free article] [PubMed]
- 26.Kang D, Park J, Shim K. Heat treatment at an early age has effects on the resistance to chronic heat stress on broilers. Animals. 2019;9:1022. doi: 10.3390/ani9121022. [DOI] [PMC free article] [PubMed] [Google Scholar]
- 27.Moreno-Navarrete JM, et al. Metabolomics uncovers the role of adipose tissue PDXK in adipogenesis and systemic insulin sensitivity. Diabetologia. 2016;59:822–832. doi: 10.1007/s00125-016-3863-1. [DOI] [PubMed] [Google Scholar]
- 28.Ooi EM, Barrett PHR, Chan DC, Watts GF. Apolipoprotein C-III: understanding an emerging cardiovascular risk factor. Clin. Sci. 2008;114:611–624. doi: 10.1042/CS20070308. [DOI] [PubMed] [Google Scholar]
- 29.Song Y, et al. A comparative analysis of library prep approaches for sequencing low input translatome samples. BMC Genomics. 2018;19:696. doi: 10.1186/s12864-018-5066-2. [DOI] [PMC free article] [PubMed] [Google Scholar]
- 30.Andrews, S. (Babraham Bioinformatics, Babraham Institute, Cambridge, United Kingdom, 2010).
- 31.Bolger AM, Lohse M, Usadel B. Trimmomatic: a flexible trimmer for Illumina sequence data. Bioinformatics. 2014;30:2114–2120. doi: 10.1093/bioinformatics/btu170. [DOI] [PMC free article] [PubMed] [Google Scholar]
- 32.Trapnell C, et al. Differential analysis of gene regulation at transcript resolution with RNA-seq. Nat. Biotechnol. 2013;31:46. doi: 10.1038/nbt.2450. [DOI] [PMC free article] [PubMed] [Google Scholar]
- 33.Trapnell C, et al. Differential gene and transcript expression analysis of RNA-seq experiments with TopHat and Cufflinks. Nat. Protoc. 2012;7:562. doi: 10.1038/nprot.2012.016. [DOI] [PMC free article] [PubMed] [Google Scholar]
- 34.Kim D, et al. TopHat2: accurate alignment of transcriptomes in the presence of insertions, deletions and gene fusions. Genome Biol. 2013;14:R36. doi: 10.1186/gb-2013-14-4-r36. [DOI] [PMC free article] [PubMed] [Google Scholar]
- 35.Trapnell C, et al. Transcript assembly and quantification by RNA-Seq reveals unannotated transcripts and isoform switching during cell differentiation. Nat. Biotechnol. 2010;28:511–515. doi: 10.1038/nbt.1621. [DOI] [PMC free article] [PubMed] [Google Scholar]
- 36.Love MI, Huber W, Anders S. Moderated estimation of fold change and dispersion for RNA-seq data with DESeq2. Genome Biol. 2014;15:550. doi: 10.1186/s13059-014-0550-8. [DOI] [PMC free article] [PubMed] [Google Scholar]
- 37.Sherman BT, Lempicki RA. Systematic and integrative analysis of large gene lists using DAVID bioinformatics resources. Nat. Protoc. 2009;4:44. doi: 10.1038/nprot.2008.211. [DOI] [PubMed] [Google Scholar]
- 38.Okuda S, et al. KEGG Atlas mapping for global analysis of metabolic pathways. Nucleic Acids Res. 2008;36:W423–W426. doi: 10.1093/nar/gkn282. [DOI] [PMC free article] [PubMed] [Google Scholar]
- 39.Untergasser A, et al. Primer3—new capabilities and interfaces. Nucleic Acids Res. 2012;40:e115–e115. doi: 10.1093/nar/gks596. [DOI] [PMC free article] [PubMed] [Google Scholar]
Associated Data
This section collects any data citations, data availability statements, or supplementary materials included in this article.
Supplementary Materials
Data Availability Statement
Sequencing reads are submitted into NCBI under SRA submission portal with Project Code PRJNA577590.


