Abstract
Coronavirus (COVID-19) has spread throughout the world, causing mayhem from January 2020 to this day. Owing to its rapidly spreading existence and high death count, the WHO has classified it as a pandemic. Biomedical engineers, virologists, epidemiologists, and people from other medical fields are working to help contain this epidemic as soon as possible. The virus incubates for five days in the human body and then begins displaying symptoms, in some cases, as late as 27 days. In some instances, CT scan based diagnosis has been found to have better sensitivity than RT-PCR, which is currently the gold standard for COVID-19 diagnosis. Lung conditions relevant to COVID-19 in CT scans are ground-glass opacity (GGO), consolidation, and pleural effusion. In this paper, two segmentation tasks are performed to predict lung spaces (segregated from ribcage and flesh in Chest CT) and COVID-19 anomalies from chest CT scans. A 2D deep learning architecture with U-Net as its backbone is proposed to solve both the segmentation tasks. It is observed that change in hyperparameters such as number of filters in down and up sampling layers, addition of attention gates, addition of spatial pyramid pooling as basic block and maintaining the homogeneity of 32 filters after each down-sampling block resulted in a good performance. The proposed approach is assessed using publically available datasets from GitHub and Kaggle. Model performance is evaluated in terms of F1-Score, Mean intersection over union (Mean IoU). It is noted that the proposed approach results in 97.31% of F1-Score and 84.6% of Mean IoU. The experimental results illustrate that the proposed approach using U-Net architecture as backbone with the changes in hyperparameters shows better results in comparison to existing U-Net architecture and attention U-net architecture. The study also recommends how this methodology can be integrated into the workflow of healthcare systems to help control the spread of COVID-19.
Keywords: Coronavirus, COVID-19, Computed Tomography, Consolidation, Diagnosis, Ground Glass Opacities (GGO), Pleural Effusion, Reverse Transcriptase Polymerase Chain Reaction, Semantic Segmentation, U-Net architecture, Spatial pyramid pooling, Hyperparameters
Introduction
The most widely used test for COVID-19 diagnosis, as of August 2020, is RT-PCR or reverse chain reaction transcription-polymerase. RT-PCR was reported to have only 30 to 70 percent sensitivity in the early days of the pandemic in China, while Chest CT was reported to be considerably more sensitive in that context [1]. Nevertheless, the recent data from US laboratories at Washington University indicate that second-generation COVID RT-PCR tests perform much better, with more than 95% sensitivity [1].
Both CT scans and X-rays have been proposed for COVID-19 diagnosis by various researchers [1]. In the literature survey, it is found that some of the essential radiological features that show up in CT scans that are Ground Glass Opacity (GGO), Pleural effusions, and Consolidation [11]. From [15], it is determined that the CT scans should give a better diagnosis than X-rays as it has better specificity. The X-rays of the patients infected with pneumonia and COVID-19 depict similar radiological features, which may be hard to differentiate. Hence, CT scans are used for the proposed study. A semantic segmentation model is proposed that gives prediction as masks of radiological findings in CT scans. Two different datasets are used for this study—one to make lung segmentation, another for finding anomalies in the lungs. The data used for finding lung anomalies consist of 929 CT slices from more than 50 patients. Another source of the CT scans is available in GitHub [9]. Radiologists annotated the training data into three radiological findings: GGO, Consolidation, and Pleural effusions.
Utilizing CT findings for COVID-19 diagnosis by a deep learning model is implemented in this study. As one CT scan contains multiple slices, the trained model here predicts anomalies in one image(slice) at a time and combines the results of all slices to give a volumetric analysis. For lung segmentation, lung spaces are separated from ribcage and flesh in each CT slice. After this, a pixel-level classification is performed to achieve semantic segmentation of three anomalies(GGO, Consolidation, and Pleural effusions) present in the CT scans of patients. Then the result achieved from each slice is combined to perform 3D volumetric analysis. A score that represents the possibility of COVID-19 infection based on CT anomalies is calculated based on the already available data of COVID-19 positive patients.
Another use case has been proposed to use model predictions to track patient recovery. Multiple CT scans taken during the course of treatment can be used to analyze whether the patient is recovering or worsening. For instance, one analysis can be, “GGO volume in the left lung has decreased from 18–13% over the past week”. It also has potential applications to study the efficacy of drugs and different treatments. A web application is developed to demonstrate how the system will work that shows CT features calculated from CT scans. The tool is available at http://covid19.rayeye.in/.
The main contribution of this study is an application of deep learning to detect abnormalities present in the lungs. In order to detect abnormalities, U-Net architecture was considered as a skeleton but hyperparameters were tuned to improve the performance and to extract spatial information at a deeper level. An overview of hyperparameters changes is listed here - the number of down convolutions and up convolutions were modified, attention gates were added, spatial pyramid pooling block was made the primary block of the architecture, and the number of filters was set in a Fibonacci series fashion to get more efficiency. This study doesn’t mean to propose the state of the art modified UNet architecture for the purpose of semantic segmentation. The main focus of this study is to explore how changes in different hyperparameters with U-net architecture as a backbone can be leveraged to segment different anomalies in CT scans and its application in COVID-19 diagnosis and recovery tracking.
The remaining sections of the paper are organized as follows: Sect. 2 presents the literature review and recent work done in the field of Artificial Intelligence to deal with the COVID-19 pandemic. Section 3 introduces the methodology proposed for this study, datasets used, deep learning architecture proposed, integration with the healthcare system, and tracking patient recovery modules. Section 4 states the implementation protocol which describes the environment where the model is trained, how training and testing splits are formed along with other relevant details. In Sect. 5, the results are displayed in terms of model accuracy, 3D visualization, and volumetric analysis. Section 6 discusses the concluding remarks and future scope of this work.
Literature review
Hyungjin Kim et al. [15] conducted a sub-analysis to determine chest CT and RT-PCR diagnostic performance metrics and predictive values. The aggregated sensitivity and specificity have been 94% and 37% respectively for chest CT. In minimal-prevalence (< 10%) nations, RT-PCR’s positive predictive value has been more than ten times greater than the positive predictive value of CT scans. When both strategies are employed, the range of negative predictive performance is 99 to 99.9%.
Jin et al. [14] developed an AI system that examines CT images instantaneously to identify features of COVID-19 infection. The sensitivity and specificity reported on the test dataset are 0.974, 0.922 respectively, including several pulmonary diseases, using 1,136 training cases (723 positives for COVID-19) from 5 hospitals. Also, all lesion regions were automatically highlighted by the program for quicker analysis.
Caruso et al. [2] investigated CT features of COVID-19 patients in Italy, Rome, and compared CT accuracy to RT-PCR. A study on consecutive victims with suspected COVID-19 contamination and respiratory problems was reported between 4th and 19th March 2020. The analysis was performed on 158 patients showing symptoms such as fever, cough, dyspnea, lymphocytopenia, increased levels of C-reactive protein, elevated lactate dehydrogenase. However, cases that had a chest CT with a medium of contrast conducted for vascular signs, extreme CT motion artifact and patients who denied CT on hospital admission were excluded from this analysis. CT sensitivity, specificity, and accuracy were 97%, 56%, and 72%, respectively, which implies that using CT will allow doctors to diagnose or assess patients thoroughly.
Lin Li. et al. [18] collected Chest CT scans from 6 hospitals in China to detect radiological findings using Artificial Intelligence. In particular, they have trained a deep learning model and named it COVNet, which can derive visual attributes from volumetric chest CT examinations. Testing the model’s robustness included Community-acquired pneumonia and other non-pneumonia CT examinations. The dataset includes 4356 Chest CT examinations from 3322 patients. The model’s efficiency is assessed by AUC, responsiveness, and specificity, which were 95%, 93%, and 97%, respectively.
Hang et al. [11] declares that the correlation of the clinical lab and CT features with RT-PCR results is indeed uncertain. They tried to look into this correlation in-depth, particularly in recovered patients. In this study, 52 hospitalized COVID-19 patients were considered who were released after two cycles of consecutively negative RT-PCR results. CRP values dropped significantly as compared to admission levels, and the number of lymphocytes naturally increased after negative tests of RT-PCR. In turn, significantly improved oxidative exudation was found on CT in the chest except in 2 patients who had advanced towards recovery. Seven patients had positive RT-PCR results again at the two-week follow-up after discharge, including the two patients who progressed towards recovery. Out of 7 patients, two patients showed new GGO. [11] shows that GGO is an important clinical finding that should be taken into consideration.
Invariably, if a patient has COVID-19 symptoms, such as fever, cough, or breathlessness, an X-ray of chest area should be done [1]. The most common anomalous finding is GGO, implying that a few sections of the lungs look like some “hazy” shade of grey rather than being black (air) with subtle white blood vessel markings. It looks sort of like frosted glass. Furthermore, it is essential to remember that chest X-rays are not very sensitive to COVID-19 and often show false negatives.
It is evident from the literature survey that there are still problems with RT-PCR and associated waiting times throughout the world. Nonetheless, many major U.S. radiology groups have been releasing announcements over the past few weeks, clarifying that CT must be used liberally with respect to COVID-19. One can consider CT image findings with other relevant information to diagnose and treat the patient with COVID-19.
Methodology
Chest CT gives a far more comprehensive view of any abnormal condition than chest X-rays. The most common CT finding in COVID-19 is GGO spread across the lungs. They reflect small air-sacs or alveoli that are filled with fluid and transformed into grey color on a CT scan. In extreme cases, more fluid can collect in the lung lobes, resulting in a substantial white “consolidation” of the ground glass look. Eventually, “crazy paving” pattern starts developing which arises due to inflammation of the interstitial area in the edges of the lung lobules. These three CT observations GGO, consolidations, and crazy paving patterns, occurs combinedly or in an individual fashion for different patients. GGO is typically the very first indication whereas consolidations and crazy paving patterns subsequently accompany it. These observations typically occur in multiple lobes, and much more frequently impact the outermost or peripheral lungs. The results are usually restricted to only one lobe in moderate or recuperating COVID-19 cases. So, it is no wonder that the disease’s severity is directly proportional to the volume of the lung affected. Usually, the severe cases have the most severe findings on chest CT. As the patients recover, the GGO and consolidation diminish slowly.
The proposed approach focuses on two segmentation tasks that are solved with Semantic Segmentation techniques. Semantic segmentation is a task in which an image is classified at a pixel-level. This is known as Pixel-level classification. It is an important computer vision task that gained more attention in the medical field. Typical segmentation of any object from an image can be done using classical techniques such as Watershed Segmentation, Adaptive thresholding and Morphological Based Segmentation. But due to the complexity and randomness in the images, deep learning techniques using Convolution Neural Networks (CNN), Machine learning techniques such as saliency maps with principal component analysis [4], clustering [5] are used to segment.
Two deep learning models are trained in this study. The first deep learning model segments left and right lung spaces separately in the Chest CT slice. The second deep learning model predicts anomalies such as GGO, consolidation, and pleural effusions in the Chest CT slice. Later, volumetric analysis is conducted using predictions from both the models to calculate volume percentage infection of individual anomalies. Input for the volumetric analysis module is the 3D CT scan containing multiple slices. Finally, this volumetric analysis module is integrated with the risk assessment module.
Datasets
For the first segmentation task, the dataset of Chest CT scan to segment left and right lung spaces is collected from Kaggle resource [6], which contains 20 Full Chest CT scans (each scan containing ~ 301 images). The annotated samples contain two labels, left lung (= 1) and right lung (= 2). The size of a slice in a CT scan is 512 × 512 pixels, and the same is retained for the masks. A segmented slice is shown in Fig. 1.
Fig. 1.
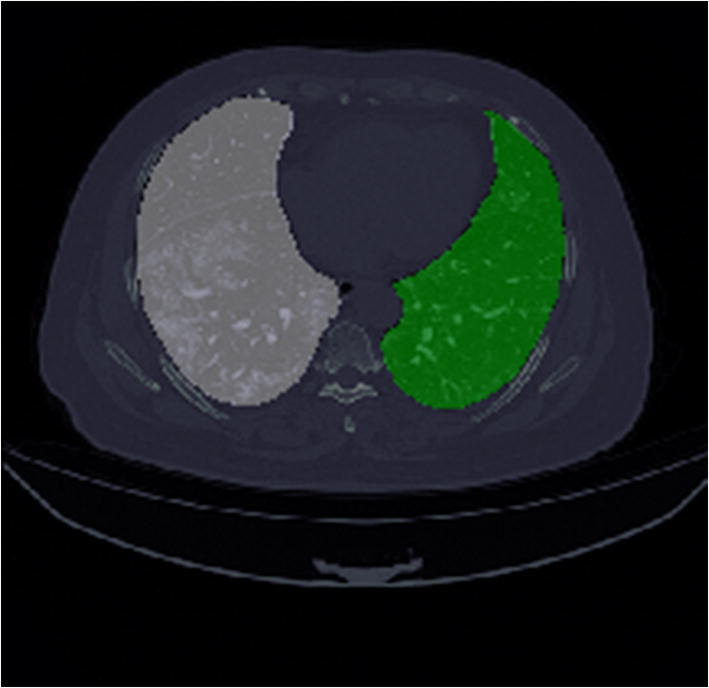
Segmented lung mask: white color indicates left lung, green indicates the right lung
For the second segmentation task, the Chest CT scans dataset is collected from the source [7], which contains 929 slices of more than 50 patients, which are segmented with the MedSeg annotation tool. The size of the image slices is 512 × 512 pixels, and the same is retained for the masks. Three anomalies are segmented, i.e., GGO (mask value = 1), consolidation (= 2), and pleural effusion (= 3), including background (= 0). A segmented sample image is pictured in Fig. 2.
Fig. 2.
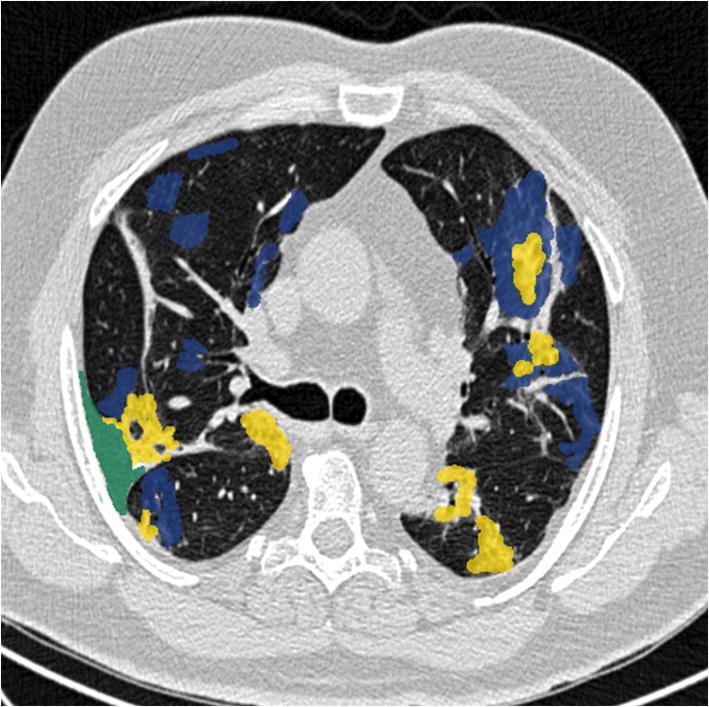
Segmented COVID-19 CT axial slice: GGO in blue, consolidation in yellow, pleural effusion in green
Model architecture
In this study, CNN-based Semantic Segmentation is used to perform two segmentation tasks. CNN-based semantic segmentation architecture contains an underlying U-Net architecture [24] that includes up-sampling and down-sampling convolutions. With an increase in its application, the U-Net architecture has been upgraded in many versions by changing types of convolutions used, hyperparameters used, dilated convolution approaches [10], changes in the backbone network, pyramid methods, supervised, weakly-supervised and unsupervised methods and feature fusion model [3].
Similarly, this study also employs the backbone network as U-Net but modified hyperparameters such as types of convolutions (up and down), attention gates, spatial pyramid pooling blocks, representation of filters in a Fibonacci series fashion which improved the performance of the trained model and decreases the training time.
Only one 2D CNN architecture with U-Net as a backbone is employed to solve both the segmentation tasks. A glimpse of the 2D CNN architecture used in this study is displayed in Fig. 3 and reference of Fig. 3 is presented in Fig. 4.
Fig. 3.
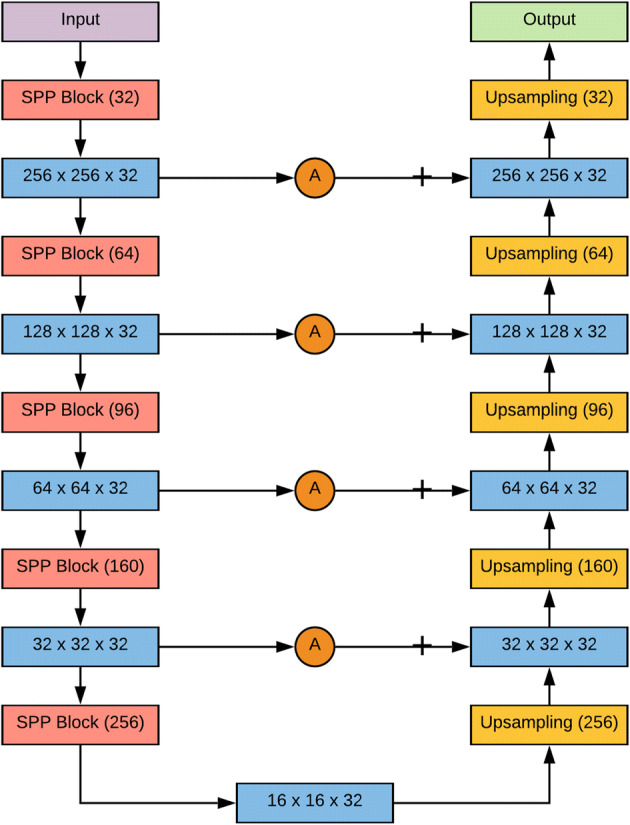
Proposed 2D CNN architecture with UNet as backbone and modified hyperparameters
Fig. 4.
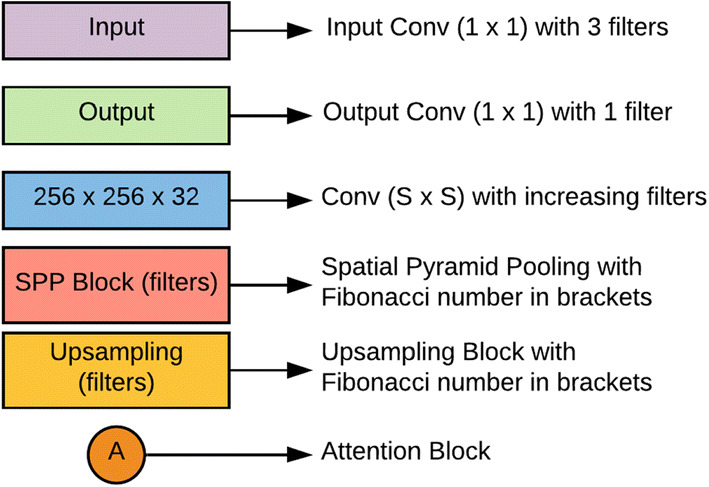
References of the blocks present in the proposed architecture
The architecture contains different types of blocks: spatial pyramid pooling (SPP) block, downsampling block, upsampling block, attention gate block, input block, and output block. SPP block [12] is used for a versatile approach to accommodate the various dimensions, sizes, aspect ratios, and to get spatial information. These issues are significant in visual recognition and SPP blocks are used in deep neural networks to get spatial information or global structures in the image. SPP block plays a significant role in object detection and semantic segmentation. This approach prevents the recalculation of the convolutional features. The detailed depiction of the SPP module used for this analysis is shown in Fig. 5.
Fig. 5.
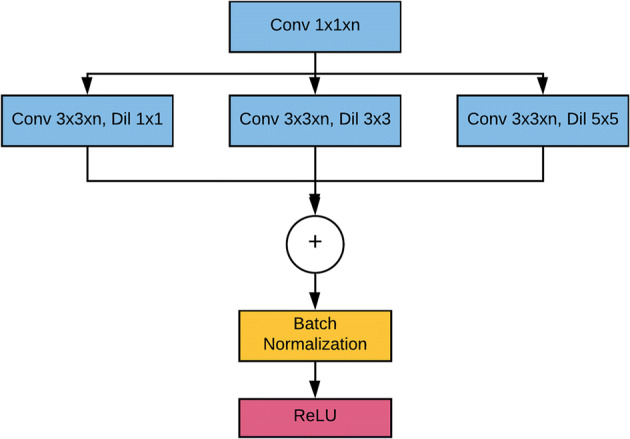
Spatial Pyramid Pooling (SPP) block
Down-sampling block comprises a standard convolution followed by a max-pooling convolution [20], which reduces the input convolution dimensions to half of its original dimensions. A convolution explicitly maps an input pixel with all its channels towards an output pixel. It is often utilized to reduce the number of depth channels since it is often very slow to multiply convolutions with very large depths The down-sampling block is described in Fig. 6(a).
Fig. 6.
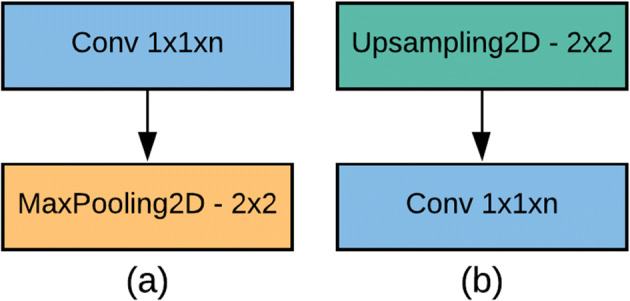
(a) Down-sampling block, (b) Up-sampling block
The up-sampling block contains a standard convolution followed by an up-sampling convolution, which increases the input convolution dimension by from its original dimensions. Up-sampling is a stridden convolution going backward. Another way of linking coarse outputs with dense pixels is through interpolation. A linear map calculates each output from the nearest four inputs using basic bilinear interpolation, which depends only on the input and output cells’ relative locations. The block of up-sampling is depicted in Fig. 6(b).
Attention gates [22, 25] are applied in this architecture to improve the segmentation performance. While performing object detection in an image, object localization and classification have to be handled whereas semantic segmentation is a pixel-level classification where object localization is avoided. If object localization is avoided, then the boundaries of the desired object might deteriorate significantly. Attention gates are embedded in the proposed architecture to perform object localization so that the necessity of external object localization is eliminated while also increasing the sensitivity and accuracy of the model. Both the input and output blocks contain convolution with only one filter.
Batch Normalization [13] is used as a regularization technique to avoid overfitting the data. Throughout the blocks (except the last one), the activation function used is Rectified Linear Unit (ReLU) [21]. The last layer uses a sigmoid activation function. The depth of the proposed architecture is five and ends up till the convolution dimensions become , and then up-sampling starts. The number of filters after every down-sampling and up-sampling block remains throughout the architecture, as it gave a significant improvement in terms of efficiency. The number of filters in each SPP block increases in a Fibonacci sequence, i.e., till the bottom of architecture () and decreases in reverse order till the end of the output block.
Integration with the healthcare system
Among nucleic acid tests, the RT-PCR test is a gold standard for COVID-19 diagnosis and has reported sensitivity up to 75% [19]. Although this is a decent performance, this could create a problem on a large scale [8, 17, 26, 27] reports that there is a high False Negative rate for RT-PCR test in COVID-19 diagnosis, and it could have severe repercussions considering the high infection rate of COVID-19. The other problem is that the RT-PCR test is time-consuming by design. Generally, lab processes take 6 to 8 hours. Moreover, sample collection and transport logistics also increase the time consumption, which further delays the results.
The COVID-19 risk score prediction from CT scans could be used to triage patient diagnosis in multiple ways:
As the RT-PCR test is time-consuming, it might take longer than usual to get the test results in remote areas (due to lack of equipment and personnel). In such a case, a risk score from a CT scan can be used to isolate the patient, start preliminary treatment, and contact tracing.
Due to its high false-negative rate, RT-PCR could result in misdiagnosis even though the patient is showing strong COVID-19 related symptoms. In this case, the doctor can get a risk score from CT scan analysis and initiate another RT-PCR test.
The risk score from CT scan analysis can be employed to prioritize the order in which RT-PCR tests are conducted. The labs can be asked to prioritize the tests of those patients first for whom the risk score is high.
The study also aims to suggest a holistic system of risk assessment using radiology and patient clinical symptoms. Based on clinical symptoms, like fever, dry cough, etc., a COVID-19 risk score can be generated, ranging from , where being the highest risk. Similarly, a risk score based on CT-scans can also be generated. The doctor can then use these two risk scores (symptom-based and CT scan based) to make better-informed decisions.
Another application of this system is to assist radiologists in CT scan analysis. Although the proposed system identifies anomalies in CT scan at par with experienced radiologists, using the proposed method can still help them in two ways:
The proposed model provides quantitative values of CT features that are less open to ambiguous interpretation. For instance, a standard CT scan report provides qualitative measures such as “mild consolidation in the lower right lobe,” whereas the proposed system predicts quantitatively like “13% of lung volume infected with consolidation”. This will lead to more deterministic and consistent actions.
As healthcare systems around the world struggle with COVID-19, multiple countries have had to pull in medical professionals and radiologists with minimal experience in the field to help at the frontlines. There have been cases where even final year medical college students have been asked to assist. In such cases, an AI system that learns from thousands of CT scans labeled by experienced radiologists can help them in doing a better analysis.
Track patient recovery
As mentioned above, the proposed model provides quantitative analysis for CT features, and it can be used for patient recovery (or worsening) tracking. Multiple CT scans conducted at different times can be compared using the proposed system and can be used to track how patient conditions change. This change in conditions is hard to ascertain manually as radiologists have to go through multiple slices of the CT scan ( or more) for CT scans done at different instants of time and compare features. Figure 7 depicts a sample case of tracking patient recovery.
Fig. 7.
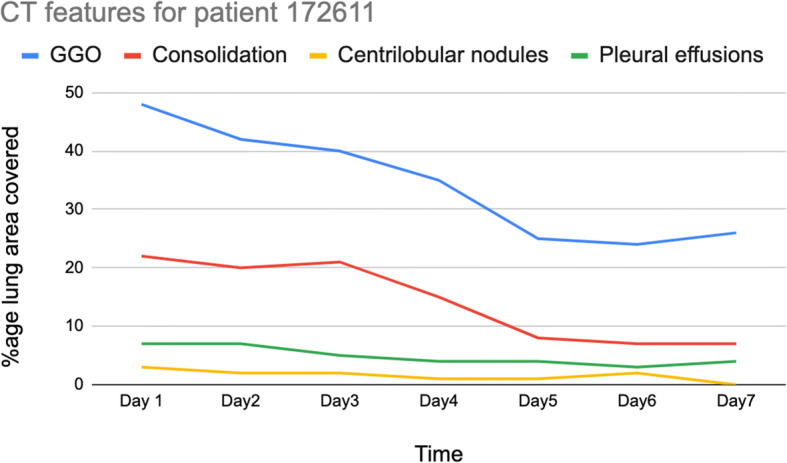
Tracking patient recovery
This has potential applications in studying the efficacy of different drugs/treatments for COVID-19 as well. Different treatments/drugs can be administered to separate groups of patients. The quantitative lung conditions calculated by the proposed model can be compared to analyze the relative performance. This kind of analysis will give better insights to cross-verify which treatments/drugs work better and help save lives.
Implementation protocol
The proposed 2D CNN architecture is implemented using Python and TensorFlow and was trained in a Kaggle notebook with 14 GB RAM, 16 GB GPU. Training and Validation splits followed a ratio of 9:1. Adam optimizer [16] with an initial learning rate of 0.0001 is defined. Because of the semantic segmentation and masks containing continuous integers (i.e., values of GGO = 1, consolidation = 2, and pleural effusion = 3), sparse categorical cross-entropy loss function is chosen. The total number of epochs to train the model is fixed at 200. After significant learning on the training set, the model starts overfitting on the training set and performs comparatively poorly on the unseen examples. To avoid such overfitting and to make models learn in a generalized fashion (neither under-fitted nor over-fitted), early stopping is applied.
Result
The proposed CNN model is benchmarked against the standard U-Net [24] and Attention U-Net [22] on the same dataset. The quantitative results of the second semantic segmentation task (tabulated in Table 1) were compared against existing metrics such as accuracy (F1-Score), loss, and mean intersection over union (Mean IoU) used in [23]. Mean IoU is an evaluation metric used in semantic segmentation problems in which firstly, the IoU for each mask value is computed and then average is computed for different mask values. The results of the first semantic segmentation task are used to segment out the lung spaces, i.e., left and right, then these predictions are used for calculating anomaly volumes.
Table 1.
Comparison of different models against the same dataset using three metrics
As discussed earlier, early stopping is used while training, and the model started overfitting after the 53rd epoch, so the training process was terminated automatically to prevent overfitting. The proposed model outperforms the traditional U-Net and Attention U-Net models as it can be observed in Table 1, although they were trained on the same dataset. Moreover, the attention block and SPP block perform consistently better than Attention blocks with regular convolutions. The proposed model had achieved a high F1-Score and Mean IoU of 97.31%, 84.6%, respectively. It is also observed that adopting Fibonacci sequence patterns in layers, using convolutions, limiting the number of filters in downsampling and upsampling to 32 filters have collectively resulted in a better performance.
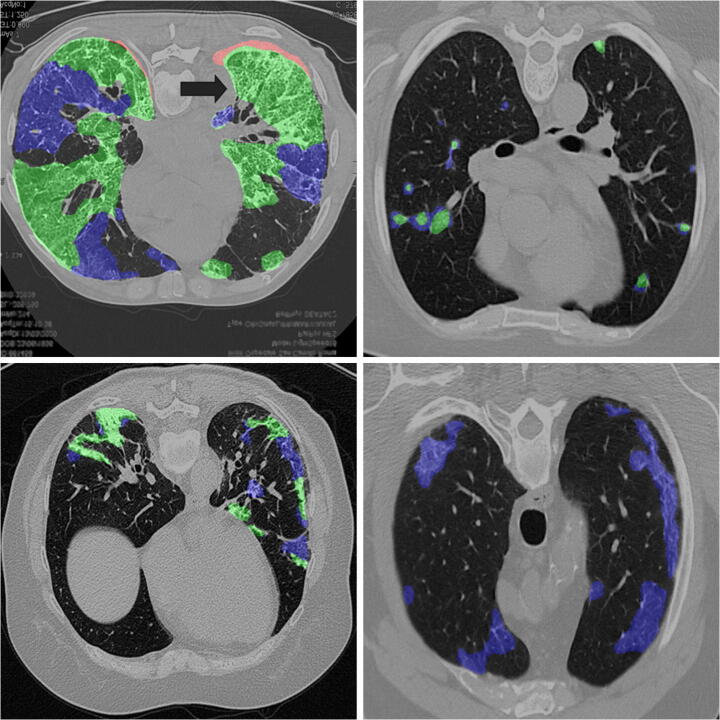
Figure 8 CT slices. This model performs well on CT scans of COVID-19 patients in real-time, helping doctors to make a better decision while diagnosing a patient. Color encodings help doctors to point out anomalies quickly as compared to the manual analysis. Based on the affected area, one can quickly diagnose how severe the condition is, i.e., whether to put a patient on a ventilator or to treat him with routine procedures.
Fig. 8.
Predicted scans with color encodings: GGO is in Blue, Consolidation in Green, Pleural Effusion in Red
Typically, a CT scan contains 64 or more slices predicting anomalies just on one slice gives details about that slice only, but predicting anomalies for the whole CT scan offers an overall analysis of the condition. This provides the volumetric analysis, i.e., volume of an individual anomaly in the left lung or right lung which is being calculated by the proposed web application. If an application like this provides quantitative analysis like “a certain volume of anomaly is present in the left or right lung” to doctors, then it can help them to diagnose patients in a better way. Volumetric analysis is performed for a Chest CT scan present in the validation set, and a sample of that is tabulated in Table 2. It depicts how much volume is occupied by GGO, consolidation, and pleural effusion in the left and right lung capacity. It is clearly shown that 13.50167% of the anomalous region is present in the left lung, 13.41888% in the right lung. If the medical professional submits just one slice of CT scan, they will get an output as area analysis for that slice and if they submit the whole CT scan, they will get a volumetric analysis. Thus, web application allows the doctor to perform analysis at a slice level and scan level both.
Table 2.
Volumetric analysis of chest CT scan
| Abnormalities | In Left lung (%) | In Right lung (%) |
|---|---|---|
| GGO |  |
 |
| Consolidation |  |
 |
| Pleural Effusion |  |
 |
| Total Anomaly Capacity |  |
 |
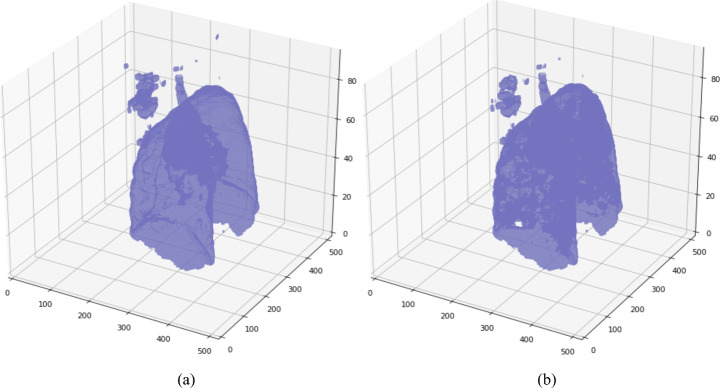
An attempt has been made to reconstruct a 3D Lung scan using Python libraries. Figure 9(a) illustrates the 3D reconstructed volume of the lung spaces from the input scan and Fig. 9(b) represents the 3D reconstructed volume of lung spaces and all anomalies present in them. The thickened purple color in Fig. 9(b) depicts the anomalies present in the lungs, whereas Fig. 9(a) illustrates only lung space.
Fig. 9.
(a) 3D reconstructed volume of lung spaces. (b) 3D reconstructed volume of infected lungs
Conclusion and future scope
As coronavirus has started community-spread throughout the world, the diagnosis process should be as foolproof as possible so that no false negatives or false positives are entertained. Integrating AI based models for diagnosing using CT scans along with RT-PCR and Rapid test kits will reduce the possibility of misdiagnosis many folds.
The proposed approach is aimed to provide aid to doctors in a more accurate diagnosis of COVID-19. In this study, two segmentation tasks are performed: one that segments lung spaces out of CT slices and another to segment anomalies present in Chest CT scan that are relevant to COVID-19 disease. Chest CT scan datasets from GitHub and Kaggle are used in the study to perform semantic segmentation. Both the segmentation tasks resulted in a full-fledged Chest CT scan prediction which is further followed by volumetric analysis to give a quantitative analysis of anomalies related to COVID-19. U-Net architecture is employed as the backbone of the proposed architecture with modifications in hyperparameters which helped to improve the performance of the proposed model and reduce the training time. Utilizing the model developed for tracking patient recovery is also suggested. Future work includes improving 3D reconstructed volumes that can visually make diagnosis simpler and make it easier to detect anomaly location. The model’s performance can be validated with larger datasets of COVID-19 patients as the data becomes available. Moreover, integrating serology parameters could make patient recovery modules still more concrete.
Footnotes
Publisher’s Note
Springer Nature remains neutral with regard to jurisdictional claims in published maps and institutional affiliations.
Contributor Information
Maheshwar Kuchana, Email: maheshwar.kuchana.16mec@bmu.edu.in.
Amritesh Srivastava, Email: srivastava.amritesh09@gmail.com.
Ronald Das, Email: ronald1das@gmail.com.
Justin Mathew, Email: justin.james.mathew@gmail.com.
Atul Mishra, Email: atul.mishra@bmu.edu.in.
Kiran Khatter, Email: kiran.khatter@bmu.edu.in.
References
- 1.Ai T, Yang Z, Hou H, Zhan C, Chen C, Lv W, Tao Q, Sun Z, Xia L. Correlation of chest CT and RT-PCR testing for coronavirus disease 2019 (COVID-19) in China: A report of 1014 cases. Radiology. 2020;296(2):E32–E40. doi: 10.1148/radiol.2020200642. [DOI] [PMC free article] [PubMed] [Google Scholar]
- 2.Caruso D, Zerunian M, Polici M et al (2020) Chest CT features of COVID-19 in Rome, Italy. Radiology 296(2):E79–E85. 10.1148/radiol.2020201237 [DOI] [PMC free article] [PubMed]
- 3.Chen Y, Tao J, Liu L et al (2020) Research of improving semantic image segmentation based on a feature fusion model. J Ambient Intell Human Comput. 10.1007/s12652-020-02066-z
- 4.Chen Y, Tao J, Zhang Q, Yang K, Chen X, Xiong J, Xia R, Xie J, Lu H (2020) Saliencydetection via the improved hierarchical principal component analysis method.Wirel Commun Mob Comput 2020. 10.1155/2020/8822777
- 5.Coleman GB, Andrews HC. Image segmentation by clustering. Proc IEEE. 1979;67(5):773–785. doi: 10.1109/PROC.1979.11327. [DOI] [Google Scholar]
- 6.COVID-19 CT scans in Kaggle. https://www.kaggle.com/andrewmvd/covid19-ct-scans. Accessed 10 Apr 2020
- 7.COVID-19CT segmentation dataset. http://medicalsegmentation.com/covid19/. Accessed 25 May 2020
- 8.Di Paolo M, Iacovelli A, Olmati F, Menichini I, Oliva A, Carnevalini M, Graziani E, Mastroianni CM, Palange P. False-negative RT-PCR in SARS-CoV-2 disease: experience from an Italian COVID-19 unit. ERJ Open Res. 2020;6(2):00324–02020. doi: 10.1183/23120541.00324-2020. [DOI] [PMC free article] [PubMed] [Google Scholar]
- 9.GitHub Repository containing CT scan images. https://github.com/UCSD-AI4H/COVID-CT. Accessed 25 May 2020.
- 10.Hamaguchi R, Fujita A, Nemoto K, Imaizumi T Hikosaka S (2018) Effective use of dilated convolutions for segmenting small object instances in remote sensing imagery. IEEE Winter Conference on Applications of Computer Vision (WACV), Lake Tahoe, NV, 2018, pp 1442-1450. 10.1109/WACV.2018.00162
- 11.Hang Fu, Huayan Xu, Na Zhang etal (2020) Association between Clinical, Laboratory and CT Characteristics and RT-PCR Results in the Follow-up of COVID-19 patients. medRxiv. 10.1101/2020.03.19.20038315
- 12.He K, Zhang X, Ren S, Sun J (2014) Spatial pyramid pooling in deep convolutional networks for visual recognition. IEEE Trans Pattern Anal Mach Intell 37. 10.1109/TPAMI.2015.2389824 [DOI] [PubMed]
- 13.Ioffe S, Szegedy C (2015) Batch normalization: Accelerating deep network training by reducing internal covariate shift. ArXiv, abs/1502.03167
- 14.Jin S, Wang B, Xu H et al (2020) AI-assisted CT imaging analysis for COVID-19 screening: Building and deploying a medical AI system in four weeks, medRxiv. 10.1101/2020.03.19.20039354 [DOI] [PMC free article] [PubMed]
- 15.Kim H, Hong H, Yoon SH (2020) Diagnostic performance of ct and reverse transcriptase-polymerase Chain reaction for coronavirus disease 2019: A meta-analysis. Radiology 201343. 10.1148/radiol.2020201343 [DOI] [PMC free article] [PubMed]
- 16.Kingma DP, Ba J (2015) Adam: A method for stochastic optimization. CoRR,abs/1412.6980
- 17.Kucirka LM, Lauer SA, Laeyendecker O, Boon D, Lessler J (2020) Variation in false-negative rate of reverse transcriptase polymerase chain reaction-based SARS-CoV-2 tests by time since exposure. Ann Intern Med, M20-1495. Advance online publication. 10.7326/M20-1495 [DOI] [PMC free article] [PubMed]
- 18.Li L, Qin L, Xu Z, Yin Y, Wang X, Kong B, Bai J, Lu Y, Fang Z, Song Q, Cao K, Liu D, Wang G, Xu Q, Fang X, Zhang S, Xia J, Xia J. Using artificial intelligence to detect COVID-19 and community-acquired pneumonia based on pulmonary CT: Evaluation of the diagnostic accuracy. Radiology. 2020;296(2):E65–E71. doi: 10.1148/radiol.2020200905. [DOI] [PMC free article] [PubMed] [Google Scholar]
- 19.L. C.O. America (2020) Accelerated Emergency Use Authorization (EUA) Summary COVID-19 RT-PCR Test
- 20.Nagi J et al (2011) Max-pooling convolutional neural networks for vision-basedhand gesture recognition. IEEE International Conference on Signal and ImageProcessing Applications (ICSIPA), Kuala Lumpur, 2011, pp 342-347. 10.1109/ICSIPA.2011.6144164
- 21.Nair V, Hinton GE (2010) Rectified linear units improve restrictedboltzmann machines. In Proceedings of the 27th International Conference onInternational Conference on Machine Learning (ICML). Omnipress, Madison, pp 807–814
- 22.Oktay O, Schlemper J, Folgoc LL, Lee MJ, Heinrich M, Misawa K, Mori K, McDonagh SG, Hammerla N, Kainz B, Glocker B, Rueckert D (2018) Attention U-Net: Learning where to look for the pancreas. ArXiv, abs/1804.03999
- 23.Rahman MA, Wang Y (2016) Optimizing intersection-over-union in deep neural networks for image segmentation. ISVC
- 24.Ronneberger O, Fischer P, Brox T. U-Net: Convolutional networks for biomedical image segmentation. LNCS. 2015;9351:234–241. doi: 10.1007/978-3-319-24574-4_28. [DOI] [Google Scholar]
- 25.Schlemper J, Oktay O, Schaap M, Heinrich M, Kainz Bernhard, Glocker Ben, Rueckert Daniel (2019) Attention gated networks: Learning to leverage salient regions in medical images. Med Image Anal 53. 10.1016/j.media.2019.01.012 [DOI] [PMC free article] [PubMed]
- 26.Woloshin S, Patel N, Kesselheim AS. False negative tests for SARS-CoV-2 infection - Challenges and Implications. N Engl J Med. 2020;383(6):e38. doi: 10.1056/NEJMp2015897. [DOI] [PubMed] [Google Scholar]
- 27.Xiao AT, Tong YX, Zhang S. False negative of RT-PCR and prolonged nucleic acid conversion in COVID-19: Rather than recurrence. J Med Virol. 2020 doi: 10.1002/jmv.2585510.1002/jmv.25855. [DOI] [PMC free article] [PubMed] [Google Scholar]


