

Abstract
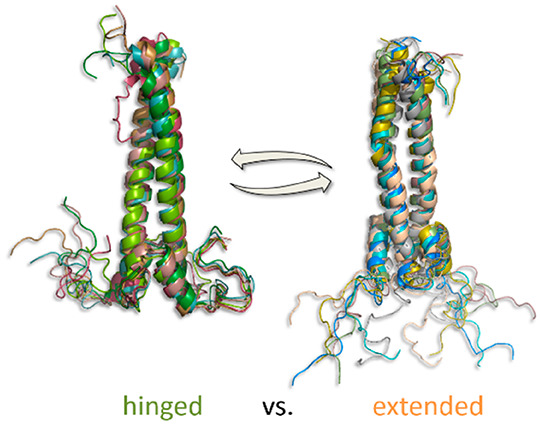
We report a conformational switch between two distinct intrinsically disordered subensembles within the active site of a transcription factor. This switch highlights an evolutionary benefit conferred by the high plasticity of intrinsically disordered domains, namely, their potential to dynamically sample a heterogeneous conformational space housing multiple states with tailored properties. We focus on proto-oncogenic basic-helix–loop–helix (bHLH)-type transcription factors, as these play key roles in cell regulation and function. Despite intense research efforts, the understanding of structure–function relations of these transcription factors remains incomplete as they feature intrinsically disordered DNA-interaction domains that are difficult to characterize, theoretically as well as experimentally. Here we characterize the structural dynamics of the intrinsically disordered region DNA-binding site of the vital MYC-associated transcription factor X (MAX). Integrating nuclear magnetic resonance (NMR) measurements, molecular dynamics (MD) simulations, and electron paramagnetic resonance (EPR) measurements, we show that, in the absence of DNA, the binding site of the free MAX2 homodimer samples two intrinsically disordered conformational subensembles. These feature distinct structural properties: one subensemble consists of a set of highly flexible and spatially extended conformers, while the second features a set of “hinged” conformations. In this latter ensemble, the disordered N-terminal tails of MAX2 fold back along the dimer, forming transient long-range contacts with the HLH-region and thereby exposing the DNA binding site to the solvent. The features of these divergent substates suggest two mechanisms by which protein conformational dynamics in MAX2 might modulate DNA-complex formation: by enhanced initial recruitment of free DNA ligands, as a result of the wider conformational space sampled by the extended ensemble, and by direct exposure of the binding site and the corresponding strong electrostatic attractions presented while in the hinged conformations.
Cellular regulation relies upon a large battery of transcription factors (TFs)1 and their DNA interactions. Despite widespread medicinal, pharmacological, and biological interest, many essential features of DNA-TF recognition remain poorly understood notwithstanding long-standing research efforts. In this regard, the particular importance of intrinsic disorder, i.e., the occurrence of domains void of any stable secondary or tertiary structure, has become increasingly evident.2−5 Uversky, Dunker, and co-workers found that intrinsically disordered regions (IDRs) promote TF efficiency through enhanced conformational plasticity, endowing these domains with the potential to sample a multitude of conformations with distinct properties and thus also with multifunctionality.6 Similarly, Dyson and Wright have shown that IDR-related binding events are often facilitated by transient complexes that dynamically evolve to form high-affinity complexes.7
However, an atomic level description of intrinsic disorder in the active sites of TFs is still lacking, which obscures important insights. A deeper understanding of the role of intrinsic disorder in transcriptional regulation is highly desirable not only for the elucidation of fundamental structure–activity relationships but also for an understanding of the involvement of proto-oncogenic TFs in tumorigenesis8—two points that warrant deeper investigations.
Hence, we here aim at shedding light on intrinsically disordered active sites of TFs by providing an atomistic description of the conformational dynamics of the DNA-binding IDR of the MYC Associated factor X (MAX), an essential agent associated with a plethora of vital processes, including cell proliferation and apoptosis.9,10
In the cell nucleus MAX occurs as a coiled-coil homodimer, here denoted as MAX2, that consists of three domains (Figure 1a): (i) the basic intrinsically disordered N-terminal domain (NTD)11−13 that houses the DNA binding site, which constitutes the focus of this study, and (ii) a helix–loop–helix (HLH) segment that connects the NTD to (iii) a leucine zipper (LZ) that serves as an anchor between the two subunits that form the homodimer.
Figure 1.
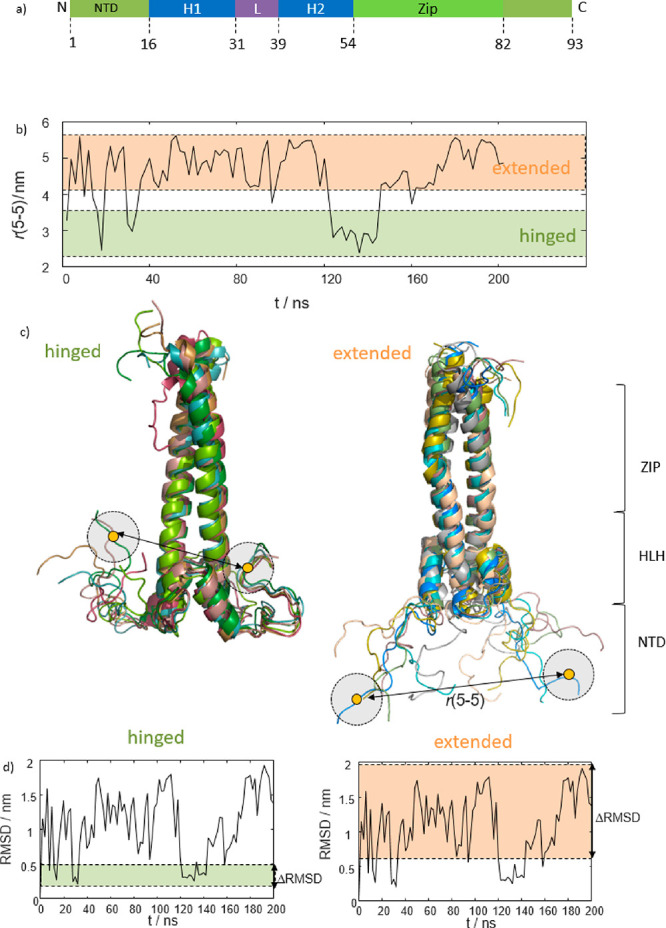
(a) Sketch of MAX2’s functional elements. The DNA-binding NTD spans residues 1–16, followed by a helix–loop–helix segment and a leucine zipper. (b) Evolution of distances r(5–5) between the Cα atoms of the two N-terminal R5 residues of each MAX subunit during an MD trajectory. (c) Structural representation of hinged (left) and extended (right) subensembles found during the MD trajectory of panel b. Examples for the R5–R5 distances are indicated. The two different subensembles account for the large distance fluctuations in panel b. Note that the hinged subensemble appears more defined than the extended one. The different MAX domains are indicated on the right. (d) RMSD of the NTD only relative to the starting structure. On the left, the narrow dispersion of the hinged ensemble is indicated in green (ΔRMSD < 0.3 nm). On the right the larger RMSD fluctuations of the extended ensemble are highlighted in orange (ΔRMSD > 1.3 nm). The RMSD analysis confirms that the extended subensemble is less constrained than the hinged one.
Despite the importance of the disordered NTD for the DNA recognition process, and in the overall cellular interaction network, a description of its structural dynamics has not been available. To date, only two structural studies, by Sauvé et al.14 and Sammak et al.,15 have examined its conformation, finding weak propensities for helical elements. To help provide the desired deeper understanding of disordered TFs and MAX2’s IDR in particular, we here provide detailed structural dynamics at residue resolution. To this end, we integrate data from nuclear magnetic resonance (NMR) measurements, molecular dynamics (MD) simulations, and electron paramagnetic resonance (EPR) spectroscopy. Similar approaches have already been successful in earlier work describing large-scale structural tuning of folded DNA-TF complexes16,17 and are here extended to the description of IDRs.
Investigations of HLH-type transcription factors by NMR have recently witnessed a renaissance as new methodological developments enable the needed high-resolution depictions of these challenging substrates. Brutscher and co-workers showed how a fragment-based analysis by NMR can reveal the conformational dynamics of HLH domains.18 Blackledge and co-workers have combined titration of denaturation agents with NMR to reveal residual structures in intrinsic disorder,19 while Somlyay et al. have shown how to determine interactions of HLH domains using 19F NMR.20 In addition, Macek et al. have used NMR to show that the MAX–Myc interaction can be interrupted by phosphorylation of Myc.21
Combinations of paramagnetic relaxation enhancement (PRE) NMR and MD have been successfully applied by Dobson et al. to describe structural ensembles of intrinsically disordered proteins (IDPs).22 Similarly, Salvi et al.,23 Shaw et al.24 and Ha-Duong et al.25 used MD and NMR to determine relaxation parameters and ensemble properties of IDPs. Combinations of EPR and MD, have likewise gained attention as ever longer MD trajectories have become available. Oganesyan et al.26 thus studied myoglobin conformational dynamics, Saxena et al. applied this combination to Cu(II)-binding proteins,27 and Trommer and co-workers found formerly unknown degrees of conformational plasticity of the maltose binding protein.28
Capitalizing on these developments, we here reveal a conformational switch between two distinct, intrinsically disordered subensembles29 which are sampled by the NTD of free MAX2.
This switch highlights the evolutionary-selected benefit of having intrinsically disordered domains, with high structural plasticity, which allow for dynamic sampling of conformational spaces with multiple distinct states, each endowed with tailored properties.
In particular, we describe a transition between (i) a subensemble that comprises conformationally extended states of the N-terminal tails of the MAX2 subunits which explore a wide range of sample space and (ii) a second subensemble of hinged conformations, which expose the DNA-binding site to the solvent when the disordered N-terminal tails (either one or both simultaneously) laterally fold back toward the HLH-domain.
To deepen our understanding of intrinsic disorder in MAX2 activity, we first combined all-atoms MD simulations with contact maps from paramagnetic NMR and nanoscale distance measurements from EPR to characterize the structural dynamics of DNA-free homodimers. Second, we compared our findings with similar data on MAX2–DNA complexes.
MD Simulations Reveal Bimodal Sampling of Disordered NTD States. Starting from the NMR-derived solution structure12 of MAX2, we began our investigations with all-atom MD simulations using explicit solvent (25 mM NaCl solution at pH 7.4 and a temperature of 310 K). These simulations provided the initial evidence for the bimodal conformational space of the intrinsically disordered NTD.
In addition to extended conformations, which are expected for an IDR, we also found conformations in which the N-terminal tails of either one—or often even both—subunits fold back toward the HLH domain. These hinged conformations sample a well-defined conformational space, yet do not adopt classical secondary structure elements.
The bimodal sampling of extended versus hinged conformations is readily seen, for example, by tracking the observed end-to-end distances between the two N-termini during the MD runs. Figure 1b shows the distance between the Cα atoms of residues R5 of the two MAX2 subunits (denoted r(5–5) in Figure 1b) for a 200 ns MD trajectory. Residue R5 was chosen for representation here to match experimental data presented in the following sections.
In the simulations, the NTD switches between two ensembles of conformations, one that features shorter distances r(5–5) < 3 nm and one with longer ones r(5–5) > 4 nm.
An analysis of the simulated protein conformations underlying the two identified distance populations reveals that the ensemble of short distances is exclusively composed of doubly hinged conformations (as those shown, for example, in Figure 1c, left) in which both subunits fold sideways back toward the HLH domains. A cluster analysis of the sampled distances corroborates this observation (see Figure S1.) The fluctuations of conformational RMSDs from the starting structure of this subensemble were found to be quite small (ΔRMSD < 0.3 nm; see Figure 1d) indicating that these conformations represent a defined feature of MAX2’s conformational space, clearly distinguishable from random-coil type structures.
In contrast, the ensemble leading to longer r(5–5) distances was traced back to extended conformations (Figures 1c (right) and S1) where the NTD stretches out into the solvent sampling a wide range of heterogeneous states. The more dynamic nature of the extended subensemble is reflected in larger fluctuations of the RMSDs from the starting structure (ΔRMSD > 1.3 nm; see Figure 1d, right).
Importantly, intermediate r(5–5) distances between 3 and 4 nm were only rarely observed, which indicates that the two ensembles are indeed distinct.
This conformational switch was seen in three independent MD runs (vide infra and Figure S2).
The energetic basis of the hinged conformation can be rationalized by examining the expected electrostatic interactions. A charge analysis of MAX2 can be found in Figure S3: the NTD is seen to be heavily positively charged, while the LZ zipper is strongly negatively charged. The large dipole moment30 spanned between the two axial termini would be expected to strongly attract the NTD toward the C-terminal part of the dimer, resulting in the observed back folding.
Paramagnetic Relaxation Enhancement NMR Corroborates a Bimodal Conformational Space. Guided by the MD results, we probed the conformational space of the NTD using PRE31 NMR experiments. The experimental data are consistent with the MD data, which confirmed the simulated structural ensembles. Additionally, residual conformational freedom within the hinged subensemble could be revealed.
In PRE NMR, signals of amino acids that transiently approach a paramagnetic spin-label (SL) are broadened because of accelerated nuclear relaxation, resulting in lowered signal amplitudes. The PRE effect can be quantified by the signal suppression ratio Vi = SiPRE/SiREF, where SiPRE is typically a 1H–15N NMR cross peak amplitude for the ith protein residue observed in the presence of the SL, and SiREF is the corresponding amplitude in a reference spectrum obtained with a chemically reduced diamagnetic label. This signal suppression ratio follows a steep r–6 proportionality, where r is the distance between the spin label and an observed amino acid, and thus depends also on the structural dynamics of the protein. The complete suppression of a signal (V = 0) always requires that r < 2.5 nm.32 Proximity measures are thus accessible between the labeling site and adjacent residues.33
For these experiments, we used a spin-labeled MAX mutant containing an R5C cysteine point mutation in the disordered NTD, which was then paramagnetically labeled with MTSL (S-(1-oxyl-2,2,5,5-tetramethyl-2,5-dihydro-1H-pyrrol-3-yl)methylmethanesulfonothioate) (cf. ref (16)).
Figure 2a shows signal suppression ratios V obtained for each amino acid of MAX2, arising from spin-labels incorporated at position R5C in both MAX2 subunits. (Both MAX2-subunits are identical; hence, values at each residue index report the combined signals from two amino acids.) We identified three significant PRE sites: (1) Site “S”, spanning residues 1–20, which shows ratios V < 0.1 because of proximity to the SL site in the primary amino acid sequence. (2) Site “L1”, between residues 35–45, which shows ratios V > 0.3, and (3) site “L2”, between residues 45–65, with ratios V > 0.5.
Figure 2.

(a) Residue dependence of experimental PRE signal suppression ratios V. Three distinct PRE sites are observed, indicated as S (short-range), L1 (long-range 1), and L2 (long-range 2). The spin label site R5C is indicated by the red dot. Reduced PRE values ≪1 indicate transient contacts between residue R5C and the lateral loop of the HLH (site L1) and LZ segments (site L2). (b) Calculated PRE values from the two different conformational ensembles (hinged and extended) sampled in an MD trajectory. The experimentally observed values can be reproduced within the precision of the approach that is outlined in the main text. The extended subensemble cannot account for long-range PREs, only for PREs at site S. The hinged ensemble could again be divided into two substates: one where residue R5 approaches the HLH domain and another one where it approaches the LZ domain. The former leads to reproduction of the effect at site L1 and the latter at site L2. The bottom panel displays a superposition of the theoretical PRE values from the different subensembles. The match between measured and calculated PREs shows that the MD simulation indeed captures the conformational properties of MAX2. (c) The simulated conformational ensembles used to calculate PREs for sites S, L1, and L2. The green dot indicates the position of residue R5, which was the SDSL site in the experiment.
The PREs observed for sites L1 and L2 necessarily stem from close approaches of residue R5C to these sites, i.e. from long-range contacts. The hinged conformational subensemble observed in the MD runs provides an intuitive explanation for these effects. To verify this hypothesis, we calculated theoretical PRE ratios using SL–1HN amide proton distances obtained from the structures sampled in the MD simulations. PRE rates and the resulting signal suppression ratios were determined following the approach of Wagner and co-workers (detailed explanations can be found in refs (17 and 32)). In brief, a PRE rate was calculated for each 1HN amide proton in each simulated conformation. This was done by using a spherical correlation function and a single effective correlation time τe that combines the effective electron relaxation time and the motion of the SL-1HN connection vector. The PRE rate Γ2,i for the 1HN atom of residue i is given by
| 1a |
with
| 1b |
ωL denotes the Larmor frequency of the proton. S denotes the electron spin number, and g is the electron’s g-factor. Importantly, r is the distance between the unpaired electron and the amide proton of residue i as extracted from the simulated conformations.
This was followed by a calculation of the arithmetic mean ⟨Γ2,i⟩ over the rates obtained for the different conformations. The resulting average was then used to calculate the ratio Vi for residue i using the approach detailed in refs: (17 and 32)
| 2 |
Here, R2,i denotes the intrinsic relaxation rate (absence of spin label) of the 1HN nucleus, and t denotes the time that the proton magnetization is transverse during a TROSY experiment.
With this strategy, we could predict the experimentally observed PRE effects. Figure 2b displays the results of the MD-based calculations. For each site a subensemble of simulated structures could be found that allowed reproducing the experimental data within the precision expected for this approach. (Spherical correlation functions oversimplify IDR dynamics as pointed out by Ferrage and co-workers.)34Figure 2c visualizes the ensembles of simulated conformations which were used to predict PREs for sites S, L1, and L2, respectively. Interestingly, the hinged subensemble contained two distinguishable sets of structures: One where the N-terminal tail housing residue R5C approaches the HLH domain (site L1) and a second one where it approaches the LZ domain (site L2). The different structures underlying these two “subsub-ensembles” are depicted in the center and bottom panels of Figure 2c, which shows how residue R5C laterally approaches the homodimer causing the experimentally observed long-range PREs.
Note that MTSL labeling can bias the conformational ensembles sampled by IDRs. However, the MD simulations here were run with the nonlabeled form of MAX2 and hence reflect the native, nonbiased ensemble. The agreement between simulation and experiment therefore suggests that biases due to the MTSL label are minimal.
The approach presented here thus provides a qualitative match between simulated and experimental data; a quantification of the ensemble populations would yet require much longer MD trajectories as well as knowledge of the exact forms of the spectral density function underlying the PRE effect.
Nanoscale Distance Measurements by EPR. To further characterize the conformational space of the NTD, we employed double electron–electron resonance (DEER, also referred to as PELDOR) measurements.35 DEER relies on pairwise site-directed spin labeling (SDSL) and the detection of the dipolar spin–spin coupling between the two unpaired electrons. Data are recorded in a flash-frozen solution, to provide a representative snapshot of the conformational ensemble present at the glass transition temperature of the sample. This method yields a distribution P(r) of distances r between the two SLs. These distances correspond to the structures found in the vitrified substrate—i.e., for the case at hand, to the conformations of MAX2’s NTD—as each features a particular spacing of the two labeled R5C residues.
We found P(r) to span a range of 1.5–4.5 nm (Figure 3a) indicating a wide array of underlying conformations. Figure 3b shows the underlying DEER form factor and fit. From the MD simulations, we expect the hinged subensemble to underlie short distances in P(r) and the extended subensemble to underlie longer distances.
Figure 3.

(a) Experimentally determined SL–SL distance distribution P(r) (black, error in red) obtained for the MTSL tagged R5C-R5C mutant. Superimposed are calculated distance distributions from precomputed rotamer libraries (blue for a hinged state and in red for an extended conformation). The Cα distances are indicated. The calculated distributions fit well within the experimentally determined distance range. (b) DEER form-factor (black) underlying the distance distribution in panel a and fit (red) as obtained through the Tikhonov regularization approach. (c and d) Simulated structures underlying the calculated distance distributions panel a. (e and f) Distance histograms of Cζ–Cζ distances for residues R5 obtained from two 200 ns long MD trajectory (panel e corresponds to Figure 1). Within the experimental precision (see main text), the simulated distances match the experimentally determined distances. (g and h) Evolution of Cα–Cα distances for residues R5 for the MD trajectory underlying the histograms in panels e and f.
To compare the measured EPR distribution with the MD results, we extracted Cζ–Cζ distances for residues R5 (denoted r(Cζ–Cζ) in Figure 3e,f) from each snapshot of two 200 ns long trajectories. (Cζ is the terminal carbon atom of the R5 arginine side chain and was chosen here to approximate the position of the unpaired electron in an MTSL labeled cysteine, which is the relevant reference point in our DEER experiments.) The resulting distance populations, as displayed through the histograms in Figure 3c,d, match the experimental distance distribution P(r) well, except for longer distances >4.5 nm, which would not be observable experimentally, but were sampled in the MD simulations (the DEER experiment was recorded with a maximal mixing time of 2.5 μs (cf. Figure 3b) such that distances above ca. 4.5 nm cannot be reliably extracted from the form-factor36).
Panels e and f in Figure 3 (similar to Figure 1c) represent the simulated distances as trajectories of r(Cα- Cα) distances for the two MD runs (see the Supporting Information for more replicas). Both show a comparable conformational switch between the two subensembles, as evidenced by the transitions between the two distance regimes of 2–3.5 nm for the hinged and 4–6 nm for the extended subensemble.
To exclude systematic errors in the analysis which might arise because the R5 side chain is two bonds shorter than the R5C-MTSL side chain, we calculated distance distributions using the MMM software package for a hinged and an extended conformation found in the MD simulations. In brief, using MMM we attached MTSL in silico to positions R5 and predicted a distance distribution based upon precomputed rotamer libraries.37Figure 3a shows the experimentally derived span of distances, superposed with those predicted for the extended and hinged structures. A good match could be achieved only when conformations from both subensembles were considered. Panels g and h of Figure 3 show the structures used for the MMM analysis and demonstrate how the hinged subensemble leads to shorter distances. When both MAX2 subunits are hinged, distances between ca. 2 and 3 nm can be accounted for, while the extended ensemble can only account for distances >3 nm, corroborating our initial expectations.
While the experimental data and simulations agree qualitatively, the DEER distance distributions do not feature two distinct distance distributions as one might expect from the MD trajectories. Two points contribute to this: (i) the MTSL spin label attached to position R5C features intrinsically high conformational plasticity, which can cause broadening of the measured distance distributions (as suggested by the MMM analysis, cf. Figure 3a) which would not manifest itself in simulations of the unlabeled protein and (ii) the Tikhonov regularization employed to extract the distance distributions from the dipolar evolution function may introduce an additional broadening.36
To investigate this further, we have run a complementary MD simulation with an MTSL-labeled R5C mutant (see Figure S10). This run showed partial overlap of the electron–electron distance distributions for the hinged and extended conformations, respectively, but with clearly distinguishable maxima. This indicates that a combination of effects arising from both the conformational flexibility of the SL and the data regularization procedure might contribute to broadening observed in the experimentally derived distance distribution.
CW EPR: Population Quantification. To quantify the relative populations of the extended and hinged subensembles, we fit room-temperature continuous-wave (CW) EPR spectra to simulated overlapping spectra, to represent a superposition of two spin-labeled protein conformations with different internal rotational correlation times (τc) of the SL (for details see the Supporting Information Script S1). Here, τc can be considered to be a measure of the mobility of the SL, and thus of the conformational plasticity of its local environment. The best fit to the data was obtained using a superposition in which ca. 85% of the ensemble is found in a more mobile state (τc = 0.14 ns), and 15% is in a more rigid state (τc = 1.18 ns.) Hence, assuming that the spin label in the hinged conformation experiences reduced rotational motion, and that it is thus represented by the slow simulation component, the hinged states make up 15% of the conformational space of MAX2’s NTD.
Additional supporting CW and DEER EPR data, including data for two further reference mutants, and simulations involving possible third subensembles can be found in Figures S4–S9.
Note that the populations found by CW EPR do not match those of the DEER distance distribution. While the former show higher populations of extended states, the shorter distances, corresponding to the hinged ensemble apparently dominate in the latter. However, the distance populations in the DEER experiments cannot be quantitatively interpreted, because short distance peaks with smaller distance distributions will appear overpopulated by the employed Tikhonov regularization-based data analysis, while longer distances with broader distance distributions will in turn be underrepresented. This is due to the summation of the damped cosine functions, i.e. form factors that represent the various conformations in the extended ensemble. The resulting sum converges to decay functions that resemble the DEER background and tend to not contribute to the experimental background corrected form factor.36 Moreover, the ensemble populations in the DEER experiments might be different from those in the CW EPR experiments because of the freezing of the sample at its glass-transition temperature. There an altered distribution might predominate, with increased populations of hinged conformations relative to ambient conditions.
Hence, within the precision of our approach the CW EPR and DEER data are both in agreement with the MD data.
Implications for DNA Binding. The combined experimental and MD data presented here for MAX2’s DNA-binding domain supports a model in which, in the absence of DNA, MAX2’s NTD samples two distinct subensembles with different properties, each of which likely plays a role in its regulatory activities. Intrinsic disorder in the DNA-binding NTD could assist in modulating binding to target DNAs, whereas the enhanced conformational plasticity enables a potent structural switch providing higher binding efficiencies as compared to a hypothetical permanently rigid binding site. Indeed, the importance of conformational switches for TF activity has been pointed out recently.38 Further observations of conformational subensembles in IDRs have been reported by Choi et al.39 and Na et al.40
For the case at hand, a mechanism appears intuitive in which extended NTD conformations recruit DNA to MAX2 by scanning a large sample space, sometimes also termed “fly casting”.41 In contrast, the hinged conformations expose the final DNA binding site to foster complex stabilization. Indeed, a heavily positively charged RKRRDH sequence (aa 13–18) at the core of the DNA binding site is exposed in the hinged subensemble, which might electrostatically attract DNA molecules from their initial encounter site toward their final position within the DNA–TF complex (Figure 4a). Because of the dimeric nature of MAX2, it is also possible that both subunits could act independently. While one NTD recruits the ligand, for example, the other may open the path to the binding site. It is well-known that, once bound,11 the NTD adopts a stable helical form. The detailed folding mechanism is, however, still a matter of debate. Both conformational selection and induced fit scenarios have been proposed.14,42 The conformational sampling reported here can however be reconciled with both models.
Figure 4.
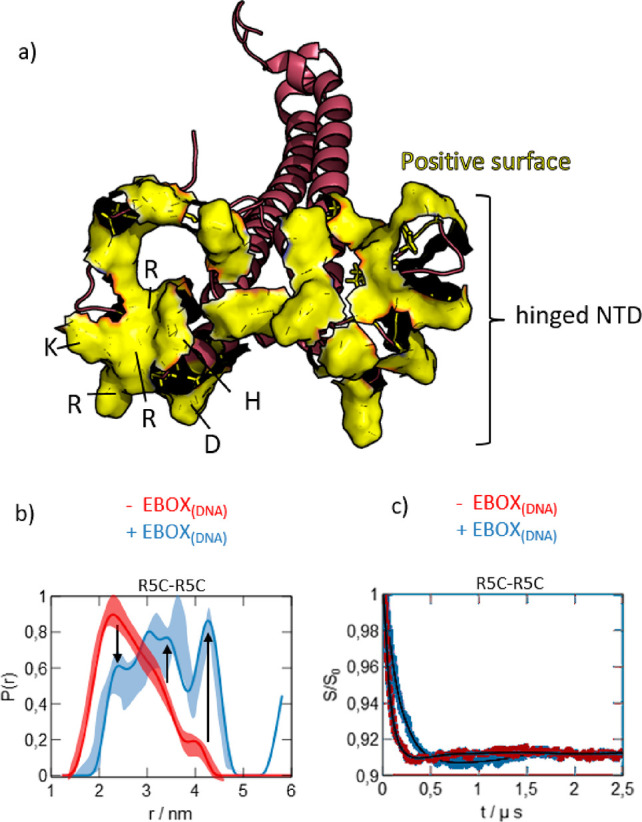
(a) Depiction of the solvent-exposed surfaces (yellow) of the positively charged amino acids in the NTD of a hinged conformation. The RKRRDH stretch is indicated. (b) DEER-derived distance distribution P(r) for the DNA-free R5C mutant (red) and a DNA-bound R5C mutant (blue) as published earlier (see main text). The errors are shown as superimposed shading. (c) Form factors and fits underlying the data in panel a (DEER signals before background correction are reported in Supporting Information Figure S6). Evidently, the sampled range of distances does not change significantly upon DNA binding. The arrows serve as a guide to the eye.
Finally, in our earlier work we could show that MAX2’s NTD undergoes substantial internal motions even when in the stable DNA-bound helical state. A comparison of the data16 for MAX2 bound to a DNA ligand with the results obtained here on DNA-free MAX2 shows that the range of end-to-end distances sampled by MAX2’s NTD is similarly broad (1.5–4.5 nm) in both the DNA-free and DNA-bound states. (Figure 4b,c shows DEER-derived distance distributions and form factors before (red) and after (blue) binding of DNA to MAX2 for the R5C-R5C double mutant.) This shows that the sampled conformational space is not reduced by DNA binding. Instead, comparable degrees of freedom on the nanometer scale appear to be conserved. Thus, penalties due to losses in conformational entropy upon binding might be mitigated.
In conclusion, experimental and computational characterization of intrinsic disorder in transcription factors such as MAX2 have recently advanced to a stage where detailed models of their structural dynamics can be developed, enabling the long-desired high-resolution description of their modes of action. It remains to be seen if this understanding can stimulate new developments, such as in rational drug design and molecular targeting.
Acknowledgments
Experiments have been recorded within the national facility RENARD at University of Lille (Fédération IR-RPE CNRS 3443). The project leading to this application received funding from the European Research Council (ERC) under the European Union’s Horizon 2020 research and innovation programme (Grant Agreement 801936). The authors thank Dr. Greg Olsen for fruitful discussions and comments.
Supporting Information Available
Data Availability: All data are available online under DOI: 10.5281/zenodo.4067759 or from the authors. The Supporting Information is available free of charge at https://pubs.acs.org/doi/10.1021/acs.jpclett.0c02242.
Experimental details for NMR and EPR experiments, supplementary CW EPR data, supplementary DEER data, supplementary MD data (replica with and without attached SL), cluster analysis of MD-derived distances, and MAX2 charge map (PDF)
Author Contributions
G.S. and T.K. contributed equally. G.S., H.V., and D.K. performed EPR and NMR experiments. T.K. performed MD simulations. K.L. expressed the protein samples. D.K. wrote the manuscript with help of all other authors.
The authors declare no competing financial interest.
Supplementary Material
References
- Lambert S. A.; Jolma A.; Campitelli L. F.; Das P. K.; Yin Y. M.; Albu M.; Chen X. T.; Taipale J.; Hughes T. R.; Weirauch M. T. The Human Transcription Factors. Cell 2018, 172 (4), 650–665. 10.1016/j.cell.2018.01.029. [DOI] [PubMed] [Google Scholar]
- Hilser V. J.; Thompson E. B. Structural dynamics, intrinsic disorder, and allostery in nuclear receptors as transcription factors. J. Biol. Chem. 2011, 286, 39675–39682. 10.1074/jbc.R111.278929. [DOI] [PMC free article] [PubMed] [Google Scholar]
- Vuzman D.; Levy Y. Intrinsically disordered regions as affinity tuners in protein-DNA interactions. Mol. BioSyst. 2012, 8 (1), 47–57. 10.1039/C1MB05273J. [DOI] [PubMed] [Google Scholar]
- Tu W. B.; Helander S.; Pilstal R.; Hickman K. A.; Lourenco C.; Jurisica I.; Raught B.; Wallner B.; Sunnerhagen M.; Penn L. Z. Myc and its interactors take shape. Biochim. Biophys. Acta, Gene Regul. Mech. 2015, 1849 (5), 469–483. 10.1016/j.bbagrm.2014.06.002. [DOI] [PubMed] [Google Scholar]
- Contreras-Martos S.; Piai A.; Kosol S.; Varadi M.; Bekesi A.; Lebrun P.; Volkov A. N.; Gevaert K.; Pierattelli R.; Felli I. C.; Tompa P. Linking functions: an additional role for an intrinsically disordered linker domain in the transcriptional coactivator CBP. Sci. Rep. 2017, 7 (1), 4676. 10.1038/s41598-017-04611-x. [DOI] [PMC free article] [PubMed] [Google Scholar]
- Liu J.; Perumal N. B.; Oldfield C. J.; Su E. W.; Uversky V. N.; Dunker A. K. Intrinsic disorder in transcription factors. Biochemistry 2006, 45 (22), 6873–88. 10.1021/bi0602718. [DOI] [PMC free article] [PubMed] [Google Scholar]
- Sugase K.; Dyson H. J.; Wright P. E. Mechanism of coupled folding and binding of an intrinsically disordered protein. Nature 2007, 447 (7147), 1021–5. 10.1038/nature05858. [DOI] [PubMed] [Google Scholar]
- Amati B.; Land H. Myc-Max-Mad: a transcription factor network controlling cell cycle progression, differentiation and death. Curr. Opin. Genet. Dev. 1994, 4 (1), 102–8. 10.1016/0959-437X(94)90098-1. [DOI] [PubMed] [Google Scholar]
- Blackwood E. M.; Eisenman R. N. Max - a Helix-Loop-Helix Zipper Protein That Forms a Sequence-Specific DNA-Binding Complex with Myc. Science 1991, 251 (4998), 1211–1217. 10.1126/science.2006410. [DOI] [PubMed] [Google Scholar]
- Conacci-Sorrell M.; McFerrin L.; Eisenman R. N. An Overview of MYC and Its Interactome. Cold Spring Harbor Perspect. Med. 2014, 4 (1), a014357. 10.1101/cshperspect.a014357. [DOI] [PMC free article] [PubMed] [Google Scholar]
- Fieber W.; Schneider M. L.; Matt T.; Krautler B.; Konrat R.; Bister K. Structure, function, and dynamics of the dimerization and DNA-binding domain of oncogenic transcription factor v-Myc. J. Mol. Biol. 2001, 307 (5), 1395–1410. 10.1006/jmbi.2001.4537. [DOI] [PubMed] [Google Scholar]
- Sauve S.; Tremblay L.; Lavigne P. The NMR solution structure of a mutant of the max b/HLH/LZ free of DNA: Insights into the specific and reversible DNA binding mechanism of dimeric transcription factors. J. Mol. Biol. 2004, 342 (3), 813–832. 10.1016/j.jmb.2004.07.058. [DOI] [PubMed] [Google Scholar]
- Brownlie P.; Ceska T. A.; Lamers M.; Romier C.; Stier G.; Teo H.; Suck D. The crystal structure of an intact human Max-DNA complex: New insights into mechanisms of transcriptional control. Structure 1997, 5 (4), 509–520. 10.1016/S0969-2126(97)00207-4. [DOI] [PubMed] [Google Scholar]
- Sauve S.; Naud J. F.; Lavigne P. The mechanism of discrimination between cognate and non-specific DNA by dimeric b/HLH/LZ transcription factors. J. Mol. Biol. 2007, 365 (4), 1163–75. 10.1016/j.jmb.2006.10.044. [DOI] [PubMed] [Google Scholar]
- Sammak S.; Hamdani N.; Gorrec F.; Allen M. D.; Freund S. M. V.; Bycroft M.; Zinzalla G. Crystal Structures and Nuclear Magnetic Resonance Studies of the Apo Form of the c-MYC:MAX bHLHZip Complex Reveal a Helical Basic Region in the Absence of DNA. Biochemistry 2019, 58 (29), 3144–3154. 10.1021/acs.biochem.9b00296. [DOI] [PMC free article] [PubMed] [Google Scholar]
- Sicoli G.; Vezin H.; Ledolter K.; Kress T.; Kurzbach D. Conformational tuning of a DNA-bound transcription factor. Nucleic Acids Res. 2019, 47 (10), 5429–5435. 10.1093/nar/gkz291. [DOI] [PMC free article] [PubMed] [Google Scholar]
- Kizilsavas G.; Ledolter K.; Kurzbach D. Hydrophobic Collapse of the Intrinsically Disordered Transcription Factor Myc Associated Factor X. Biochemistry 2017, 56 (40), 5365–5372. 10.1021/acs.biochem.7b00679. [DOI] [PubMed] [Google Scholar]
- Baronti L.; Hosek T.; Gil-Caballero S.; Raveh-Amit H.; Calcada E. O.; Ayala I.; Dinnyes A.; Felli I. C.; Pierattelli R.; Brutscher B. Fragment-Based NMR Study of the Conformational Dynamics in the bHLH Transcription Factor Ascl1. Biophys. J. 2017, 112 (7), 1366–1373. 10.1016/j.bpj.2017.02.025. [DOI] [PMC free article] [PubMed] [Google Scholar]
- Panova S.; Cliff M. J.; Macek P.; Blackledge M.; Jensen M. R.; Nissink J. W. M.; Embrey K. J.; Davies R.; Waltho J. P. Mapping Hidden Residual Structure within the Myc bHLH-LZ Domain Using Chemical Denaturant Titration. Structure 2019, 27 (10), 1537–1546. 10.1016/j.str.2019.07.006. [DOI] [PubMed] [Google Scholar]
- Somlyay M.; Ledolter K.; Kitzler M.; Sandford G.; Cobb S. L.; Konrat R. (19) F NMR Spectroscopy Tagging and Paramagnetic Relaxation Enhancement-Based Conformation Analysis of Intrinsically Disordered Protein Complexes. ChemBioChem 2020, 21 (5), 696–701. 10.1002/cbic.201900453. [DOI] [PubMed] [Google Scholar]
- Macek P.; Cliff M. J.; Embrey K. J.; Holdgate G. A.; Nissink J. W. M.; Panova S.; Waltho J. P.; Davies R. A. Myc phosphorylation in its basic helix-loop-helix region destabilizes transient alpha-helical structures, disrupting Max and DNA binding. J. Biol. Chem. 2018, 293 (24), 9301–9310. 10.1074/jbc.RA118.002709. [DOI] [PMC free article] [PubMed] [Google Scholar]
- Dedmon M. M.; Lindorff-Larsen K.; Christodoulou J.; Vendruscolo M.; Dobson C. M. Mapping long-range interactions in alpha-synuclein using spin-label NMR and ensemble molecular dynamics simulations. J. Am. Chem. Soc. 2005, 127 (2), 476–477. 10.1021/ja044834j. [DOI] [PubMed] [Google Scholar]
- Salvi N.; Abyzov A.; Blackledge M. Multi-Timescale Dynamics in Intrinsically Disordered Proteins from NMR Relaxation and Molecular Simulation. J. Phys. Chem. Lett. 2016, 7 (13), 2483–9. 10.1021/acs.jpclett.6b00885. [DOI] [PubMed] [Google Scholar]
- Lindorff-Larsen K.; Trbovic N.; Maragakis P.; Piana S.; Shaw D. E. Structure and Dynamics of an Unfolded Protein Examined by Molecular Dynamics Simulation. J. Am. Chem. Soc. 2012, 134 (8), 3787–3791. 10.1021/ja209931w. [DOI] [PubMed] [Google Scholar]
- Chan-Yao-Chong M.; Durand D.; Ha-Duong T. Molecular Dynamics Simulations Combined with Nuclear Magnetic Resonance and/or Small-Angle X-ray Scattering Data for Characterizing Intrinsically Disordered Protein Conformational Ensembles. J. Chem. Inf. Model. 2019, 59 (5), 1743–1758. 10.1021/acs.jcim.8b00928. [DOI] [PubMed] [Google Scholar]
- Oganesyan V. S.; Chami F.; White G. F.; Thomson A. J. A combined EPR and MD simulation study of a nitroxyl spin label with restricted internal mobility sensitive to protein dynamics. J. Magn. Reson. 2017, 274, 24–35. 10.1016/j.jmr.2016.11.001. [DOI] [PubMed] [Google Scholar]
- Bogetti X.; Ghosh S.; Gamble Jarvi A.; Wang J.; Saxena S. Molecular Dynamics Simulations Based on Newly Developed Force Field Parameters for Cu(2+) Spin Labels Provide Insights into Double-Histidine-Based Double Electron-Electron Resonance. J. Phys. Chem. B 2020, 124 (14), 2788–2797. 10.1021/acs.jpcb.0c00739. [DOI] [PubMed] [Google Scholar]
- Selmke B.; Borbat P. P.; Nickolaus C.; Varadarajan R.; Freed J. H.; Trommer W. E. Open and Closed Form of Maltose Binding Protein in Its Native and Molten Globule State As Studied by Electron Paramagnetic Resonance Spectroscopy. Biochemistry 2018, 57 (38), 5507–5512. 10.1021/acs.biochem.8b00322. [DOI] [PMC free article] [PubMed] [Google Scholar]
- Fakhree M. A. A.; Nolten I. S.; Blum C.; Claessens M. Different Conformational Subensembles of the Intrinsically Disordered Protein alpha-Synuclein in Cells. J. Phys. Chem. Lett. 2018, 9 (6), 1249–1253. 10.1021/acs.jpclett.8b00092. [DOI] [PMC free article] [PubMed] [Google Scholar]
- Hol W. G.; van Duijnen P. T.; Berendsen H. J. The alpha-helix dipole and the properties of proteins. Nature 1978, 273 (5662), 443–6. 10.1038/273443a0. [DOI] [PubMed] [Google Scholar]
- Clore G. M.; Iwahara J. Theory, Practice, and Applications of Paramagnetic Relaxation Enhancement for the Characterization of Transient Low-Population States of Biological Macromolecules and Their Complexes. Chem. Rev. 2009, 109 (9), 4108–4139. 10.1021/cr900033p. [DOI] [PMC free article] [PubMed] [Google Scholar]
- Battiste J. L.; Wagner G. Utilization of site-directed spin labeling and high-resolution heteronuclear nuclear magnetic resonance for global fold determination of large proteins with limited nuclear overhauser effect data. Biochemistry 2000, 39 (18), 5355–5365. 10.1021/bi000060h. [DOI] [PubMed] [Google Scholar]
- Mateos B.; Konrat R.; Pierattelli R.; Felli I. C. NMR Characterization of Long-Range Contacts in Intrinsically Disordered Proteins from Paramagnetic Relaxation Enhancement in C-13 Direct-Detection Experiments. ChemBioChem 2019, 20 (3), 335–339. 10.1002/cbic.201800539. [DOI] [PubMed] [Google Scholar]
- Khan S. N.; Charlier C.; Augustyniak R.; Salvi N.; Dejean V.; Bodenhausen G.; Lequin O.; Pelupessy P.; Ferrage F. Distribution of Pico- and Nanosecond Motions in Disordered Proteins from Nuclear Spin Relaxation. Biophys. J. 2015, 109 (5), 988–999. 10.1016/j.bpj.2015.06.069. [DOI] [PMC free article] [PubMed] [Google Scholar]
- Pannier M.; Veit S.; Godt A.; Jeschke G.; Spiess H. W. Dead-time free measurement of dipole-dipole interactions between electron spins. J. Magn. Reson. 2000, 142 (2), 331–40. 10.1006/jmre.1999.1944. [DOI] [PubMed] [Google Scholar]
- Jeschke G.; Koch A.; Jonas U.; Godt A. Direct conversion of EPR dipolar time evolution data to distance distributions. J. Magn. Reson. 2002, 155 (1), 72–82. 10.1006/jmre.2001.2498. [DOI] [PubMed] [Google Scholar]
- Jeschke G. MMM: A toolbox for integrative structure modeling. Protein Sci. 2018, 27 (1), 76–85. 10.1002/pro.3269. [DOI] [PMC free article] [PubMed] [Google Scholar]
- Nikolova E. N.; Stanfield R. L.; Dyson H. J.; Wright P. E. A conformational switch in the zinc finger protein Kaiso mediates differential readout of specific and methylated DNA sequences. Biochemistry 2020, 59, 1909. 10.1021/acs.biochem.0c00253. [DOI] [PMC free article] [PubMed] [Google Scholar]
- Choi U. B.; Kazi R.; Stenzoski N.; Wollmuth L. P.; Uversky V. N.; Bowen M. E. Modulating the intrinsic disorder in the cytoplasmic domain alters the biological activity of the N-methyl-D-aspartate-sensitive glutamate receptor. J. Biol. Chem. 2013, 288 (31), 22506–15. 10.1074/jbc.M113.477810. [DOI] [PMC free article] [PubMed] [Google Scholar]
- Na J. H.; Lee W. K.; Kim Y.; Jeong C.; Song S. S.; Cha S. S.; Han K. H.; Shin Y. K.; Yu Y. G. Biophysical characterization of the structural change of Nopp140, an intrinsically disordered protein, in the interaction with CK2alpha. Biochem. Biophys. Res. Commun. 2016, 477 (2), 181–7. 10.1016/j.bbrc.2016.06.040. [DOI] [PMC free article] [PubMed] [Google Scholar]
- Huang Y.; Liu Z. Kinetic advantage of intrinsically disordered proteins in coupled folding-binding process: a critical assessment of the ″fly-casting″ mechanism. J. Mol. Biol. 2009, 393 (5), 1143–59. 10.1016/j.jmb.2009.09.010. [DOI] [PubMed] [Google Scholar]
- Vancraenenbroeck R.; Hofmann H. Occupancies in the DNA-Binding Pathways of Intrinsically Disordered Helix-Loop-Helix Leucine-Zipper Proteins. J. Phys. Chem. B 2018, 122 (49), 11460–11467. 10.1021/acs.jpcb.8b07351. [DOI] [PubMed] [Google Scholar]
Associated Data
This section collects any data citations, data availability statements, or supplementary materials included in this article.