

Abstract
Transition metal dichalcogenides (TMDCs) are a type of two-dimensional (2D) material that has been widely investigated by both experimentalists and theoreticians because of their unique properties. In the case of cobalt sulfide, density functional theory (DFT) calculations on free-standing S–Co–S sheets suggest there are no stable 2D cobalt sulfide polymorphs, whereas experimental observations clearly show TMDC-like structures on Au(111). In this study, we resolve this disagreement by using a combination of experimental techniques and DFT calculations, considering the substrate explicitly. We find a 2D CoS(0001)-like sheet on Au(111) that delivers excellent agreement between theory and experiment. Uniquely this sheet exhibits a metallic character, contrary to most TMDCs, and exists due to the stabilizing interactions with the Au(111) substrate.
Transition metal dichalcogenides (TMDCs) make up a class of two-dimensional (2D) materials that have been extensively researched over the past two decades because of their unique chemical and mechanical properties for applications in (opto)electronics, biology, high-density storage, efficient energy harvesting, high-resolution imaging, and catalysis.1−7 The scientific community has been on a quest to discover new TMDCs with unique properties to improve existing applications as well as to find completely new ones. Currently, the metals of groups 4–6 and those of group 10 are being thoroughly investigated, because in the bulk they form layered TMDCs held together by van der Waals forces.8 The weak van der Waals forces enable mechanical or chemical exfoliation of 2D sheets from the bulk materials.9
Higher-quality single-layer TMDCs can also be synthesized by epitaxial growth on a suitable substrate, for example, single-layer TMDCs of Mo,10 W,11 Ti,12 Ta,13 Zr,14 Nb,15 and Hf.16 Gold substrates are a preferred choice for the growth of many of these single-layer TMDCs as the high chalcogen affinity of gold can have a stabilizing effect.17 Consequently, to properly investigate the existence and specific properties of potential TMDCs, interactions with the support must be considered.
Theoretical methods, such as density functional theory (DFT), are powerful tools for predicting new TMDC candidates with unique properties. However, the support is often not considered, which causes a major discrepancy between calculations and reality and limits the scope of the predictions. For instance, Ataca et al.18 investigated most of the transition metals for their ability to form TMDCs using free-standing sheets in vacuum. They found that cobalt sulfide does not form stable TMDC sheets. This stands in disagreement with some experimental work by Kibsgaard et al.,19 who showed TMDC-like cobalt sulfide sheets are formed on Au(111) after exposing cobalt nanoparticles to H2S.
In this work, we demonstrate that, when including the Au(111) substrate explicitly in our DFT calculations, excellent agreement between experiment and theory can be achieved for 2D cobalt sulfide. We obtain an atomic model for the cobalt sulfide sheets that nicely fits with our experimental results from scanning tunneling microscopy (STM), low-energy electron diffraction (LEED), and X-ray photoelectron spectroscopy (XPS). Our structure, which is similar to that of bulk-terminated CoS(0001), improves the model suggested by Kibsgaard et al.19 In addition, the methodology used in our research could potentially be applied to other earth-abundant transition metals such as Fe, Ni, and Cu to explore the existence of other novel 2D materials.
Figure 1a shows the STM image of large 2D cobalt sulfide sheets grown on Au(111). The terraces of Au(111) no longer show the typical herringbone reconstruction after exposure to H2S (see the Supporting Information). An identical distorted herringbone reconstruction of Au(111) upon exposure to H2S has been observed in the experiments of ref (19) and also in low-coverage thiol20−22 and hexabromobenzene23 adsorption experiments performed by other research groups. Upon flash annealing to 673 K in ultrahigh vacuum (UHV), the typical herringbone reconstruction is partially restored while the cobalt sulfide sheets remain intact (see the Supporting Information). Furthermore, height line A indicated in Figure 1a and shown in Figure 1b reveals that the cobalt sulfide sheet has an average thickness of 2.43 Å with corrugations of ±0.2 Å in comparison to an experimental Au–Au step height of 2.32 Å.
Figure 1.

2D cobalt sulfide supported on Au(111). (a) Large-scale STM image showing single-layer cobalt sulfide sheets. A modified reconstruction of Au(111) due to H2S exposure with a long-range hexagonal arrangement is seen on the steps of gold. The respective phases are marked. (b) Measured height profile along the blue dashed line marked A in panel a. (c) Atomically resolved STM image of the 2D cobalt sulfide. The rhombus-shaped unit cell is outlined in blue with the two triangular halves demarcated by a green dotted line and enlarged in the inset for the sake of clarity. Image acquired at a sample voltage of −0.7 V. (d) LEED pattern of cobalt sulfide sheets on Au(111) with an incident energy of 95 eV. The diffraction spots of the Au(111) surface are indicated by blue circles. The inset shows a close-up of the Au spot that shows that the spots due to herringbone reconstruction are reduced to spot broadening.
The 2D cobalt sulfide grows as large pristine sheets into and out of the step edges of Au(111). The boundary line of the 2D cobalt sulfide sheets has a curved shape along the Au–cobalt sulfide interface and the 2D cobalt sulfide step edge. Analysis of the contact angles between the line interfaces at the two triple points of the cobalt sulfide sheets reveals a mirror symmetry (see the Supporting Information). The corresponding triple points of different cobalt sulfide sheets, however, have surprisingly the same contact angles irrespective of the size of the sheets. This shows that the interfacial tension at the triple points of the interfaces is responsible for the observed shape of the cobalt sulfide islands. We think that the mirror symmetry arises from different edge terminations at the two triple points; however, further investigations into the interactions at the Au and 2D cobalt sulfide line interface are beyond the scope of this work.
The cobalt sulfide sheets have a hexagonal structure in their basal plane that has been further resolved in Figure 1c. This hexagonal structure consists of a rhombus-shaped unit cell marked in blue with six bright spots along its edges. This unit cell has a side length of 1.97 nm, which corresponds to seven Au–Au interatomic distances. We therefore classify this structure as a 7 × 7 cobalt sulfide structure with respect to Au(111). This 7 × 7 structure is further demonstrated by the LEED pattern of the cobalt sulfide sheets shown in Figure 1d. The bright spots encircled in blue arise from the bare Au(111) surface. The small satellite spots expected for Au(111) are reduced to spot broadening (see the inset of Figure 1d) due to the aforementioned modification of the herringbone reconstruction caused by the exposure to hydrogen sulfide. The smaller spots can be attributed to the Co sulfide sheets and show a hexagonal 7 × 7 symmetry with respect to the Au(111) spots in agreement with the STM results. The rhombus-shaped unit cell consists of two triangular halves, as indicated by a green dotted line in the inset of Figure 1c. One of the triangular halves (top right one) has a relative contrast that is higher than that of the other (bottom left one), causing the contrast to alternate in a hexagonal pattern. Additionally, the vertices of the rhombus-shaped unit cell appear dark in the STM image. Atomic resolution in Figure 1c reveals that the distances between the bright spots in the top layer of the cobalt sulfide of ∼3.3 Å are similar to what was found by Kibsgaard et al.,19 who attributed this pattern to a sheetlike structure similar to that of Co3S4(111).
To determine the stoichiometry of the cobalt sulfide sheets, the sample was flash annealed to 673 K in UHV to desorb the sulfur species on the Au(111) terraces. After this step, XPS spectra were recorded (shown in Figure 2). The relative areas of the Co2p and S2p peaks were corrected by the surface relative sensitivity factors24 to determine the Co:S ratio. Our measurements show a Co:S ratio of 1:2.09 (see the Supporting Information for details), while an approximate Co:S ratio of 1:2.7 has been reported by Kibsgaard et al.19 using Auger electron spectroscopy.
Figure 2.

XPS spectra of 2D cobalt sulfide supported on Au(111) after flash annealing to 673 K to remove sulfur species adsorbed on the Au(111) terraces: (a) Co2p and (b) S2p.
Using the experimental findings in this work and that of Kibsgaard et al.,19 we made use of DFT calculations to arrive at an atomic model. A logical first structure is a sheet based on Co3S4(111), as this is one of the most common bulk-terminated, hexagonal, cobalt sulfide surfaces reported in the literature.25 The experimental unit cell of Co3S4(111) is 6.65 Å × 6.65 Å, and the lateral S–S distance is 3.3 Å, which matches with the distance of 3.3 Å between the bright spots in the STM image in Figure 1c.25 As discussed previously, the unit cell from LEED and STM corresponds to 7 × 7 gold atoms, which is only ∼1.3% smaller than the experimental size of 3 × 3 Co3S4(111) unit cells. To create a model for the cobalt sulfide sheet on gold, the top S–Co–S layers of a 3 × 3 Co3S4(111) supercell are fitted onto a 7 × 7 Au(111) surface. As shown in Figure 3a, this results in a S–Co–S “sandwich” structure with a 3:8 Co:S stoichiometry that is very similar to what was suggested by Kibsgaard et al.19 However, this Co3S4(111)-like structure proved to be unstable during relaxation with DFT. The simulated STM image of the resulting “rearranged” Co3S4(111)-like sheet shown in Figure 3b and the experimental STM image in Figure 1c showed no similarities. For details of the DFT relaxation, see the Supporting Information.
Figure 3.

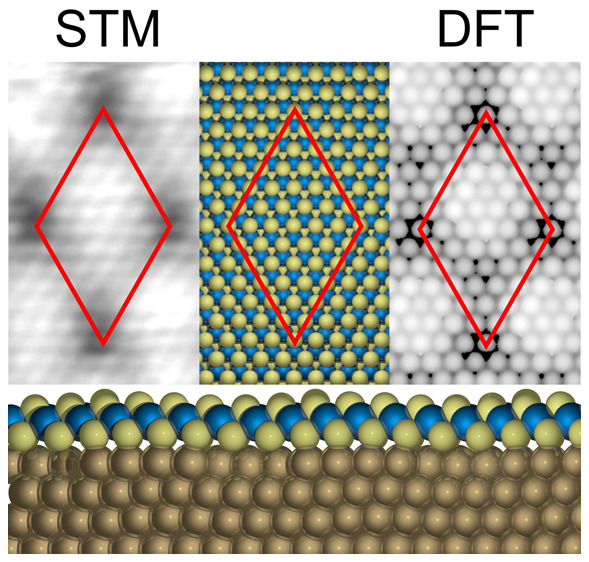
Schematic models of 7 × 7 overlayer structures on Au(111) comprised of (a) Co3S4(111)-like and (c) CoS(0001)-like S–Co–S sheets, each with a top (side) view in the top (lower) part of the image. (b and d) Simulated STM images of the structures resulting from relaxation of structures in panels a and c, respectively. Both images were simulated using the Tersoff–Hamann method with a bias potential of −0.3 V. The contrast has been adjusted for better comparison with Figure 1c. The unit cells in panels a–d are colored red.
CoS(0001) is another bulk-terminated cobalt sulfide surface having a hexagonal unit cell with an experimental unit cell size of 3.38 Å × 3.38 Å.26 This means a 6 × 6 supercell of bulk-terminated CoS(0001) is ∼2.9% larger than the experimentally found unit cell of the cobalt sulfide sheet in Figure 1c. A schematic model of the CoS(0001)-like sheet on Au(111) is shown in Figure 3c. It is very similar to the Co3S4(111)-like sheet; however, there are no holes in the Co layer, resulting in a 1:2 Co:S stoichiometry. This matches the experimentally determined Co:S ratio of 1:2.09 more closely than that of the Co3S4(111)-like sheet. Furthermore, the CoS(0001)-like sheet remains stable during relaxation with DFT and the simulated STM image shown in Figure 3d reproduces most of the key features in the experimental STM image in Figure 1c. We note that the simulated STM images have a resolution significantly higher than what is achievable in an STM experiment because no tunneling integral is included accounting for the finite tip size. Comparison of the bond distances in Table 1 reveals that the bond distances within the CoS(0001)-like sheet remain similar to experimental values found in both bulk Co3S4 and CoS after relaxation with DFT, especially considering the known disparity stemming from the approximations in the DFT functional as discussed in Computational Details.
Table 1. Average Bond Distances from the Structure Shown in Figure 3c after Relaxation Compared to Corresponding Bond Distances in Bulk Cobalt Sulfides and Thiols on Au(111)a.
| structure | dAu–S (Å) | dCo–S(bottom) (Å) | dCo–S(top) (Å) | dCo–Co (Å) |
|---|---|---|---|---|
| CoS(0001)-like sheet/Au(111) T | 2.57 | 2.24 | 2.25 | 3.43 |
| bulk Co3S425,27 E | – | 2.27 | 2.27 | 3.33 |
| bulk CoS26 E | – | 2.33 | 2.33 | 3.37 |
| thiols28,29 T | 2.63 (0.18) | – | – | – |
Theoretically and experimentally obtained values are indicated with T and E, respectively.
Because six lateral S–S distances in the CoS(0001)-like cobalt sulfide sheet are equivalent to seven Au–Au distances along the Au(111) surface, a moiré pattern forms during relaxation with DFT featuring the striking bright and dark triangles seen in the STM images (Figure 1c), as well as the darker spots at the vertices. When the sulfur in the bottom layer sits close to the top of the underlying Au atom, it is slightly elevated (≤0.5 Å) compared to the sulfur atom near the hollow or bridge sites, as is clearly visible in Figure 4. This causes a small corrugation in the entire cobalt sulfide sheet, which is exaggerated in the top sulfur layer. This leads to the brighter and darker areas in the STM images displayed in Figures 1c and 3d.
Figure 4.

Positions of the sulfur atoms in the top and bottom basal planes of the cobalt sulfide sheet from Figure 3c. The gold atoms are colored yellow, while the height of the sulfur atoms relative to the lowest atom in each respective layer is indicated in gray scale. The unit cell is displayed as a red rhombus. The height variation in the bottom layer of sulfur atoms due to the lattice mismatch with gold is exaggerated in the top layer. Comparison with Figure 3d indicates the distinct pattern can be explained by height variations of atoms in the top layer, rather than any electronic effect.
Unlike MoS2 and TiS2, no layered bulk structure has been reported for Co sulfide, whereby the interaction between layers consists of van der Waals forces only. The cobalt sulfide bulk structure that most closely resembles those of MoS2 and TiS2 is the previously discussed CoS bulk structure. However, single-layer cobalt sulfide sheets cannot be obtained by exfoliation of a CoS crystal, because the layers are held together by covalent bonds.17 Nevertheless, we demonstrate that 2D cobalt sulfide sheets can be synthesized on Au(111). Figure 5 shows that the interaction energy of the cobalt sulfide sheet with the Au(111) surface is −0.40 eV per sulfur atom in the bottom layer according to our DFT calculations. This is very similar to the strong Au–S bond of thiols chemisorbed on Au(111),28,29 as also further corroborated by the similarities in the bond lengths (see Table 1). The substantial interaction between gold and the cobalt sulfide sheet can also be discerned from the band structure and the (projected) densities of states available in the Supporting Information, which also reveals the metallic nature of the CoS(0001)-like sheet. The formation of cobalt sulfide sheets on the Au(111) surface may be facilitated by the strong interaction between sulfur and gold, despite the presence of Co. This interaction appears to be covalent in nature, because there is almost no net charge transfer between the gold and the cobalst sulfide sheet (see the Supporting Information for more details).
Figure 5.

Decomposition of the interaction energy for the cobalt sulfide sheet and Au(111) as obtained from DFT calculations. Energies are per S–Co–S unit, with the separated Au(111) slab and free-standing S–Co–S film in equilibrium geometry shown in the leftmost inset defining zero energy. From left to right, the separated Au(111) slab and free-standing S–Co–S film compressed by 1% to coincide with 7/6 Au(111) surface lattice constants, same as before but additionally including the interfacial corrugation of the structure where the S–Co–S film and Au(111) are in contact, which is finally the case in the rightmost relaxed 7 × 7 S–Co–S overlayer structure on Au(111) (i.e., same structure as schematically depicted in Figure 3c).
In summary, we show that 2D cobalt sulfide forms on Au(111) with a CoS(0001)-like S–Co–S structure. The formation of 2D cobalt sulfide on Au(111) is facilitated by strong Au–S interactions. The nature of the electronic interaction of cobalt sulfide with the Au(111) substrate is similar to that of MoS2; however, unlike MoS2, cobalt sulfide does not have a band gap. Because most TMDCs are semiconductors, cobalt sulfide stands out in this regard, which opens up possibilities for novel applications. In the case of 2D cobalt sulfide on Au(111), theory and experiment agree only when the substrate is considered explicitly in DFT calculations. This means that, when looking for potential new 2D materials, reliance solely on gas-phase calculations is not sufficient and a more complete approach is required.
Experimental Details
All experiments were carried out in the ReactorSTM(30) in UHV mode. A Au(111) single crystal was prepared by repeated cycles of sputter cleaning with Ar+ ions (1.5 keV) and annealing to 873 K. Two-dimensional cobalt sulfide was grown by evaporating cobalt in a H2S atmosphere of 2 × 10⁻⁶ mbar onto the clean Au(111) single crystal maintained at 410 K. Thereafter, the sample was annealed to 650 K for 20 min and cooled within 10 min to 473 K in the H2S atmosphere. Lastly, the sample was cooled to 300 K within 120 min in UHV.
All STM imaging was performed with a tunneling current of ∼100 pA and a sample voltage of −1 V with the sample held at room temperature in UHV. To enhance the visibility of the details, we display the STM images with a line-by-line background subtraction. Note, however, that the height profiles are obtained from STM images with planar background filtering on the entire image ensuring a correctly connected 2D surface. All postprocessing is carried out using software developed in house (CAMERA version 4.3.5) as well as WSXM.31 LEED experiments were performed using a commercial Omicron SPECTALEED. The diffraction images were obtained with a Canon EOS50D camera using manual focusing and a 30 s exposure time. The LEED images shown here were contrast-enhanced further in RAW format without any other processing. The XPS spectra were measured using the SPECS-Phoibos system with a model HSA 3500 hemispherical analyzer. A monochromator was used to select Al Kα radiation with a 1486.7 eV excitation energy, and an incidence angle of 54.6° was used. The spectra of S2p and Co2p were recorded with a pass energy of 20 eV and integrated 25 times to improve the signal-to-noise ratio. After acquisition, a Shirley background was subtracted using the CASA XPS software. To calculate the stoichiometry of 2D cobalt sulfide, the peak areas were corrected for their relative sensitivity factors.24
Computational Details
All DFT calculations were performed with the Vienna Ab Initio Simulation Package (VASP, version 5.2)32−35 in combination with the Atomic Simulation Environment (ASE, version 3.19)36 for generating input and analyzing output files.
After having verified that spin polarization is not relevant for CoS (bulk structure) and CoS2 (bulk structure) consistent with earlier results,37 we used the non-spin-polarized formulation of the PBE exchange correlation functional38 for all of the surface calculations.
The
Kohn–Sham orbitals were expanded into a plane-wave basis
set with a cutoff energy of 300 eV, and ion–electron interactions
were described by the projector-augmented wave method (PAW data set
52 from 201239,40). Then, 12 × 12 × 12,
7 × 7 × 7, and 9 × 9 × 9 Monkhorst–Pack
k-point grids41 were used for the aforementioned
CoS, CoS2, and fcc-Au bulk structures, respectively, resulting
in equilibrium lattice constants aCoSDFT = 3.35 Å (with  ), aCoS2 = 5.49 Å,
and aAuDFT = 4.16 Å. This is in good agreement with the corresponding
experimental values aCoS = 3.38 Å (with
), aCoS2 = 5.49 Å,
and aAuDFT = 4.16 Å. This is in good agreement with the corresponding
experimental values aCoS = 3.38 Å (with  ),26aCoS2exp = 5.54 Å,42 and aAu = 4.07 Å,43 which is expected for the PBE functional.44 Despite this good agreement, differences between experimental and
theoretical lengths remain; therefore, in this work, all distances
discussed concern experimental values unless explicitly stated otherwise.
Surface structures were based on a relaxed four-layer slab model for
unreconstructed Au(111) with surface lattice constant
),26aCoS2exp = 5.54 Å,42 and aAu = 4.07 Å,43 which is expected for the PBE functional.44 Despite this good agreement, differences between experimental and
theoretical lengths remain; therefore, in this work, all distances
discussed concern experimental values unless explicitly stated otherwise.
Surface structures were based on a relaxed four-layer slab model for
unreconstructed Au(111) with surface lattice constant  . For the
ensuing relaxations of the large-scale
cobalt sulfide overlayer structures, the bottom three gold layers
were frozen. For all of these calculations, a maximum force threshold
of 10–3 eV/Å was used, together with a vacuum
distance of ≥8 Å and Monkhorst–Pack41 k-point grids corresponding to at least 13 ×
13 × 1 k-points in the primitive Au(111) unit cell. STM images
were simulated according to the Tersoff–Hamann approach45 as implemented in the HIVE-STM software package46 by plotting a surface of constant density of
states within 0.05 eV of the reported bias voltage.
. For the
ensuing relaxations of the large-scale
cobalt sulfide overlayer structures, the bottom three gold layers
were frozen. For all of these calculations, a maximum force threshold
of 10–3 eV/Å was used, together with a vacuum
distance of ≥8 Å and Monkhorst–Pack41 k-point grids corresponding to at least 13 ×
13 × 1 k-points in the primitive Au(111) unit cell. STM images
were simulated according to the Tersoff–Hamann approach45 as implemented in the HIVE-STM software package46 by plotting a surface of constant density of
states within 0.05 eV of the reported bias voltage.
Acknowledgments
The authors thank the Dutch Organization for Scientific Research (NWO) for providing computing time on the Cartesius facility (Grant 17216) and the Leiden Institute of Chemistry (LIC) for financial support.
Supporting Information Available
The Supporting Information is available free of charge at https://pubs.acs.org/doi/10.1021/acs.jpclett.0c02268.
Au(111) exposed to H2S, 2D cobalt sulfide sheets of various sizes supported on Au(111), XPS spectra, TMDC-like structure in sulfur-terminated Co3S4(111), TMDC-like structure in CoS(0001), density of states and band structure of CoS(0001)/Au(111) from DFT, charge analysis, and van der Waals corrections (PDF)
Movie S1 (MP4)
Movie S2 (MP4)
Author Contributions
§ M.K.P. and D.B. contributed equally to this work.
The authors declare no competing financial interest.
Supplementary Material
References
- Jariwala D.; Sangwan V. K.; Lauhon L. J.; Marks T. J.; Hersam M. C. Emerging Device Applications for Semiconducting Two-dimensional Transition Metal Dichalcogenides. ACS Nano 2014, 8, 1102–1120. 10.1021/nn500064s. [DOI] [PubMed] [Google Scholar]
- Chhowalla M.; Shin H. S.; Eda G.; Li L.-J.; Loh K. P.; Zhang H. The Chemistry of Two-dimensional Layered Transition Metal Dichalcogenide Nanosheets. Nat. Chem. 2013, 5, 263–275. 10.1038/nchem.1589. [DOI] [PubMed] [Google Scholar]
- Geim A. K.; Grigorieva I. V. Van Der Waals Heterostructures. Nature 2013, 499, 419–425. 10.1038/nature12385. [DOI] [PubMed] [Google Scholar]
- Lightcap I. V.; Kosel T. H.; Kamat P. V. Anchoring Semiconductor and Metal Nanoparticles on a Two-dimensional Catalyst Material Storing and Shuttling Electrons with Reduced Graphene Oxide. Nano Lett. 2010, 10, 577–583. 10.1021/nl9035109. [DOI] [PubMed] [Google Scholar]
- Cao X. H.; Yin Z. Y.; Zhang H. Three-dimensional Graphene Materials: Preparation, Structures and Application in Supercapacitors. Energy Environ. Sci. 2014, 7, 1850–1865. 10.1039/C4EE00050A. [DOI] [Google Scholar]
- Yin Z. Y.; Zhu J. X.; He Q. Y.; Cao X. H.; Tan C. L.; Chen H. Y.; Yan Q. Y.; Zhang H. Graphene-based Materials for Solar Cell Applications. Adv. Energy Mater. 2014, 4, 1300574. 10.1002/aenm.201300574. [DOI] [Google Scholar]
- Gong Y. J.; Lin J. H.; Wang X. L.; Shi G.; Lei S. D.; Lin Z.; Zou X. L.; Ye G. L.; Vajtai R.; Yakobson B. I.; et al. Vertical and In-plane Heterostructures from WS2/MoS2 Monolayers. Nat. Mater. 2014, 13, 1135–1142. 10.1038/nmat4091. [DOI] [PubMed] [Google Scholar]
- Manzeli S.; Ovchinnikov D.; Pasquier D.; Yazyev O. V.; Kis A. 2D Transition Metal Dichalcogenides. Nat. Rev. Mater. 2017, 2, 17033. 10.1038/natrevmats.2017.33. [DOI] [Google Scholar]
- Geim A. K. Random Walk to Graphene (Nobel Lecture). Angew. Chem., Int. Ed. 2011, 50, 6966–6985. 10.1002/anie.201101174. [DOI] [PubMed] [Google Scholar]
- Gronborg S. S.; Ulstrup S.; Bianchi M.; Dendzik M.; Sanders C. E.; Lauritsen J. V.; Hofmann P.; Miwa J. A. Synthesis of Epitaxial Single-layer MoS2 on Au(111). Langmuir 2015, 31, 9700–9706. 10.1021/acs.langmuir.5b02533. [DOI] [PubMed] [Google Scholar]
- Dendzik M.; Michiardi M.; Sanders C.; Bianchi M.; Miwa J. A.; Gronborg S. S.; Lauritsen J. V.; Bruix A.; Hammer B.; Hofmann P. Growth and Electronic Structure of Epitaxial Single-layer WS2 on Au(111). Phys. Rev. B: Condens. Matter Mater. Phys. 2015, 92, 245442. 10.1103/PhysRevB.92.245442. [DOI] [Google Scholar]
- Biener M. M.; Biener J.; Friend C. M. Novel Synthesis of Two-dimensional TiS2 Nanocrystallites on Au(111). J. Chem. Phys. 2005, 122, 034706. 10.1063/1.1826054. [DOI] [PubMed] [Google Scholar]
- Kolekar S.; Bonilla M.; Ma Y. J.; Diaz H. C.; Batzill M. Layer- and Substrate-dependent Charge Density Wave Criticality in 1T-TiSe2. 2D Mater. 2018, 5, 015006. 10.1088/2053-1583/aa8e6f. [DOI] [Google Scholar]
- Tsipas P.; Tsoutsou D.; Fragkos S.; Sant R.; Alvarez C.; Okuno H.; Renaud G.; Alcotte R.; Baron T.; Dimoulas A. Massless Dirac Fermions in ZrTe2 Semimetal Grown on InAs(111) by Van Der Waals Epitaxy. ACS Nano 2018, 12, 1696–1703. 10.1021/acsnano.7b08350. [DOI] [PubMed] [Google Scholar]
- Stan R. M.; Mahatha S. K.; Bianchi M.; Sanders C. E.; Curcio D.; Hofmann P.; Miwa J. A. Epitaxial Single-layer NbS2 on Au(111): Synthesis, Structure, and Electronic Properties. Phys. Rev. Mater. 2019, 3, 044003. 10.1103/PhysRevMaterials.3.044003. [DOI] [Google Scholar]
- Tsoutsou D.; Aretouli K. E.; Tsipas P.; Marquez-Velasco J.; Xenogiannopoulou E.; Kelaidis N.; Aminalragia Giamini S.; Dimoulas A. Epitaxial 2D MoSe2 (HfSe2) Semiconductor/2D TaSe2 Metal Van Der Waals Heterostructures. ACS Appl. Mater. Interfaces 2016, 8, 1836–1841. 10.1021/acsami.5b09743. [DOI] [PubMed] [Google Scholar]
- Sørensen S. G.; Füchtbauer H. G.; Tuxen A. K.; Walton A. S.; Lauritsen J. V. Structure and Electronic Properties of In Situ Synthesized Single-layer MoS2 on a Gold Surface. ACS Nano 2014, 8, 6788–6796. 10.1021/nn502812n. [DOI] [PubMed] [Google Scholar]
- Ataca C.; Şahin H.; Ciraci S. Stable, Single-layer MX2 Transition-metal Oxides and Dichalcogenides in a Honeycomb-like Structure. J. Phys. Chem. C 2012, 116, 8983–8999. 10.1021/jp212558p. [DOI] [Google Scholar]
- Kibsgaard J.; Morgenstern K.; Lægsgaard E.; Lauritsen J. V.; Besenbacher F. Restructuring of Cobalt Nanoparticles Induced by Formation and Diffusion of Monodisperse Metal-sulfur Complexes. Phys. Rev. Lett. 2008, 100, 116104. 10.1103/PhysRevLett.100.116104. [DOI] [PubMed] [Google Scholar]
- Fitts W. P.; White J. M.; Poirier G. E. Low-coverage Decanethiolate Structure on Au(111): Substrate Effects. Langmuir 2002, 18, 1561–1566. 10.1021/la0107650. [DOI] [Google Scholar]
- Liu Y.-F.; Yang Y.-C.; Lee Y.-L. Assembly Behavior and Monolayer Characteristics of OH-terminated Alkanethiol on Au(111): In Situ Scanning Tunneling Microscopy and Electrochemical Studies. Nanotechnology 2008, 19, 065609. 10.1088/0957-4484/19/6/065609. [DOI] [PubMed] [Google Scholar]
- Darling S. B.; Rosenbaum A. W.; Wang Y.; Sibener S. J. Coexistence of the (23 × √3) Au(111) Reconstruction and a Striped Phase Self-assembled Monolayer. Langmuir 2002, 18, 7462–7468. 10.1021/la020334x. [DOI] [Google Scholar]
- Huang H.; Tan Z.; He Y.; Liu J.; Sun J.; Zhao K.; Zhou Z.; Tian G.; Wong S. L.; Wee A. T. S. Competition Between Hexagonal and Tetragonal Hexabromobenzene Packing on Au(111). ACS Nano 2016, 10, 3198–3205. 10.1021/acsnano.5b04970. [DOI] [PubMed] [Google Scholar]
- Wagner C. D.; Davis L. E.; Zeller M. V.; Taylor J. A.; Raymond R. H.; Gale L. H. Empirical Atomic Sensitivity Factors for Quantitative Analysis by Electron Spectroscopy for Chemical Analysis. Surf. Interface Anal. 1981, 3, 211–225. 10.1002/sia.740030506. [DOI] [Google Scholar]
- Lundqvist D.; Westgren A. Rontgenuntersuchung Des Systems Co-S. Z. Anorg. Allg. Chem. 1938, 239, 85–88. 10.1002/zaac.19382390110. [DOI] [Google Scholar]
- Alsén N. Röntgenographische Untersuchung Der Kristallstrukturen Von Magnetkies, Breithauptit, Pentlandit, Millerit Und Verwandten Verbindungen. Geol. Foeren. Stockholm Foerh. 1925, 47, 19–72. 10.1080/11035892509443177. [DOI] [Google Scholar]
- Knop O.; Reid K. I. G.; Sutarno; Nakagawa Y. Chalkogenides of the Transition Elements. VI. X-ray, Neutron, and Magnetic Investigation of the Spinels Co3O4, NiCo2O4, Co3S4, and NiCo2S4. Can. J. Chem. 1968, 46, 3463–3476. 10.1139/v68-576. [DOI] [Google Scholar]
- Franke A.; Pehlke E. Adsorption and Diffusion of SCH3 Radicals and Au (SCH3)2 Complexes on the Unreconstructed Au(111) Surface in the Submonolayer Coverage Regime. Phys. Rev. B: Condens. Matter Mater. Phys. 2009, 79, 44–46. 10.1103/PhysRevB.79.235441. [DOI] [Google Scholar]
- Franke A.; Pehlke E. First-principles Study of 1,4-butanedithiol Molecules and Radicals Adsorbed on Unreconstructed Au(111) and Au(100). Phys. Rev. B: Condens. Matter Mater. Phys. 2010, 81, 075409. 10.1103/PhysRevB.81.075409. [DOI] [Google Scholar]
- Herbschleb C. T.; van der Tuijn P. C.; Roobol S. B.; Navarro V.; Bakker J. W.; Liu Q.; Stoltz D.; Cañas-Ventura M. E.; Verdoes G.; van Spronsen M. A.; et al. The ReactorSTM: Atomically Resolved Scanning Tunneling Microscopy Under High-pressure, High-temperature Catalytic Reaction Conditions. Rev. Sci. Instrum. 2014, 85, 083703. 10.1063/1.4891811. [DOI] [PubMed] [Google Scholar]
- Horcas I.; Fernández R.; Gómez-Rodríguez J. M.; Colchero J.; Gómez-Herrero J.; Baro A. M. WSXM: A Software for Scanning Probe Microscopy and a Tool for Nanotechnology. Rev. Sci. Instrum. 2007, 78, 013705. 10.1063/1.2432410. [DOI] [PubMed] [Google Scholar]
- Kresse G.; Hafner J. Ab Initio Molecular Dynamics for Liquid Metals. Phys. Rev. B: Condens. Matter Mater. Phys. 1993, 47, 558–561. 10.1103/PhysRevB.47.558. [DOI] [PubMed] [Google Scholar]
- Kresse G.; Hafner J. Ab-initio Molecular-dynamics Simulation of the Liquid-metal Amorphous-semiconductor Transition in Germanium. Phys. Rev. B: Condens. Matter Mater. Phys. 1994, 49, 14251–14269. 10.1103/PhysRevB.49.14251. [DOI] [PubMed] [Google Scholar]
- Kresse G.; Furthmüller J. Efficiency of Ab-initio Total Energy Calculations for Metals and Semiconductors Using a Plane-wave Basis Set. Comput. Mater. Sci. 1996, 6, 15–50. 10.1016/0927-0256(96)00008-0. [DOI] [PubMed] [Google Scholar]
- Kresse G.; Furthmüller J. Efficient Iterative Schemes for Ab Initio Total-energy Calculations Using a Plane-wave Basis Set. Phys. Rev. B: Condens. Matter Mater. Phys. 1996, 54, 11169–11186. 10.1103/PhysRevB.54.11169. [DOI] [PubMed] [Google Scholar]
- Hjorth Larsen A.; Jørgen Mortensen J.; Blomqvist J.; Castelli I. E.; Christensen R.; Dułak M.; Friis J.; Groves M. N.; Hammer B.; Hargus C.; et al. The Atomic Simulation Environment—a Python Library for Working with Atoms. J. Phys.: Condens. Matter 2017, 29, 273002. 10.1088/1361-648X/aa680e. [DOI] [PubMed] [Google Scholar]
- Feng Z. Y.; Yang Y.; Zhang J. M. The Structural, Electronic and Magnetic Properties of CoS2 Under Pressure. Solid State Commun. 2018, 273, 60–65. 10.1016/j.ssc.2018.02.010. [DOI] [Google Scholar]
- Perdew J. P.; Burke K.; Ernzerhof M. Generalized Gradient Approximation Made Simple. Phys. Rev. Lett. 1996, 77, 3865–3868. 10.1103/PhysRevLett.77.3865. [DOI] [PubMed] [Google Scholar]
- Blöchl P. E. Projector Augmented-wave Method. Phys. Rev. B: Condens. Matter Mater. Phys. 1994, 50, 17953–17979. 10.1103/PhysRevB.50.17953. [DOI] [PubMed] [Google Scholar]
- Kresse G.; Joubert D. From Ultrasoft Pseudopotentials to the Projector Augmented-wave Method. Phys. Rev. B: Condens. Matter Mater. Phys. 1999, 59, 1758–1775. 10.1103/PhysRevB.59.1758. [DOI] [Google Scholar]
- Monkhorst H. J.; Pack J. D. Special Points for Brillouin-zone Integrations. Phys. Rev. B 1976, 13, 5188–5192. 10.1103/PhysRevB.13.5188. [DOI] [Google Scholar]
- Nowack E.; Schwarzenbach D.; Hahn T. Charge Densities in CoS2 and NiS2 (pyrite structure). Acta Crystallogr., Sect. B: Struct. Sci. 1991, 47, 650–659. 10.1107/S0108768191004871. [DOI] [Google Scholar]
- Davey W. P. Precision Measurements of the Lattice Constants of Twelve Common Metals. Phys. Rev. 1925, 25, 753–761. 10.1103/PhysRev.25.753. [DOI] [Google Scholar]
- Schimka L.; Gaudoin R.; Klimes; Marsman M.; Kresse G. Lattice Constants and Cohesive Energies of Alkali, Alkaline-earth, and Transition Metals: Random Phase Approximation and Density Functional Theory Results. Phys. Rev. B: Condens. Matter Mater. Phys. 2013, 87, 214102. 10.1103/PhysRevB.87.214102. [DOI] [Google Scholar]
- Tersoff J.; Hamann D. R. Theory of the Scanning Tunneling Microscope. Phys. Rev. B: Condens. Matter Mater. Phys. 1985, 31, 805–813. 10.1103/PhysRevB.31.805. [DOI] [PubMed] [Google Scholar]
- Vanpoucke D. E. P.; Brocks G. Formation of Pt-induced Ge Atomic Nanowires on Pt/Ge(001): A Density Functional Theory Study. Phys. Rev. B: Condens. Matter Mater. Phys. 2008, 77, 241308. 10.1103/PhysRevB.77.241308. [DOI] [Google Scholar]
Associated Data
This section collects any data citations, data availability statements, or supplementary materials included in this article.