

Abstract
Background:
Venous thromboembolism (VTE) is an important complication in patients with malignant tumors. Its exact diagnosis and treatment are still lacking. We used a high-sensitive chemiluminescence method to detect thrombin–antithrombin III complex (TAT), plasmin-α2-plasmininhibitor complex (PIC), thrombomodulin (TM), and tissue plasminogen activator–inhibitor complex(t-PAIC) in combination with D-dimer and fibrin degradation product (FDP) to analyze their diagnostic and prognostic value in patients with malignant tumors.
Methods:
In total, 870 patients with confirmed malignant tumors were included, 82 of whom had diagnosed VTE; 200 healthy individuals were classified as the control group. The TAT, PIC, TM, and t-PAIC were detected using Sysmex HISCL5000 automated analyzers, whereas FDP and D-dimer were detected using Sysmex CS5100 coagulation analyzer. Receiver operating characteristic (ROC) curves were used to evaluate the diagnostic efficiency. Survival probabilities were determined using Kaplan–Meier analysis, and multivariate analyses were performed using a Cox regression model.
Results:
Compared with healthy controls, patients with malignant tumors showed significantly elevated TAT, PIC, TM, t-PAIC, D-dimer, and FDP. Similarly, compared with patients in the non-thrombosis group, those in the thrombosis group showed significantly elevated levels of the above mentioned markers. Logistic regression analysis showed that TAT, PIC, TM, t-PAIC, D-Dimer, and FDP were all associated with VTE. ROC analysis showed that “TAT+PIC+TM+t-PAIC+D-dimer+FDP”showed the highest sensitivity and specificity. Patients with elevated TAT, PIC, TM, and t-PAIC had a significantly shorter survival. Multivariate Cox survival analysis showed that TM and t-PAIC were significantly associated with poor prognosis. In addition, the incidence of VTE was significantly lower in patients with malignant tumors who were treated with low-molecular-weight heparin (LMWH), and their survival period was significantly longer than that of patients with malignant tumors who were not treated with LMWH.
Conclusion:
TAT, PIC, TM, and t-PAIC combined with D-dimer and FDP were better than the application of a single marker in the diagnosis of VTE in patients with malignant tumors. TAT and PIC can be used as sensitive markers in the diagnosis of VTE but not as prognostic markers. TM and t-PAIC might be independent prognostic indicators in patients with malignant tumors, regardless of the state of thrombus.
Keywords: venous thromboembolism, malignant tumor, thrombin–antithrombin III complex, plasmin-α2-plasmininhibitor complex, thrombomodulin, tissue plasminogen activator–inhibitor complex
Introduction
Venous thromboembolism (VTE) is one of the important complications in patients with malignant tumors, and one of the main causes of death in patients with malignancies.1,2 VTE includes deep vein thrombosis (DVT) and pulmonary embolism (PE).3,4 A large-scale epidemiological study reported that about 20% of new cases of VTE are related to potential tumors.5 Compared with patients without cancer, those with cancer have an increased risk of VTE,6,7 and those with metastasis have a 4–13-fold higher risk of VTE.8,9 In addition, hospitalized patients with tumors who undergo treatment are more likely to have VTE.10–12 Although the formation of VTE has seriously affected the survival rate and mortality rate of patients with cancer,13 VTE is still underdiagnosed and undertreated in these patients.14,15 Currently, the gold standard of VTE diagnosis is still imageology examination; D-dimer and fibrin degradation product (FDP) are passively detected after thrombosis and are not useful for early diagnosis of VTE.
The thrombin–antithrombin III complex (TAT) is recognized as a marker of activation of the coagulation system, plasmin-α2-plasmininhibitor complex (PIC) is an indicator of activation of the fibrinolysis system, thrombomodulin (TM) can monitor the function of endothelial cells, and tissue plasminogen activator–inhibitor complex (t-PAIC) is a fibrinolytic marker. These are important markers in the process of venous thrombosis, which can be significantly elevated before thrombus.
Previous studies have analyzed the diagnostic value of a single marker or the diagnostic and prognostic value of 4 markers in patients with DIC. In this study, we first combined 6 markers, namely TAT, PIC, TM, t-PAIC, D-dimer, and FDP, and first to evaluate the diagnostic and prognostic value of VTE in patients with malignant tumors, and to preliminarily evaluate the potential use of TAT and PIC as indications for the use of low-molecular-weight heparin(LMWH).
Patients and Methods
Study Subject
This was a multicenter, prospective observational study conducted in 3 research institutes in China. In total, 870 patients (368 male and 502 female) with confirmed malignant tumors were included in the study as the malignant tumor group from January 2017 to December 2019. Patients who had not received coagulant drugs within 1 week of the study and those whose malignant tumors were confirmed by CT, MRI, histopathology, or cytology were included. Among the included patients, 403 had lung cancer, 235 had pancreatic cancer, 125 had gastric cancer, and 107 had ovarian cancer. Patients whose deep vein thrombosis(DVT) was confirmed by color Doppler ultrasound or angiography, or those who were diagnosed with pulmonary embolism(PE) by using spiral CT pulmonary arteriography and MRI pulmonary arteriography(n = 82) were regarded as the thrombosis group. In total, 200 healthy individuals (119 female and 81 male, mean age 57.50 ± 9.14 years) who visited the hospital for physical examination during the same period were selected as the healthy control group. These individuals did not have hyperlipidemia, diabetes, or coagulation-related diseases. The study protocol was approved by the Human Ethics Review Committee of each hospital(File no: HLJ-NK-2017-0016) and supported by Heilongjiang Provincial Health and Family Planning Commission (Grant no. 2017-566). Written informed consent was obtained from the patients or their relatives before enrolment into the study. All patients were followed up through hospital re-examination, WeChat, and telephone until December 2019. The follow-up was conducted once every 3 months to record the living status and the cause of death of the patients.
Methods
In total, 2.7 mL of fasting venous blood was collected with 0.3 mL of 3.2% sodium citrate and mixed 10 times. Whole blood was centrifuged at 1000×g for 10 min and immediately tested on the machine. TAT, PIC, TM, and t-PAIC were measured by high-sensitivity chemiluminescence enzyme immunoassay method performed on Sysmex-HISCL5000 automated analyzer (HISCL-5000i, Sysmex, Japan). FDP and D-dimer were detected using Sysmex CS5100 coagulation analyzer (Sysmex, Japan). All reagents and calibrators were matching reagents obtained from the original factory, and they were used according to the manufacturer’s instructions.
Statistical Analysis
Non-normal distribution data were represented by median(Q 1,Q 3), and the differences between the groups were compared using the Mann–Whitney U test. χ2 test was used to compare the enumeration data. The relationships between TAT, PIC, TM, t-PAIC, D-dimer, FDP, and VTE were analyzed using binary logistic regression. Receiver operating characteristic (ROC) curves were used to evaluate the diagnostic efficiency, and the maximum value of the Youden index served as the cut-off value. Survival was estimated using the Kaplan–Meier method, and any differences in survival were evaluated using the log-rank test. Multivariable analyses with the Cox proportional hazards model were used to estimate the simultaneous effects of prognostic factors on survival. P < 0.05 was considered statistically significant. All statistical analyses were performed using the SPSS 20.0 software.
Results
Comparison of Basic Information of Patients With Malignant Tumors
Among the 870 patients, 82 were diagnosed with VTE as thrombosis group. There were no significant difference in the levels of triacylglycerol, total cholesterol, low-density lipoprotein cholesterol, high-density lipoprotein cholesterol, and blood glucose between the thrombosis and non-thrombosis groups(Table 1).
Table 1.
Comparison of Basic Information of Patients With Malignant Tumors in the Thrombosis and Non-Thrombosis Groups.
| Group | n | Male/Female(n) | Age (year, ± s) |
Tumor types (LC/PC/GC/OC, n) | TG (mmol/L, ± s) | TC (mmol/L, ± s) | LDL-C (mmol/L, ± s) | HDL-C (mmol/L, ± s) | Glu (mmol/L, ± s) |
|---|---|---|---|---|---|---|---|---|---|
| Malignant tumor group | 870 | 368/502 | 61.32 ± 10.76 | 403/235/125/107 | 1.22 ± 0.29 | 4.68 ± 0.53 | 2.78 ± 0.32 | 1.12 ± 0.09 | 5.13 ± 0.22 |
| Thrombosis group | 82 | 35/47 | 62.07 ± 11.54 | 44/23/9/6 | 1.29 ± 0.27 | 4.51 ± 0.60 | 2.52 ± 0.47 | 0.92 ± 0.07 | 5.19 ± 0.25 |
| Non-thrombosis group | 788 | 333/455 | 60.61 ± 10.09 | 359/212/116/101 | 1.24 ± 0.32 | 4.62 ± 0.55 | 2.71 ± 0.42 | 1.03 ± 0.10 | 5.08 ± 0.23 |
LC:lung cancer; PC: pancreatic cancer; GC: gastric cancer; OC: ovarian cancer; TG: triacylglycerol; TC: total cholesterol; LDL-C: low-density lipoprotein cholesterol; HDL-C: high-density lipoprotein cholesterol; Glu: blood glucose.
Comparison Between Control Group and Malignant Tumor Group
The mean plasma levels of TAT, PIC, TM, t-PAIC, D-dimer, and FDP in the 200 healthy individuals were 6.20(3.70–8.50) µg/L, 0.11(0.10–0.14) mg/L, 8.20(6.40–9.70) kU/L, 6.80(6.10–7.60) µg/L, 1.43(1.20–1.65) µg/L, and 1.91(1.42–2.31) mg/L, respectively. The levels of TAT, PIC, TM, t-PAIC, D-dimer, and FDP in the malignant tumor group were significantly higher than the corresponding levels in the healthy control group (P < 0.001; Table 2).
Table 2.
Comparison Between Control Group and Malignant Tumor Group (M[Q 1,Q 3]).
| Group | N | TAT(μg/L) | PIC(mg/L) | TM(kU/L) | t-PAIC(μg/L) | D-dimer(μg/L) | FDP(mg/L) |
|---|---|---|---|---|---|---|---|
| Control group | 200 | 6.20(3.70–8.50) | 0.11(0.10–0.14) | 8.20(6.40–9.70) | 6.80(6.10–7.60) | 1.43(1.20–1.65) | 1.91(1.42–2.31) |
| Malignant tumor group | 870 | 11.64(6.10–22.76) | 0.86(0.43–1.78) | 10.70(8.00–16.23) | 8.20(5.50–13.41) | 2.04(0.79–5.44) | 5.56(2.31–14.26) |
| Zvalue | −11.606 | −25.199 | −8.179 | −7.018 | −5.237 | −17.419 | |
| P value | <0.001* | <0.001* | <0.001* | <0.001* | <0.001* | <0.001* |
TAT, thrombin–antithrombin III complex; PIC, plasmin-α2-plasmininhibitor complex; TM, thrombomodulin; t-PAIC, tissue plasminogen activator–inhibitor complex; FDP, fibrin degradation product.
*P < 0.05 considered statistically significant.
Comparison Between Non-Thrombosis and Thrombosis Group Among Patients With Malignant Tumors
The levels of TAT, PIC, TM, t-PAIC, D-dimer, and FDP in the thrombosis group were significantly higher than the corresponding levels in the non-thrombosis group (P < 0.001, P < 0.001, P = 0.001, P = 0.013, P = 0.001, and P = 0.009, respectively; Table 3).
Table 3.
Comparison Between Non-Thrombosis Group and Thrombosis Group Among Patients With Malignant Tumors (M [Q 1,Q 3]).
| Group | n | TAT(μg/L) | PIC(mg/L) | TM(kU/L) | t-PAIC(μg/L) | D-dimer(μg/L) | FDP(mg/L) |
|---|---|---|---|---|---|---|---|
| Non-thrombosis group | 788 | 9.83(5.70–16.5) | 0.792(0.41–1.47) | 10(7.8–14.5) | 7.6(5.2–12.7) | 1.82(0.6–5.24) | 4.94(2.31–10.68) |
| Thrombosis group | 82 | 46.81(20.4–120) | 1.944(0.78–8.43) | 18(10.1–23.9) | 10.6(7.5–16.2) | 3.77(1.52–7.72) | 7.2(3.06–19.02) |
| Z value | −13.486 | −8.149 | −7.952 | −4.569 | −5.094 | −4.982 | |
| P-value | <0.001* | <0.001* | 0.001* | 0.013* | 0.001* | 0.009* |
TAT, thrombin–antithrombin III complex; PIC, plasmin-α2-plasmininhibitor complex; TM, thrombomodulin; t-PAIC, tissue plasminogen activator–inhibitor complex; FDP, fibrin degradation product.
*P < 0.05 considered statistically significant.
Binary logistic regression analysis showed that TAT, PIC, TM, t-PAIC, D-dimer, and FDP were closely associated with VTE in patients with malignant tumors (P < 0.001, P < 0.001, P = 0.02, P = 0.014, P = 0.011, and P = 0.026, respectively; Table 4)
Table 4.
Binary Logistic Regression Analysis of Relationship Between Each Molecular Marker and VTE.
| Variable | β | SE | Wald | P-value | Oddsratio |
|---|---|---|---|---|---|
| TAT | 0.560 | 0.007 | 84.5 | <0.001* | 2.062 |
| PIC | 0.473 | 0.033 | 66.697 | <0.001* | 1.314 |
| TM | 0.104 | 0.017 | 5.382 | 0.02* | 1.04 |
| t-PAIC | 0.062 | 0.025 | 6.056 | 0.014* | 0.94 |
| D-dimer | 0.279 | 0.031 | 6.441 | 0.011* | 1.082 |
| FDP | 0.022 | 0.01 | 4.966 | 0.026* | 1.022 |
| Constant | −5.091 | 0.421 | 146.405 | <0.001* | 0.006 |
TAT, thrombin–antithrombin III complex; PIC, plasmin-α2-plasmininhibitor complex; TM, thrombomodulin; t-PAIC, tissue plasminogen activator–inhibitor complex; FDP, fibrin degradation product
*P < 0.05 considered statistically significant.
Evaluation of Value of Each Molecular Marker in the Diagnosis of VTE by Receiver Operating Curve(ROC) Analysis
The areas under the curve (AUC) of TAT, PIC, TM, t-PAIC, D-dimer, and FDP in diagnosing VTE were 0.875, 0.739, 0.714, 0.623, 0.637, and 0.634, respectively. The cut-off values of TAT, PIC, TM, t-PAIC, D-dimer, and FDP were 30.76µg/L, 4.84mg/L, 17.25kU/L, 16.55µg/L, 2.56µg/L, and 5.81mg/L, respectively. TAT showed a good diagnostic value for VTE, with a sensitivity of 85.6% and a specificity of 75.4%. The AUC of t-PAIC was 0.623, and its diagnostic efficiency was the lowest (Table 5, Figure 1). When a combination of the 6 markers was applied, the AUCs of “TAT+PIC+TM+t-PAIC” and “TAT+PIC+TM+t-PAIC+D-dimer+FDP” were significantly higher than the AUC of “D-dimer+FDP” in the diagnosis of VTE in patients with malignant tumors. The AUC, sensitivity, and specificity of “D-dimer+FDP” were 0.637, 74.5%, and 49.2%, respectively, whereas the AUC, sensitivity, and specificity of “TAT+PIC+TM+t-PAIC” were 0.923, 83.2%, and 81.5%, respectively. The AUC, sensitivity, and specificity of “TAT+PIC+TM+t-PAIC+D-dimer+FDP” were 0.937, 89.8%, and 88.5%, respectively. “TAT+PIC+TM+t-PAIC+D-dimer+FDP” showed the highest sensitivity and specificity(Table 6, Figure 2).
Table 5.
Diagnostic Efficiency of Each Molecular Marker in VTE in Patients With Malignant Tumors.
| Variable | AUC | Cut-off value | 95% CI | P-value | Sensitivity(%) | Specificity(%) | Youden index |
|---|---|---|---|---|---|---|---|
| TAT | 0.875 | 30.76 | 0.824–0.901 | <0.001* | 85.6 | 75.4 | 0.614 |
| PIC | 0.739 | 4.84 | 0.669–0.770 | <0.001* | 70.45 | 67.5 | 0.380 |
| TM | 0.714 | 17.25 | 0.663–0.765 | <0.001* | 59.1 | 83.1 | 0.421 |
| t-PAIC | 0.623 | 16.55 | 0.572–0.673 | <0.001* | 83.3 | 46.8 | 0.305 |
| D-dimer | 0.637 | 2.56 | 0.586–0.688 | <0.001* | 65 | 60.2 | 0.252 |
| FDP | 0.634 | 5.81 | 0.585–0.683 | <0.001* | 66.4 | 55.9 | 0.223 |
TAT, thrombin–antithrombin III complex; PIC, plasmin-α2-plasmininhibitor complex; TM, thrombomodulin; t-PAIC, tissue plasminogen activator–inhibitor complex; FDP, fibrin degradation product.
*P < 0.05 considered statistically significant.
Figure 1.
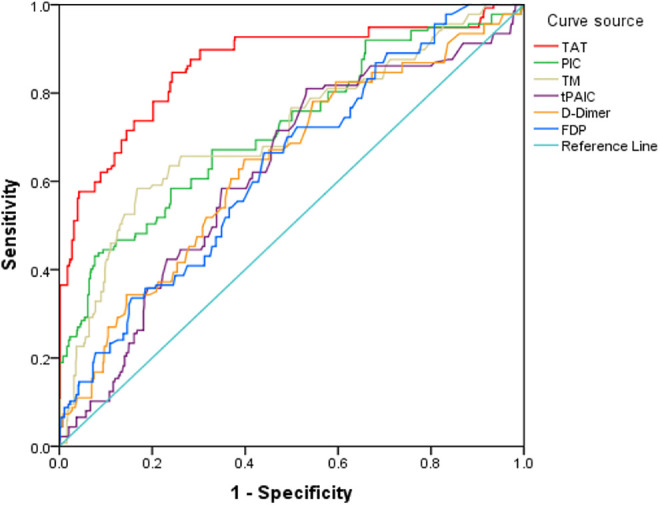
Receiver operating characteristic (ROC) curve analysis of each marker for VTE.
Table 6.
Combined Diagnosis of 6 Markers for VTE by ROC Curve.
| Variable | AUC | 95% CI | P-value | Sensitivity(%) | Specificity(%) | Youden index |
|---|---|---|---|---|---|---|
| TAT+PIC+TM+t-PAIC | 0.923 | 0.896–0.949 | <0.001* | 83.2 | 81.5 | 0.717 |
| TAT+PIC+TM+t-PAIC+D-dimer+FDP | 0.937 | 0.910–0.964 | <0.001* | 89.8 | 88.5 | 0.783 |
| D-dimer+FDP | 0.637 | 0.586–0.687 | <0.001* | 74.5 | 49.2 | 0.337 |
TAT, thrombin–antithrombin III complex; PIC, plasmin-α2-plasmininhibitor complex; TM, thrombomodulin; t-PAIC, tissue plasminogen activator–inhibitor complex; FDP, fibrin degradation product.
*P < 0.05 considered statistically significant.
Figure 2.
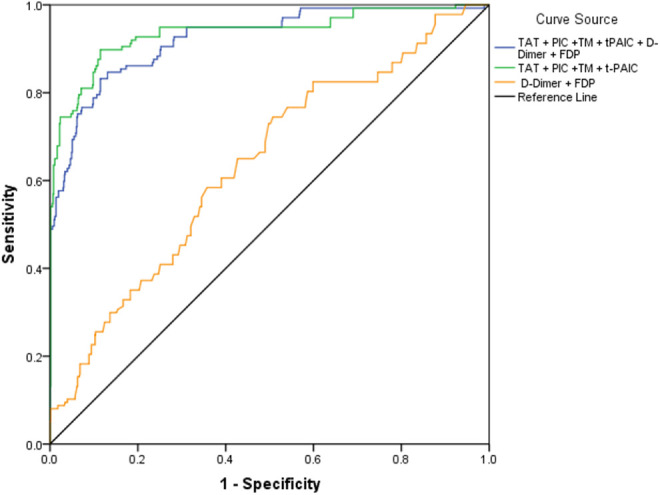
Receiver operating characteristic (ROC) curve analysis of combined 6 markers in diagnosis of VTE.
Evaluation of Correlations Between TAT, PIC, TM, t-PAIC, D-Dimer, FDP, and Prognosis Using the Kaplan–Meier Method
Survival analyses were performed with regard to the expressions of TAT, PIC, TM, t-PAIC, D-dimer, and FDP in patients with malignant tumors. The cut-off values of TAT, PIC, TM, t-PAIC, D-dimer, and FDP were 30.76µg/L, 4.84mg/L, 17.25 kU/L, 16.55µg/L, 2.56µg/L, and 5.81mg/L, respectively. Patients in whom the levels of all markers were higher than the cutoff values were classified as the high-level group(TAT >30.76, PIC >4.84, TM >17.25, t-PAIC >16.55, D-dimer >2.56, and FDP >5.81), whereas those in whom the levels were lower than the cutoff value were classified as the low-level group(TAT <30.76, PIC <4.84, TM <17.25, t-PAIC <16.55, D-dimer <2.56, and FDP <5.81).
The results of the survival analysis using the Kaplan–Meier method showed that the high-level groups of TAT, PIC, TM, t-PAIC had a significantly shorter overall survival compared with those included in the low-level groups (log-rank test P < 0.001, respectively; Figure 3A-D). However, D-dimer and FDP failed to differentiate between the outcomes of patients with malignant tumors (P = 0.495 and 0.483, respectively; Figure 3E and F). Next, we analyzed the relationship between TAT, PIC, TM, t-PAIC, D-dimer, FDP, and the prognosis of patients with malignant tumors in the thrombosis group. The results showed that TM and t-PAIC can be used as prognostic indicators in patients with malignant tumors, irrespective of whether the thrombus is formed (TM, P < 0.001; t-PAIC, P = 0.001) (Figure 4C and D), whereas TAT, PIC, D-dimer, and FDP cannot be used as prognostic markers in the thrombosis group (P = 0.064, 0.246, 0.056, and 0.385, respectively; Figure 4A, B, E, and F).
Figure 3.

(A-F)Kaplan–Meier survival curves of TAT, PIC, TM, t-PAIC, D-dimer, FDP, and overall survival in patients with malignant tumors.
Figure 4.

(A-F)Kaplan–Meier survival curve analysis of relationship between TAT, PIC, TM, t-PAIC, D-dimer, FDP, and survival rate in patients with malignant tumors in the thrombosis group.
In addition, multivariate Cox regression analysis was conducted in order to evaluate the possible associations between prognosis and TAT, PIC, TM, t-PAIC, D-dimer, and FDP. Among the parameters, TM (P < 0.001) and t-PAIC (P < 0.001) were significantly associated with poor prognosis (Table 7). TM and t-PAIC were identified as independent prognostic factors.
Table 7.
Multivariate Cox Regression Analysis of Prognostic Markers in Patients With Malignant Tumors.
| Variable | β | Wald | P-value | Odds ratio | 95.0% CI |
|---|---|---|---|---|---|
| TAT | 0.011 | 0.668 | 0.414 | 0.999 | 0.997–1.001 |
| PIC | 0.019 | 1.202 | 0.273 | 0.983 | 0.954–1.013 |
| TM | 1.270 | 130.081 | <0.001* | 1.073 | 1.057–1.088 |
| t-PAIC | 0.885 | 90.65 | <0.001* | 1.089 | 1.077–1.101 |
| D-Dimer | 0.028 | 2.125 | 0.145 | 1.028 | 0.990–1.068 |
| FDP | 0.017 | 4.972 | 0.066 | 0.981 | 0.964–0.998 |
TAT, thrombin–antithrombin III complex; PIC, plasmin-α2-plasmininhibitor complex; TM, thrombomodulin; t-PAIC, tissue plasminogen activator–inhibitor complex; FDP, fibrin degradation product.
*P < 0.05 considered statistically significant.
Low-Molecular-Weight Heparin(LMWH) for Prevention of VTE in Patients With Malignant Tumors
In total, 90 patients with TAT >30.76µg/L or PIC >4.84mg/L were selected from the non-thrombosis group. LMWH was injected into the endothelium 24–36 hours after the elevation of TAT or PIC in 45 patients(experimental group), and this was continued for 6 weeks. The other 45 patients were not treated with LMWH (control group). The 2 groups were followed up for 1 year. The incidence of VTE was 2.22%(1/45) in the experimental group and 15.56%(7/45) in the control group. Significant difference was observed between the 2 groups, and no bleeding was observed in the experimental group. The survival time of the patients in the experimental group was 10.6 ± 3.1 months and that of the control group was 8.5 ± 2.8 months. The difference between the groups was statistically significant (P = 0.026; Table 8).
Table 8.
Comparison of Incidence of VTE Between the Experimental and Control Groups.
| Group | Experimental group(%) | Control group(%) | χ2 | P-value |
|---|---|---|---|---|
| Venous thrombosis (+) | 1(2.22) | 7(15.56) | 4.939 | 0.026* |
| Venous thrombosis (-) | 44(97.78) | 38(84.44) |
*P < 0.05 indicates statistical significance.
Discussion
The process of thrombosis is a multifactor continuous complication related to the coagulation system, fibrinolysis system, and endothelial system.16,17 At present, the routine laboratory parameters fortesting coagulation, such as prothrombin time, activated partial thromboplastin time, thrombin time, fibrinogen, D-dimer, FDP, and coagulation factor have covered the coagulation and fibrinolysis systems; however, all these parameters enable passive detection and involve late screening after thrombosis, and are not sensitive to the pre-thrombotic state and pre-disseminated intravascular coagulation(pre-DIC). Monitoring of thrombolytic therapy failed to provide timely feedback, and early and reliable diagnosis in this regard is still lacking.
TAT is a sensitive marker of thrombin production and an indicator of activation of the coagulation system.18–20 Its formation is the best time to judge the anticoagulant treatment, and it can rise in the prethrombotic state. Thus, evaluation of TAT levels is suitable for the early diagnosis of thrombotic diseases and for monitoring thrombolytic therapy. The continuous increase of TAT indicates an increased risk of thrombosis. PIC is the starting pointof the fibrinolysis system, which reflects the activation degree of plasmin,21 monitors the functional status of the fibrinolysis system, and guides the anti-fibrinolysis treatment plan. TM is a marker of the vascular endothelial system, and it can be used to judge the injury or recovery of the vascular endothelium.22 Damage to the vascular endothelium in patients with malignant tumors can increase the level of TM.23 t-PAIC not only reflects the abnormality of fibrinolysis system but is also related to endothelial damage.24 TM and t-PAIC are also useful markers for predicting organ failure and clinical prognosis in patients with DIC and thrombotic diseases.25–27,17
In this study, we firstly used TAT, PIC, TM, and t-PAIC in combination with D-dimer and FDP to analyze their diagnostic and prognostic value in patients with malignant tumors, and to evaluate the preventive effect of LMWH in patients with malignant tumors. Our results showed that the levels of TAT, PIC, TM, t-PAIC, D-dimer, and FDP in the malignant tumor group were significantly higher than those in the healthy control group, and the levels in the thrombosis group were significantly higher than those in the non-thrombosis group. The results of binary logistic regression analysis showed that TAT, PIC, TM, t-PAIC, D-dimer, and FDP were all related to VTE in patients with malignant tumors. Therefore, these biomarkers might have important roles in the diagnosis of VTE in patients with malignant tumors.
Previous study by Mei et al.17 reported that TAT, PIC, t-PAIC, and TM had good diagnostic and prognostic value in the diagnosis of DIC in different basic diseases, and that a combination of the 4 markers showed better efficacy than that shown by a single marker alone. Similar to previous studies, the results of ROC analysis showed that the 6 markers had certain value in the diagnosis of VTE in patients with malignant tumors, of which TAT had the highest diagnostic value. The best cutoff value of TAT was 30.76 μg/L, the AUC was 0.875, and the sensitivity and specificity were higher than those of D-dimer and FDP. The area under ROC curve of PIC and TM (0.739, 0.714) were higher than D-dimer and FDP (0.637, 0.634), which means that the diagnostic efficiency of PIC and TM were much higher than that of D-dimer and FDP. PIC represents the activation of fibrinolytic system and reflects the formation of fibrin (thrombosis), so it can be used as a good monitoring indicator of venous thrombosis. TM reflects the formation of thrombus according to the degree of endothelial injury. Although the sensitivity of TM was slightly lower, its specificity was much higher than D-dimer and FDP. t-PAIC had the lowest diagnostic efficiency. In the diagnosis of VTE, we found that the combination of 6 biomarkers showed the highest sensitivity and specificity, which was superior to a single one. Thus, TAT, PIC, TM, and t-PAIC combined with D-dimer and FDP can be used as sensitive markers for the diagnosis of VTE in patients with malignant tumors.
Furthermore, in the high-level groups of TAT, PIC, TM, and t-PAIC, but not those of D-dimer and FDP, the 3-year overall survival rate of patients with malignant tumor were significantly reduced. However, in the thrombus group, the 3-year survival rate of high-level TM and t-PAIC were poor, and there were no significant difference in the prognosis of TAT, PIC, D-dimer and FDP. Multivariate Cox regression analysis also showed that TM and t-PAIC were independent prognostic factors. So TM and t-PAIC were independent prognostic indicators in patients with malignant tumors, regardless of the state of thrombus. TAT and PIC can be used as sensitive markers in the diagnosis of VTE but not as prognostic markers.
In addition, monotherapy using LMWH is considered to be the treatment of choice for venous thrombosis.28,29 We found that the incidence of VTE was significantly lower in patients with malignant tumors treated with LMWH, and their survival period was significantly longer than that of the control patients, which indicates that the use of LMWH is effective as apreventive anticoagulation treatment. Patients with high-risk tumors may be treated with prophylactic treatment for thrombosis. The study by Sakonet al.29 entailed the use of enoxaparin to prevent postoperative venous thrombosis in 151 patients who underwent abdominal and pelvic surgeries. The results showed that enoxaparin significantly reduced the incidence rate of VTE and did not increase the risk of bleeding. In the study by Pelzer et al.,9 312 patients with advanced pancreatic cancer were treated with enoxaparin simultaneously with chemotherapy. The results showed that enoxaparin was safe and effective in the primary prevention of VTE.
There were some limitations in our study. First, the patients were followed up every 3 months to record the living status and the cause of death, which may lead to some errors in survival analysis. Second, t-PAIC peaked around 8 a.m. and low in the evening. Our test was carried out according to the emergency needs, which may lead to the low diagnostic efficiency of t-PAIC. Finally, the population of prophylactic application of low molecular weight heparin was relatively small, and the experimental population should be gradually increased, which may be the focus of our future research. Besides, TM, t-PAIC are associated with organ failure, for further research we can study the application of TM, t-PAIC in patients with organ failure of different basic diseases.
In conclusion, TAT, PIC, TM, and t-PAIC can reflect thrombus formation from the coagulation system, fibrinolysis system, and endothelial system, and subsequently predict the prognosis of patients. The detection of TAT, PIC, TM, and t-PAIC combined with D-dimer and FDP is better than the application of a single marker, and is an ideal method for noninvasive detection of VTE at present. The occurrence and formation of thrombus in patients with malignant tumors can be detected in a more sensitive and reliable manner using this method. In addition, this combined detection could help monitor postoperative thrombus and hemorrhage, and evaluate the effect of thrombolysis and endothelial system injury. These markers can also aid early screening of the high-risk groups of VTE among patients with malignant tumors, help patients actively prevent medication, determine the best and optimal time of treatment, improve the prognosis of patients, reduce the incidence and mortality of venous thrombosis, and prolong the survival time of patients.
Acknowledgments
We thank Medjaden Bioscience Limited for their assistance in the preparation of this manuscript.
Footnotes
Authors’ Contributions: KZ and DW were responsible for the design, writing, and revision of the study. ZZ, XJ, and PL were responsible for sample collection. YZ and JZ contributed to sample testing and data analysis. BS and LW were responsible for follow-up and recording. All authors read and approved the final version of the manuscript.
Declaration of Conflicting Interests: The author(s) declared no potential conflicts of interest with respect to the research, authorship, and/or publication of this article.
Ethics Approval and Consent to Participate: All procedures were in accordance with the ethical standards of the institutional and/or national research committee and with the Declaration of Helsinki. The study was approved by the Ethical Committee of the General Hospital of Heilongjiang Province Land Reclamation Bureau, The 4th Affiliated Hospital of Harbin Medical University, Harbin Medical University Cancer Hospital (Harbin, China), and written informed consent was obtained from all participants before enrolment in the study.
Funding: The author(s) disclosed receipt of the following financial support for the research, authorship, and/or publication of this article: The present study was supported by Heilongjiang Provincial Health and Family Planning Commission (Grant no. 2017-566).
ORCID iD: Kun Zhou  https://orcid.org/0000-0002-0222-0301
References
- 1. Khorana AA, Francis CW, Culakova E, Kuderer NM, Lyman GH. Thromboembolism is a leading cause of death in cancer patients receiving outpatient chemotherapy. J Thromb Haemost. 2007;5:632–634(633). https://doi:10.1111/j.1538-7836.2007.02374.x [DOI] [PubMed] [Google Scholar]
- 2. Prandoni P, Lensing AW, Piccioli A, et al. Recurrent venous thromboembolism and bleeding complications during anticoagulant treatment in patients with cancer and venous thrombosis. Blood. 2002;100(10):3484–3488. https://doi:10.1182/blood-2002-01-0108 [DOI] [PubMed] [Google Scholar]
- 3. Boonyawat K, Crowther MA. Venous thromboembolism prophylaxis in critically ill patients. Semin Thromb Hemost. 2015;41(1):68–74. https://doi:10.1055/s-0034-1398386 [DOI] [PubMed] [Google Scholar]
- 4. Khorana AA, Carrier M, Garcia DA, Lee AY. Guidance for the prevention and treatment of cancer-associated venous thromboembolism. J Thromb Thrombolysis. 2016;41(1):81–91. https://doi:10.1007/s11239-015-1313-4 [DOI] [PMC free article] [PubMed] [Google Scholar]
- 5. White RH, Zhou H, Murin S, Harvey D. Effect of ethnicity and gender on the incidence of venous thromboembolism in a diverse population in California in 1996. Thromb Haemost. 2005;93(2):298–305. https://doi:10.1160/th04-08-0506 [DOI] [PubMed] [Google Scholar]
- 6. Blom JW, Vanderschoot JPM, Oostindiër MJ, et al. Incidence of venous thrombosis in a large cohort of 66,329 cancer patients: results of a record linkage study. J Thromb Haemost. 2006;4(3):529–535. https://doi:10.1111/j.1538-7836.2006.01804.x [DOI] [PubMed] [Google Scholar]
- 7. Hans-Martin MBO, Mathijssen J, ten Cate H, et al. Symptomatic venous thromboembolism in cancer patients treated with chemotherapy: an underestimated phenomenon. Arch Intern Med. 2004;164(2):190–194. https://doi:10.1001/archinte.164.2.190 [DOI] [PubMed] [Google Scholar]
- 8. Chew HK, Davies AM, Wun T, Harvey D, Zhou H, White RH. The incidence of venous thromboembolism among patients with primary lung cancer. J Thromb Haemost. 2008;6(4):601–608. https://doi:10.1111/j.1538-7836.2008.02908.x [DOI] [PubMed] [Google Scholar]
- 9. Pelzer U, Opitz B, Deutschinoff G, et al. Efficacy of prophylactic low-molecular weight heparin for ambulatory patients with advanced pancreatic cancer: outcomes from the CONKO-004 trial. J Clin Oncol. 2015;33(18):2028–2034. https://doi:10.1200/JCO.2014.55.1481 [DOI] [PubMed] [Google Scholar]
- 10. Khorana AA, Francis CW, Culakova E, Fisher RI, Kuderer NM, Lyman GH. Thromboembolism in hospitalized neutropenic cancer patients. J Clin Oncol. 2006;24(3):484–490. https://doi:10.1200/JCO.2005.03.8877 [DOI] [PubMed] [Google Scholar]
- 11. Heit JA, Silverstein MD, Mohr DN, Petterson TM, O’Fallon WM, Melton LJ., 3rd Risk factors for deep vein thrombosis and pulmonary embolism: a population-based case-control study. Arch Intern Med. 2000;160(6):809–815. https://doi:10.1001/archinte.160.6.809 [DOI] [PubMed] [Google Scholar]
- 12. Stubblefield WB, Courtney DM, Self WH. Should cancer patients receive apixaban to prevent venous thromboembolism? An analysis of the avert trial: January 2020 annals of emergency medicine journal club. Ann Emerg Med. 2020;75(1):116–118. https://doi:10.1016/j.annemergmed.2019.11.010 [DOI] [PubMed] [Google Scholar]
- 13. Khorana AA. Venous thromboembolism and prognosis in cancer. Thromb Res. 2010;125(6):490–493. https://doi:10.1016/j.thromres.2009.12.023 [DOI] [PMC free article] [PubMed] [Google Scholar]
- 14. Singh G, Rathi AK, Singh K, Sharma D. Venous thromboembolism in cancer patients-magnitude of problem, approach, and management. Indian J Cancer. 2017;54(1):308–312. https://doi:10.4103/ijc.IJC_101_17 [DOI] [PubMed] [Google Scholar]
- 15. Sørensen HT, Mellemkjaer L, Olsen JH, Baron JA. Prognosis of cancers associated with venous thromboembolism. N Engl J Med. 2000;343(25):1846–1850. https://doi:10.1056/NEJM200012213432504 [DOI] [PubMed] [Google Scholar]
- 16. Levi M, Meijers JC. DIC: which laboratory tests are most useful. Blood Rev. 2011;25(1):33–37. https://doi:10.1016/j.blre.2010.09.002 [DOI] [PubMed] [Google Scholar]
- 17. Mei H, Jiang Y, Luo L, et al. Evaluation the combined diagnostic value of TAT, PIC, tPAIC, and sTM in disseminated intravascular coagulation a multicenter prospective observational study. Thromb Res. 2019;173:20–26. https://doi:10.1016/j.thromres.2018.11.010 [DOI] [PubMed] [Google Scholar]
- 18. Azhar A, Singh P, Rashid Q, Naseem A, Khan MS, Jairajpuri MA. Antiangiogenic function of antithrombin is dependent on its conformational variation: implication for other serpins. Protein Pept Lett. 2013;20(4):403–411. https://doi:10.2174/0929866511320040004 [PubMed] [Google Scholar]
- 19. Yu X, Tian Y, Wang K, et al. Effect of ulinastatin combined rivaroxaban on deep vein thrombosis in major orthopedic surgery. Asian Pac J Trop Med. 2014;7(11):918–921. https://doi:10.1016/s1995-7645(14)60162-0 [DOI] [PubMed] [Google Scholar]
- 20. Koyama K, Madoiwa S, Nunomiya S, et al. Combination of thrombin-antithrombin complex, plasminogen activator inhibitor-1, and protein C activity for early identification of severe coagulopathy in initial phase of sepsis: a prospective observational study. Crit Care. 2014;18(1):R13 https://doi:10.1186/cc13190 [DOI] [PMC free article] [PubMed] [Google Scholar]
- 21. Asakura H, Ontachi Y, Mizutani T, et al. An enhanced fibrinolysis prevents the development of multiple organ failure in disseminated intravascular coagulation in spite of much activation of blood coagulation. Crit Care Med. 2001;29(6):1164–1168. https://doi:10.1097/00003246-200106000-00015 [DOI] [PubMed] [Google Scholar]
- 22. Kuryliszyn-Moskal A, Zarzycki W, Dubicki A, et al. Clinical usefulness of videocapillaroscopy and selected endothelial cell activation markers in people with Type 1 diabetes mellitus complicated by microangiopathy. Adv Med Sci. 2017;62(2):368–373. https://doi:10.1016/j.advms.2016.11.007 [DOI] [PubMed] [Google Scholar]
- 23. Akita N, Ma N, Okamoto T, et al. Host protein C inhibitor inhibits tumor growth, but promotes tumor metastasis, which is closely correlated with hypercoagulability. Thromb Res. 2015;135(6):1203–1208. https://doi:10.1016/j.thromres.2015.03.026 [DOI] [PubMed] [Google Scholar]
- 24. Erzen B, Sabovic M. In young post-myocardial infarction male patients elevated plasminogen activator inhibitor-1 correlates with insulin resistance and endothelial dysfunction. Heart Vessels. 2013;28(5):570–577. https://doi:10.1007/s00380-012-0287-9 [DOI] [PubMed] [Google Scholar]
- 25. Lin SM, Wang YM, Lin HC, et al. Serum thrombomodulin level relates to the clinical course of disseminated intravascular coagulation, multiorgan dysfunction syndrome, and mortality in patients with sepsis. Crit Care Med. 2008;36(3):683–689. https://doi:10.1097/ccm.0b013e31816537d8 [DOI] [PubMed] [Google Scholar]
- 26. Watanabe R, Wada H, Miura Y, et al. Plasma levels of total plasminogen activator inhibitor-I (PAI-I) and tPA/PAI-1 complex in patients with disseminated intravascular coagulation and thrombotic thrombocytopenic purpura. Clin Appl Thromb Hemost. 2001;7(3):229–233. https://doi:10.1177/107602960100700309 [DOI] [PubMed] [Google Scholar]
- 27. Okabayashi K, Wada H, Ohta S, Shiku H, Nobori T, Maruyama K. Hemostatic markers and the sepsis-related organ failure assessment score in patients with disseminated intravascular coagulation in an intensive care unit. Am J Hematol. 2004;76(3):225–229. https://doi:10.1002/ajh.20089 [DOI] [PubMed] [Google Scholar]
- 28. Carrier M, Gal GL, Cho R, Tierney S, Rodger M, Lee AY. Dose escalation of low molecular weight heparin to manage recurrent venous thromboembolic events despite systemic anticoagulation in cancer patients. J Thromb Haemost. 2009;7(5):760–765. https://doi:10.1111/j.1538-7836.2009.03326.x [DOI] [PubMed] [Google Scholar]
- 29. Sakon M, Kobayashi T, Shimazui T. Efficacy and safety of enoxaparin in Japanese patients undergoing curative abdominal or pelvic cancer surgery: results from a multicenter, randomized, open-label study. Thromb Res. 2010;125(3):e65–70. https://doi:10.1016/j.thromres.2009.09.009 [DOI] [PubMed] [Google Scholar]