

Abstract
Objectives
Errors and misreporting on death certificates are common, along with potential inaccuracies in cause-of-death coding. We characterized and compared fatalities by animal-encounter mentions reported as underlying cause of death (UCD) with animal-encounter mentions reported as multiple cause of death (MCD) to determine factors associated with misreporting UCD.
Methods
We analyzed fatality data from 1999-2016 from the Centers for Disease Control and Prevention Wide-ranging ONline Data for Epidemiologic Research by UCD and MCD animal-encounter mentions (International Classification of Diseases, 10th Revision codes W53-59, X20-27 and X29, T63.0-63.6, T63.8-63.9, and T78.2-78.4). We examined differences in reporting by age, sex, race, autopsy (yes, no, unknown), allergic reactions, and toxicities.
Results
The number of animal-encounter mentions by UCD was 3638 (202 average per year) and by MCD was 4280 (238 average per year), a difference of 18% (n = 642; 36 average per year) by MCD analysis. The number of nonvenomous animal-encounter mentions increased 20% (from 2138 UCD to 2567 MCD), and the number of venomous animal-encounter mentions increased 14% (from 1500 UCD to 1713 MCD). Decedents aged ≥65 had the highest additional number of animal-encounter mentions among all age groups, primarily encounters with other reptiles (n = 113), other mammals (n = 71), and dogs (n = 42). Of 642 MCD additional animal-encounter mentions, heart disease (n = 211, 33%) and infections (n = 146, 23%) represented more than half of the UCD. Of 553 dog-encounter fatalities, 165 (30%) were among children aged ≤4.
Conclusions
Animal-encounter fatalities, analyzed by UCD alone, may be underreported. An initiating animal injury, complicated by comorbidities and fatality, may obscure the causal chain, resulting in misreporting UCD. Ongoing training for medical certifiers is recommended, highlighting accurate identification of UCD and contributing causes in the causal chain of death.
Keywords: animal-encounter fatalities, animal-encounter deaths, bites and stings, underlying cause of death, multiple cause of death, death certification, misreporting, miscoding, One Health
Encounters with animals (domestic or exotic pets or wild animals in the environment), whether intentional or unintentional, may result in injury or illness including pain, envenomation, allergic reactions, wounds, infection, disfigurement, and, rarely, death. Encounters with animals may result in psychological distress and economic hardship from loss of work and health care costs. Injuries or death from animal encounters may be initiated by a scratch, a sting, or a bite or by being stepped on, fallen on, thrown off, butted, rammed, gored, crushed, asphyxiated, or envenomed. Contaminated wounds may result in life-threatening infections and sepsis. In some instances, anaphylactic reactions may occur among people sensitized to an animal’s venom, saliva, dander, or urine.
Worldwide, millions of people are injured and more than 180 000 deaths occur annually from animal encounters.1 Few deaths in the United States result from animal encounters. The human–animal bond is a well-recognized mutually beneficial relationship that exemplifies One Health2-5 and includes emotional, psychological, and physical interactions of people and animals that are essential to the health and well-being of both species.6 People of all ages are at risk of fatal animal encounters and injuries and would benefit from targeted education to prevent dog bites and domestic, exotic, and wildlife animal encounters in the environment.7-10
In the United States, nonfatal injuries from animal encounters outnumber fatalities from animal encounters. The Centers for Disease Control and Prevention (CDC) and the World Health Organization estimate that each year in the United States, dogs bite approximately 4.5-4.7 million people.1,11 Of these, nearly 885 000 seek medical care, resulting in an average of 323 000 emergency department visits, 30 000 reconstructive procedures, and 10-20 fatalities; 3%-18% of people with dog bites develop infections.1,12 An additional 76 000 people in the United States have a nonfatal fall injury because of a dog or cat.13 In addition, about 1 million people are seen in US emergency departments yearly from non–canine animal-related injuries.14 From 2006 to 2008, about 48 000 people were hospitalized annually in the United States because of an adverse animal encounter.15
A comparison of 2 studies of US animal-encounter deaths coded as underlying cause of death (UCD) showed that the average number of deaths per year increased from 177 during 1991-2001 to 201 during 2008-2015.16,17 One weakness of previously published studies of animal-encounter deaths in the United States is that only the UCD was reported and analyzed.16-18
The accuracy of death certification is essential, because the death certificate is a medical–legal document and source for state and national mortality statistics used to determine state and national health status, set public health goals, develop policy, and determine which medical conditions receive funding for research and development.19,20 The animal encounter may be listed correctly on the death certificate as the UCD, incorrectly as the immediate cause of death, or as a contributing condition in the causal chain contributing to the immediate cause (ie, a multiple cause of death [MCD]).21,22 For example, if a death certificate reported sepsis as the UCD when the injury that initiated the events resulting in death (the underlying cause) was an animal bite, the animal bite would not have been reported accurately with UCD analysis alone. We examined animal-encounter fatalities with International Classification of Diseases, 10th Revision (ICD-10) coded as UCD and reviewed animal-encounter codes listed as an important condition contributing to death on the death certificate, mentioned as an MCD rather than a UCD.23
Methods
The CDC Wide-ranging ONline Data for Epidemiologic Research (WONDER) is a web application consisting of 20 applications of health-related public-use data of births, deaths, and cancer diagnoses in the United States.24 We analyzed CDC WONDER public-use mortality data, which does not require institutional review board approval. We extracted data from CDC WONDER UCD and MCD databases. CDC WONDER compiles the death codes as stated on the death certificate (entity axis).24 Extracted data consisted of animal-encounter deaths (W and X codes) and toxicity injury deaths (T codes) classified by ICD-1023 for US residents from 1999 through 2016. CDC WONDER UCD and MCD databases contain county-level national mortality and population data based on death certificates for US residents of 50 states and the District of Columbia. Each death certificate indicates a single UCD with up to 20 MCDs (contributing causes) and demographic data.24 We used Microsoft Excel (Microsoft Corp) for statistical calculations.
The UCD is defined by the ICD-10 instruction manual as “the disease or injury which initiated the train of morbid events leading directly to death, or the circumstances of the accident or violence which produced the fatal injury.”22 We analyzed UCD data that resulted from venomous or nonvenomous animal encounters by using the following ICD-10 codes: nonvenomous: W53 (bitten by rat), W54 (bitten or struck by dog), W55 (bitten or struck by other mammals—includes cats, horses, cows, other hoof stock, pigs, raccoons, and other mammals, without species distinction), W56 (contact with marine animal—nonvenomous—includes dolphins, orcas, sea lions, sharks, other fish, and other nonvenomous marine mammals), W57 (bitten or stung by nonvenomous insect and other nonvenomous arthropods), W58 (bitten or struck by crocodile or alligator), and W59 (bitten or crushed by other reptiles); venomous: X20 (contact with venomous snakes and lizards), X21 (contact with venomous spiders), X22 (contact with scorpions), X23 (contact with hornets, wasps, and bees), X24 (contact with centipedes and venomous millipedes [tropical]), X25 (contact with other specified venomous arthropods), X26 (contact with venomous marine animals and plants), X27 (contact with other specified venomous animals), and X29 (contact with unspecified venomous animal or plant). Exclusions included fatalities from ingesting poisonous animals or plants and fatalities related to transportation accidents (V80.0 [animal-rider or occupant of animal-drawn vehicle injured in transport accident]).23,24
Evaluation of MCD coding is important to understand the causal chain or logical sequence of contributing conditions and the immediate cause that developed subsequent to the UCD (initiating event) and to reveal potential errors in UCD coding. According to the ICD-10 instruction manual, “Multiple-cause coding permits in-depth analysis of causes of death, for example of serious but avoidable complications of certain underlying causes, and the impact of coexisting conditions on the outcome of a disease process. Therefore, in mortality coding, both underlying cause and multiple causes should be recorded.”21,22 The MCD database combines mortality frequencies for underlying causes, immediate causes, and contributing causes of death.24
We compared MCD mortality data with mention of an animal encounter (ie, W and X ICD-10 codes) with UCD mortality data for the same ICD-10 codes to determine if additional animal-encounter mentions contributed to other UCD ICD-10 codes. For those additional animal-encounter mentions identified in the MCD analysis, we identified the UCD.
In addition, we reviewed MCD mortality data for mention of toxic effects of contact with venomous animals to determine if mortality frequencies corresponded with the frequency of UCD X codes. ICD-10 T63 codes included T63.0 (toxic effect of snake venom), T63.1 (toxic effect of venom of other reptiles), T63.2 (toxic effect of venom of scorpion), T63.3 (toxic effect of venom of spider), T63.4 (toxic effect of venom of other arthropods), T63.5 (toxic effect of contact with venomous fish), T63.6 (toxic effect of contact with other venomous marine animals), T63.8 (toxic effect of contact with other venomous animals), and T63.9 (toxic effect of contact with unspecified venomous animal).23,24
Animal-encounter mortality calculations used CDC WONDER annual population numbers (US Census Bureau estimates of national, state, and county resident populations25) and included frequencies, rates per 10 million population ([deaths/annual population] × 107), and percentages of total animal-encounter mentions by UCD and MCD analysis, age (<1, 1-4, 5-9, 10-19, 20-34, 35-64, ≥65), sex (male, female), race (White, Black/African American, Asian/Pacific Islander, American Indian/Alaska Native), injury intent (if injury was intentional), and autopsy (yes, no, unknown).24 Rates based on <20 events were considered unstable and therefore were not presented. We calculated differences in number, percentage, and ratio comparisons for deaths with animal-encounter mentions reported as UCD and for deaths with animal-encounter mentions reported as MCD.
Results
During the 18-year study period (1999-2016), a total of 3638 deaths were reported in the United States with a UCD ICD-10–coded animal encounter (Table 1; Figure 1). Fatal animal encounters caused an average of 202 deaths per year with UCD analysis and 238 deaths with MCD analysis. Nonvenomous animal-encounter deaths predominated.
Table 1.
Comparison of animal-encounter mentions reported as underlying cause of death (UCD) and multiple cause of death (MCD), by number, percentage difference, and rate ratio, United States, 1999-2016a
| Animal encounter (ICD-10 code)b | Animal-encounter mentions | ||||
|---|---|---|---|---|---|
| UCD, no. | MCD, no. | Difference, no. | % Difference | MCD/UCD, rate ratio | |
| Nonvenomous animals | |||||
| Bitten or struck by other mammals (W55)c | 1314 | 1432 | 118 | 9 | 1.09 |
| Bitten or struck by dog (W54) | 553 | 630 | 77 | 14 | 1.14 |
| Bitten or stung by nonvenomous insect and other nonvenomous arthropods (W57) | 155 | 245 | 90 | 58 | 1.58 |
| Bitten or crushed by other reptiles (W59) | 78 | 206 | 128 | 164 | 2.64 |
| Contact with marine animal (W56)d | 23 | 31 | 8 | 35 | 1.35 |
| Bitten or struck by crocodile or alligator (W58) | 12 | 13 | 1 | 8 | 1.08 |
| Bitten by rat (W53) | 3 | 10 | 7 | 233 | 3.33 |
| Total nonvenomous | 2138 | 2567 | 429 | 20 | 1.20 |
| Venomous animals | |||||
| Contact with hornets, wasps, and bees (X23) | 1063 | 1150 | 87 | 8 | 1.08 |
| Contact with other specified venomous arthropods (X25) | 157 | 180 | 23 | 15 | 1.15 |
| Contact with venomous spiders (X21) | 124 | 197 | 73 | 59 | 1.59 |
| Contact with venomous snakes and lizards (X20) | 112 | 129 | 17 | 15 | 1.15 |
| Contact with unspecified venomous animal or plant (X29) | 31 | 40 | 9 | 29 | 1.29 |
| Contact with scorpions (X22) | 7 | 8 | 1 | 14 | 1.14 |
| Contact with centipedes and venomous millipedes (tropical) (X24) | 5 | 7 | 2 | 40 | 1.40 |
| Contact with venomous marine animals and plants (X26) | 1 | 2 | 1 | 100 | 2.00 |
| Contact with other specified venomous animals (X27) | 0 | 0 | 0 | 0 | 0 |
| Total venomous | 1500 | 1713 | 213 | 14 | 1.14 |
| Total | 3638 | 4280 | 642 | 18 | 1.18 |
Abbreviation: ICD-10, International Classification of Diseases, 10th Revision.
aData source: Centers for Disease Control and Prevention.24
bData source: National Center for Health Statistics.23
cIncludes cats, horses, cows, other hoof stock, pigs, raccoons, and other mammals, without species distinction.
dIncludes dolphins, orcas, sea lions, sharks, other fish, and other nonvenomous marine mammals.
Figure 1.
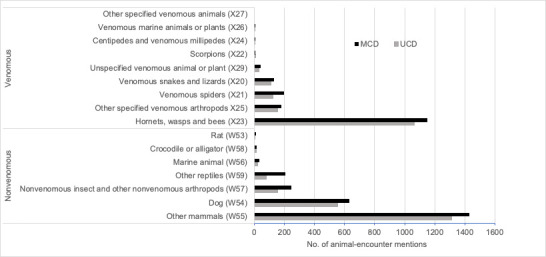
Animal-encounter mentions (International Classification of Diseases, 10th Revision code23) by underlying cause of death (UCD) and multiple cause of death (MCD), United States, 1999-2016. Data source: Centers for Disease Control and Prevention.24
The number of animal-encounter mentions increased 18%, from 3638 deaths by UCD to 4280 deaths by MCD; nonvenomous animal-encounter mentions increased 20%, from 2138 deaths by UCD to 2567 deaths by MCD, and venomous animal-encounter mentions increased 14%, from 1500 deaths by UCD to 1713 deaths by MCD. Of the 642 additional MCD animal-encounter mentions, the most frequently reported UCD were diseases of the heart (n = 211, 33%); infections (n = 146, 23%), including septicemia (n = 59) and potentially zoonotic infections (n = 55); malignant neoplasms (n = 44, 7%); unintentional injuries (n = 36, 6%); and cerebrovascular incidents (n = 26, 4%).
The MCD analysis revealed 429 additional nonvenomous animal-encounter mentions, predominantly other reptiles, other mammals, nonvenomous insect and other nonvenomous arthropods, and dogs (Table 1; Figure 1). Of 118 mentions of other mammals (MCD), 47 (40%) reported potential zoonotic infection for UCD, including 26 pasteurellosis, 9 septicemia, 4 rabies, and 1 tularemia. Of 77 animal-encounter mentions of dogs (MCD), 18 (23%) decedents died of potential zoonotic infection (UCD), including 12 septicemia (1 each Streptococcal and Staphylococcus aureus), 3 pasteurellosis, and 1 rabies. Of 7 animal-encounter mentions of rats, 4 decedents had a UCD of a potential zoonotic infection suggesting rat-bite fever: 2 endocarditis and 2 Streptobacillus. Animal-encounter mentions of other reptiles (nonvenomous lizards, snakes, turtles, and other unspecified reptiles) increased 2.6-fold (78 UCD, 206 MCD), surpassing mentions of marine animal encounters.
MCD analysis resulted in 213 additional mentions of venomous animal encounters, primarily hornets, wasps, bees, and venomous spiders (Table 1; Figure 1). Of 87 additional mentions of hornets, wasps, and bees, 61 (70%) were UCD-coded cardiovascular or stroke. Of 73 additional mentions of venomous spiders, 22 (30%) had infection codes for UCD.
Allergic reactions contributed to 565 of 1500 (38%) venomous animal-encounter deaths (UCD), 515 with contributing anaphylactic shock codes (T78.2): 427 hornets, wasps, and bees; 66 other specified venomous arthropods; 10 venomous snakes and lizards; 10 unspecified venomous animal or plant; 1 venomous spider; and 1 scorpion. Allergy, unspecified (T78.4) contributed to 45 UCD venomous animal-encounter deaths: 33 hornets, wasps, and bees; 11 other specified venomous arthropods; and 1 unspecified venomous animal or plant. Five deaths caused by venomous animals (UCD) had contributing angioneurotic edema (T78.3): 4 hornets, wasps, and bees; and 1 specified venomous arthropod.
On average, approximately 3 times more male than female decedents died of animal encounters (UCD; Figure 2). Deaths among males outnumbered deaths among females in every year of the study by 2- to 3-fold; annual range, 125-178 (average, 148); annual rate, 9-11 deaths per 10 million population. Among females, the number of annual deaths ranged from 40-70 (average, 54), and the rate was 2-4 deaths per 10 million population. For every nonvenomous and venomous animal-encounter category (UCD) except other reptiles (39 each), the number of deaths was higher among males than among females. For nonvenomous animal encounters, the number of deaths was 2.2 times higher among males than among females (1463 vs 675), particularly for encounters with other mammals (966 vs 348). For encounters with venomous animals, the number of deaths was 4.0-fold higher among males than among females (1198 vs 302). We found differences between males and females for encounters with hornets, wasps, and bees (872 vs 191); other specified venomous arthropods (128 vs 29); and venomous snakes and lizards (88 vs 24).
Figure 2.

Number and rate of animal-encounter deaths reported on death certificates as underlying cause of death, by sex, United States, 1999-2016. Data source: Centers for Disease Control and Prevention.24
Of 3638 deaths caused by animal encounters (UCD), 2923 (80.3%) occurred among adults aged >35, 269 (7.4%) among children aged ≤4, and 254 (7.0%) among adults aged 20-34 (Table 2). The highest death rates per 10 million population were among men aged 35-64 and ≥65 (27.2 each). In the MCD analysis, decedents aged ≥65 represented 358 of 642 (55.8%) additional animal-encounter mentions; overall increase, 31% (1150 UCD, 1508 MCD): nonvenomous, 36% (760 UCD, 1033 MCD) and venomous, 22% (390 UCD, 475 MCD; Tables 2 and 3).
Table 2.
Underlying cause of death (UCD) animal-encounter mentions, by age, sex, race, and nonvenomous or venomous animal encounter (ICD-10 codes),a United States, 1999-2016b
| UCD animal-encounter mentions | Total | Age group, y, no. (%) | ||||||
|---|---|---|---|---|---|---|---|---|
| <1 | 1-4 | 5-9 | 10-19 | 20-34 | 35-64 | ≥65 | ||
| Sex | ||||||||
| Male | 2661 | 38 (1.4) | 131 (4.9) | 69 (2.6) | 51 (1.9) | 195 (7.3) | 1345 (50.5) | 832 (31.3) |
| Female | 977 | 28 (2.9) | 72 (7.4) | 39 (4.0) | 33 (3.4) | 59 (6.0) | 428 (43.8) | 318 (32.5) |
| Total | 3638 | 66 (1.8) | 203 (5.6) | 108 (3.0) | 84 (2.3) | 254 (7.0) | 1773 (48.7) | 1150 (31.6) |
| Race | ||||||||
| White | 3258 | 54 (1.7) | 151 (4.6) | 88 (2.7) | 76 (2.3) | 224 (6.9) | 1582 (48.6) | 1083 (33.2) |
| Black/African American | 287 | 10 (3.5) | 39 (13.6) | 13 (4.5) | 4 (1.4) | 21 (7.3) | 150 (52.3) | 50 (17.4) |
| Asian/Pacific Islander | 37 | 1 (2.7) | 4 (10.8) | 1 (2.7) | 2 (5.4) | 4 (10.8) | 16 (43.2) | 9 (24.3) |
| American Indian/Alaska Native | 56 | 1 (1.8) | 9 (16.1) | 6 (10.7) | 2 (3.6) | 5 (8.9) | 25 (44.6) | 8 (14.3) |
| Total | 3638 | 66 (1.8) | 203 (5.6) | 108 (3.0) | 84 (2.3) | 254 (7.0) | 1773 (48.7) | 1150 (31.6) |
| Animal encounter (ICD-10 code) | ||||||||
| Nonvenomous animals | ||||||||
| Bitten or struck by other mammals (W55)c | 1314 | 16 (1.2) | 67 (5.1) | 47 (3.6) | 58 (4.4) | 104 (7.9) | 517 (39.3) | 505 (38.4) |
| Bitten or struck by dog (W54) | 553 | 46 (8.3) | 119 (21.5) | 53 (9.6) | 8 (1.4) | 19 (3.4) | 158 (28.6) | 150 (27.1) |
| Bitten or stung by nonvenomous insect and other nonvenomous arthropods (W57) | 155 | 1 (0.6) | 5 (3.2) | 0 | 2 (1.3) | 26 (16.8) | 83 (53.5) | 38 (24.5) |
| Bitten or crushed by other reptiles (W59) | 78 | 0 | 1 (1.3) | 0 | 0 | 3 (3.8) | 15 (19.2) | 59 (75.6) |
| Contact with marine animal (W56)d | 23 | 0 | 0 | 1 (4.3) | 4 (17.4) | 1 (4.3) | 13 (56.5) | 4 (17.4) |
| Bitten or struck by crocodile or alligator (W58) | 12 | 0 | 1 (8.3) | 0 | 0 | 4 (33.3) | 4 (33.3) | 3 (25.0) |
| Bitten by rat (W53) | 3 | 0 | 0 | 0 | 0 | 0 | 2 (66.7) | 1 (33.3) |
| Total nonvenomous | 2138 | 63 (2.9) | 193 (9.0) | 101 (4.7) | 72 (3.4) | 157 (7.3) | 792 (37.0) | 760 (35.5) |
| Venomous animals | ||||||||
| Contact with hornets, wasps, and bees (X23) | 1063 | 1 (0.1) | 2 (0.2) | 1 (0.1) | 4 (0.4) | 59 (5.6) | 711 (66.9) | 285 (26.8) |
| Contact with other specified venomous arthropods (X25) | 157 | 1 (0.6) | 0 | 0 | 3 (1.9) | 12 (7.6) | 105 (66.9) | 36 (22.9) |
| Contact with venomous spiders (X21) | 124 | 0 | 1 (0.8) | 3 (2.4) | 2 (1.6) | 9 (7.3) | 78 (62.9) | 31 (25.0) |
| Contact with venomous snakes and lizards (X20) | 112 | 0 | 5 (4.5) | 3 (2.7) | 3 (2.7) | 13 (11.6) | 66 (58.9) | 22 (19.6) |
| Contact with unspecified venomous animal or plant (X29) | 31 | 0 | 0 | 0 | 0 | 3 (9.7) | 16 (51.6) | 12 (38.7) |
| Contact with scorpions (X22) | 7 | 1 (14.3) | 2 (28.6) | 0 | 0 | 1 (14.3) | 2 (28.6) | 1 (14.3) |
| Contact with centipedes and venomous millipedes (tropical) (X24) | 5 | 0 | 0 | 0 | 0 | 0 | 2 (40.0) | 3 (60.0) |
| Contact with venomous marine animals and plants (X26) | 1 | 0 | 0 | 0 | 0 | 0 | 1 (100.0) | 0 |
| Contact with other specified venomous animals (X27) | 0 | 0 | 0 | 0 | 0 | 0 | 0 | 0 |
| Total venomous | 1500 | 3 (0.2) | 10 (0.7) | 7 (0.5) | 12 (0.8) | 97 (6.5) | 981 (65.4) | 390 (26.0) |
| Total animal-encounter mentions | 3638 | 66 (1.8) | 203 (5.6) | 108 (3.0) | 84 (2.3) | 254 (7.0) | 1773 (48.7) | 1150 (31.6) |
Abbreviation: ICD-10, International Classification of Diseases, 10th Revision.
aData source: National Center for Health Statistics.23
bData source: Centers for Disease Control and Prevention.24
cIncludes cats, horses, cows, other hoof stock, pigs, raccoons, and other mammals, without species distinction.
dIncludes dolphins, orcas, sea lions, sharks, other fish, and other nonvenomous marine mammals.
Table 3.
Multiple cause of death (MCD) animal-encounter mentions, by age, sex, race, and nonvenomous or venomous animal encounter (ICD-10 code),a United States, 1999-2016b
| MCD animal-encounter mentions | Total | Age group, y, no. (%) | ||||||
|---|---|---|---|---|---|---|---|---|
| <1 | 1-4 | 5-9 | 10-19 | 20-34 | 35-64 | ≥65 | ||
| Sex | ||||||||
| Male | 3048 | 40 (1.3) | 134 (4.4) | 70 (2.3) | 57 (1.9) | 217 (7.1) | 1510 (49.5) | 1020 (33.5) |
| Female | 1230 | 29 (2.4) | 72 (5.9) | 40 (3.3) | 37 (3.0) | 63 (5.1) | 501 (40.7) | 488 (39.7) |
| Total | 4278 | 69 (1.6) | 206 (4.8) | 110 (2.6) | 94 (2.2) | 280 (6.5) | 2011 (47.0) | 1508 (35.3) |
| Race | ||||||||
| White | 3834 | 57 (1.5) | 154 (4.0) | 89 (2.3) | 84 (2.2) | 239 (6.2) | 1789 (46.7) | 1422 (37.1) |
| Black/African American | 341 | 10 (2.9) | 39 (11.4) | 14 (4.1) | 5 (1.5) | 29 (8.5) | 178 (52.2) | 66 (19.4) |
| Asian/Pacific Islander | 41 | 1 (2.4) | 4 (9.8) | 1 (2.4) | 2 (4.9) | 6 (14.6) | 16 (39.0) | 11 (26.8) |
| American Indian/Alaska Native | 62 | 1 (1.6) | 9 (14.5) | 6 (9.7) | 3 (4.8) | 6 (9.7) | 28 (45.2) | 9 (14.5) |
| Total | 4278 | 69 (1.6) | 206 (4.8) | 110 (2.6) | 94 (2.2) | 280 (6.5) | 2011 (47.0) | 1508 (35.3) |
| Animal encounter (ICD-10 code) | ||||||||
| Nonvenomous animals | ||||||||
| Bitten or struck by other mammals (W55)c | 1432 | 17 (1.2) | 67 (4.7) | 47 (3.3) | 63 (4.4) | 106 (7.4) | 556 (38.8) | 576 (40.2) |
| Bitten or struck by dog (W54) | 630 | 46 (7.3) | 119 (18.9) | 54 (8.6) | 8 (1.3) | 22 (3.5) | 189 (30.0) | 192 (30.5) |
| Bitten or stung by nonvenomous insect and other nonvenomous arthropods (W57) | 245 | 2 (0.8) | 5 (2.0) | 1 (0.4) | 3 (1.2) | 30 (12.2) | 126 (51.4) | 78 (31.8) |
| Bitten or crushed by other reptiles (W59) | 206 | 1 (0.5) | 1 (0.5) | 0 | 0 | 3 (1.5) | 29 (14.1) | 172 (83.5) |
| Contact with marine animal (W56)d | 31 | 0 | 0 | 1 (3.2) | 4 (12.9) | 2 (6.5) | 15 (48.4) | 9 (29.0) |
| Bitten or struck by crocodile or alligator (W58) | 13 | 0 | 1 (7.7) | 0 | 0 | 4 (30.8) | 5 (38.5) | 3 (23.1) |
| Bitten by rat (W53) | 10 | 0 | 1 (10.0) | 0 | 1 (10.0) | 0 | 5 (50.0) | 3 (30.0) |
| Total nonvenomous | 2567 | 66 (2.6) | 194 (7.6) | 103 (4.0) | 79 (3.1) | 167 (6.5) | 925 (36.0) | 1033 (40.2) |
| Venomous animals | ||||||||
| Contact with hornets, wasps, and bees (X23) | 1150 | 1 (0.1) | 3 (0.3) | 1 (0.1) | 4 (0.3) | 64 (5.6) | 751 (65.3) | 326 (28.3) |
| Contact with other specified venomous arthropods (X25) | 180 | 1 (0.6) | 1 (0.6) | 0 | 3 (1.7) | 12 (6.7) | 114 (63.3) | 49 (27.2) |
| Contact with venomous spiders (X21) | 197 | 0 | 1 (0.5) | 3 (1.5) | 3 (1.5) | 18 (9.1) | 123 (62.4) | 49 (24.9) |
| Contact with venomous snakes and lizards (X20) | 129 | 0 | 5 (3.9) | 3 (2.3) | 5 (3.9) | 14 (10.9) | 74 (57.4) | 28 (21.7) |
| Contact with unspecified venomous animal or plant (X29) | 40 | 0 | 0 | 0 | 0 | 4 (10.0) | 20 (50.0) | 16 (40.0) |
| Contact with scorpions (X22) | 8 | 1 (12.5) | 2 (25.0) | 0 | 0 | 1 (12.5) | 2 (25.0) | 2 (25.0) |
| Contact with centipedes and venomous millipedes (tropical) (X24) | 7 | 0 | 0 | 0 | 0 | 0 | 3 (42.9) | 4 (57.1) |
| Contact with venomous marine animals and plants (X26) | 2 | 0 | 0 | 0 | 0 | 0 | 1 (50.0) | 1 (50.0) |
| Contact with other specified venomous animals (X27) | 0 | 0 | 0 | 0 | 0 | 0 | 0 | 0 |
| Total venomous | 1713 | 3 (0.2) | 12 (0.7) | 7 (0.4) | 15 (0.9) | 113 (6.6) | 1088 (63.5) | 475 (27.7) |
| Total animal-encounter mentions | 4280 | 69 (1.6) | 206 (4.8) | 110 (2.6) | 94 (2.2) | 280 (6.5) | 2013 (47.0) | 1508 (35.2) |
Abbreviation: ICD-10, International Classification of Diseases, 10th Revision.
aData source: National Center for Health Statistics.23
bData source: Centers for Disease Control and Prevention.24
cIncludes cats, horses, cows, other hoof stock, pigs, raccoons, and other mammals, without species distinction.
dIncludes dolphins, orcas, sea lions, sharks, other fish, and other nonvenomous marine mammals.
Of 2138 nonvenomous animal encounters (UCD), the category with the highest mortality was other mammals (n = 1314, 61.5%) followed by dogs (n = 553, 25.9%; Table 2). Among encounters with other mammals (UCD), mortality was highest among adults aged 35-64 (n = 517) and ≥65 (n = 505). Of 553 dog-encounter deaths, 165 (29.8%) occurred among children aged ≤4, 158 (28.6%) among adults aged 35-64, and 150 (27.1%) among adults aged ≥65. The MCD analysis, compared with the UCD analysis, revealed 183 additional animal-encounter mentions for other mammals and dogs (1330 vs 1513) among adults aged ≥35 (Tables 2 and 3). By age group, adults aged ≥65 had the most additional mentions for encounters with other reptiles (n = 113), other mammals (n = 71), and dogs (n = 42) in the MCD analysis as compared with the UCD analysis.
Of 1500 venomous animal-encounter deaths (UCD), 1063 (70.9%) were caused by hornets, wasps, and bees; 157 (10.5%) by other specified venomous arthropods; 124 (8.3%) by venomous spiders; and 112 (7.5%) by venomous snakes and lizards (Table 2). Of 1500 venomous animal-encounter deaths, 981 (65.4%) occurred among adults aged 35-64 and 390 (26.0%) among adults aged ≥65. Eighty-one additional mentions (MCD) occurred among decedents aged ≥35 for encounters with hornets, wasps, and bees (Table 3).
More White decedents than decedents from other racial groups had animal-encounter fatalities: 3258 of 3638 (89.6%) UCD and 576 of 642 (89.7%) additional mentions in the MCD analysis (Tables 2 and 3). Of animal-encounter fatalities with known autopsy information, autopsies were performed in 45.4% (1218 of 2683) of UCD and 39.3% (155 of 394) of additional mentions in the MCD analysis. Autopsy information was unknown for 955 of 3638 (26.2%) UCD animal encounters and 246 of 640 (38.4%) MCD additional mentions.
Discussion
We reviewed 18 years of animal-encounter fatalities (1999-2016) using CDC WONDER for UCD, consistent with previous studies.16-18 We also reviewed data on MCD—a novel approach—to identify animal encounters reported on death certificates as an immediate or contributing cause of death. Our findings suggest that analyzing fatalities by underlying cause alone in CDC WONDER may result in underreporting of risk and animal-encounter fatalities. We speculate that an initiating animal injury complicated by coexisting conditions (eg, heart disease, cancer, or infection) may trigger a cascade of morbid events leading to hospitalization and fatality, overshadowing the true UCD and causal chain of events for the certifier.
According to CDC,26 the leading cause of death for people aged 1-44 in the United States is unintentional injury. However, fatal animal encounters account for a small percentage of injuries inflicted on humans. Not surprisingly, the UCD for 642 additional animal-encounter mentions in the MCD analysis was primarily a condition rated in the top 5 leading causes of death (2016)27: diseases of the heart (33%), malignant neoplasms (7%), unintentional injuries (6%), and cerebrovascular diseases (4%). People aged ≥65 are more likely than people aged <65 to have serious coexisting conditions; the top 2 causes of death in 2017 for people aged ≥45 were heart disease and malignant neoplasms.26 In our analysis, compared with adults aged <65, adults aged ≥65 were at higher risk of death from animal encounters—primarily encounters with other reptiles, other mammals, and dogs—representing more than half of additional mentions in the MCD analysis. An older person with comorbidities who is bitten by a dog and then has a cardiovascular or cerebrovascular event may have influenced prioritization of underlying cause for the certifier, with resultant misreporting of underlying cause—the dog bite. Understanding cause-of-death terminology and causal-chain sequencing is necessary for accurate death certification.21,22
In our study, autopsies were performed in 39% of deaths coded with contributing (MCD) animal encounters. One study found that the accuracy of cause-of-death reporting could be improved if the death certificate is completed in conjunction with the postmortem examination and amended when a discrepancy exists.28 Another study found that autopsy findings led to changes in the UCD for 61% of cases involved in an autopsy in 2005; 32% involved a change in the ICD-10 code.29
Consistent with previous UCD studies,16-18 nonvenomous animal encounters, predominantly encounters with other mammals and dogs, caused most deaths. Our analysis reemphasizes the risk of fatal dog encounters among children aged ≤4. Annually, in the United States, more than 1 million emergency department visits for bites or scratch wounds are reported (about 300 000 of which are for dog bites or scratches); however, not all of these bites or scratches are associated with infections.30 Of all animal bites, 3%-18% of dog bites and 28%-80% of cat bites become infected.30-32 Our study found that among 642 additional MCD animal-encounter mentions, infections (n = 146) ranked second for UCD, and many of the ICD-10 codes were consistent with zoonotic disease (ie, pasteurellosis, rabies, Steptobacillus, and tularemia), suggesting that an animal encounter may be the UCD and highlighting potential misclassification or misreporting UCD certification.
Limitations
This study had several limitations. First, the classification of UCD and MCD in CDC WONDER depends on the accuracy of death certification. Errors in UCD and causation sequencing may result in misclassification of ICD-10 codes and high error rates in death certification, according to multiple studies.33-38 Second, ICD-10 codes for animal encounters do not distinguish among species of animals, making it difficult to attribute risk to specific animals. Third, CDC WONDER data do not include death certificate information on place of injury, injury description, and injury at work, which could provide clues to underlying cause circumstances and causal sequence.
Conclusions
Our findings support a combined CDC WONDER analysis of UCD and MCD animal-encounter fatalities to accurately present animal-encounter fatality statistics and elucidate potential misreporting. Errors and misreporting of UCD certification are common and may result in inaccurate ICD-10 coding and underreporting fatality statistics. Ongoing training of medical certifiers is indicated, focusing on accurate identification of UCD and sequence of conditions leading to the final disease or condition. It is important to understand that the disease or injury that initiated the chain of events (ie, animal encounter) is reported on the death certificate as UCD to inclusively describe the risk of animal encounters through accurate fatality statistics. Fewer than half of fatalities had autopsies, which are possibly the gold standard for accuracy in death certification.
This study indicates that people of all ages are at risk of fatal animal encounters. Fatal dog encounters among children aged ≤4 are particularly concerning. Adults aged ≥65 were more likely than people aged <65 to have fatal encounters with other reptiles, other mammals, and dogs. These findings support an exploration of targeted age group–based preventive education using a One Health approach2-5 to nurture the human–animal bond while teaching respect for and appropriate behavior around animals. Children aged ≤4 would likely benefit from education provided to parents, caregivers, and teachers in multiple venues using a One Health approach to prevent dog bites.
Acknowledgments
The authors thank Kenneth D. Kochanek, MA, statistician, from the US Department of Health and Human Services, Centers for Disease Control and Prevention (CDC), National Center for Health Statistics for his expertise and insightful assistance with CDC WONDER and our research. The views contained in this article are those of the authors and do not necessarily represent the official position of CDC.
Footnotes
Declaration of Conflicting Interests: The authors declared no potential conflicts of interest with respect to the research, authorship, and/or publication of this article.
Funding: The authors received no financial support with respect to the research, authorship and/or publication of this article.
ORCID iD
Marilyn Goss Haskell, DVM, MPH https://orcid.org/0000-0002-1207-0108
References
- 1. World Health Organization Animal bites. Published February 5, 2018. Accessed February 1, 2020 https://www.who.int/news-room/fact-sheets/detail/animal-bites
- 2. Centers for Disease Control and Prevention, National Center for Emerging and Zoonotic Infectious Diseases One Health. Last reviewed May 22, 2020. Accessed July 15, 2020 https://www.cdc.gov/onehealth/index.html
- 3. World Health Organization One Health. Accessed July 15, 2020 https://www.who.int/news-room/q-a-detail/one-health
- 4. US Food and Drug Administration One Health: it’s for all of us. Last reviewed February 3, 2020. Accessed July 15, 2020 https://www.fda.gov/animal-veterinary/animal-health-literacy/one-health-its-all-us
- 5. Mackenzie JS., Jeggo M. The One Health approach—why is it so important? Trop Med Infect Dis. 2019;4(2):88. 10.3390/tropicalmed4020088 [DOI] [PMC free article] [PubMed] [Google Scholar]
- 6. American Veterinary Medical Association Human–animal bond. Accessed February 1, 2020 https://www.avma.org/one-health/human-animal-bond
- 7. American Veterinary Medical Association Dog bite prevention. Accessed February 1, 2020 https://www.avma.org/resources-tools/pet-owners/dog-bite-prevention
- 8. American Academy of Pediatrics Dog bite prevention tips. Updated June 8, 2018. Accessed February 1, 2020 https://www.healthychildren.org/English/safety-prevention/all-around/Pages/Dog-Bite-Prevention-Tips.aspx
- 9. US Geological Survey Simple ways to avoid public exposures to infectious wildlife diseases summarized. Accessed February 1, 2020 https://www.usgs.gov/center-news/simple-ways-avoid-public-exposures-infectious-wildlife-diseases-summarized?qt-news_science_products=3#qt-news_science_products
- 10. Centers for Disease Control and Prevention Healthy pets, healthy people: wildlife. Updated October 22, 2018. Accessed February 1, 2020 https://www.cdc.gov/healthypets/pets/wildlife.html
- 11. Quirk JT. Non-fatal dog bite injuries in the U.S.A., 2005-2009. Public Health. 2012;126(4):300-302. 10.1016/j.puhe.2012.01.010 [DOI] [PubMed] [Google Scholar]
- 12. Gilchrist J., Gotsch K., Annest JL., Ryan G. Nonfatal dog bite-related injuries treated in hospital emergency departments—United States, 2001. MMWR Morb Mortal Wkly Rep. 2003;52(26):605-610. [PubMed] [Google Scholar]
- 13. Centers for Disease Control and Prevention Nonfatal fall-related injuries associated with dogs and cats—United States, 2001-2006. MMWR Morb Mortal Wkly Rep. 2009;58(11):277-281. [PubMed] [Google Scholar]
- 14. Langley R., Mack K., Haileyesus T., Proescholdbell S., Annest JL. National estimates of noncanine bites and sting injuries treated in US hospital emergency departments, 2001-2010. Wilderness Environ Med. 2014;25(1):14-23. 10.1016/j.wem.2013.08.007 [DOI] [PMC free article] [PubMed] [Google Scholar]
- 15. Langley RL. Animal-related injuries resulting in emergency department visits and hospitalizations in the United States, 2006-2008. Hum Wildlife Interactions. 2012;6(1):123-136. [Google Scholar]
- 16. Langley RL. Animal-related fatalities in the United States—an update. Wilderness Environ Med. 2005;16(2):67-74. 10.1580/1080-6032(2005)16[67:AFITUS]2.0.CO;2 [DOI] [PubMed] [Google Scholar]
- 17. Forrester JA., Weiser TG., Forrester JD. An update on fatalities due to venomous and nonvenomous animals in the United States (2008-2015). Wilderness Environ Med. 2018;29(1):36-44. 10.1016/j.wem.2017.10.004 [DOI] [PubMed] [Google Scholar]
- 18. Forrester JA., Holstege CP., Forrester JD. Fatalities from venomous and nonvenomous animals in the United States (1999-2007). Wilderness Environ Med. 2012;23(2):146-152. 10.1016/j.wem.2012.02.012 [DOI] [PubMed] [Google Scholar]
- 19. Centers for Disease Control and Prevention Medical Examiners’ and Coroners’ Handbook on Death Registration and Fetal Death Reporting. Hyattsville, MD: National Center for Health Statistics; 2003. Accessed February 1, 2020 https://www.cdc.gov/nchs/data/misc/hb_me.pdf
- 20. Centers for Disease Control and Prevention Physicians’ Handbook on Medical Certification of Death. Hyattsville, MD: National Center for Health Statistics; 2003. Accessed February 1, 2020 https://www.cdc.gov/nchs/data/misc/hb_cod.pdf
- 21. US Department of Health and Human Services, Centers for Disease Control and Prevention, National Center for Health Statistics Instructions for completing the cause-of-death section of the death certificate. Published August 2004. Accessed February 1, 2020 https://www.cdc.gov/nchs/data/dvs/blue_form.pdf
- 22. National Center for Health Statistics National Vital Statistics System: instruction manuals. Accessed July 21, 2020 https://www.cdc.gov/nchs/nvss/instruction_manuals.htm
- 23. National Center for Health Statistics International Classification of Diseases, 10th Revision (ICD-10). Updated April 15, 2016. Accessed February 1, 2020 https://www.cdc.gov/nchs/icd/icd10.htm
- 24. Centers for Disease Control and Prevention CDC WONDER. Accessed November 30, 2018 http://www.wonder.cdc.gov
- 25. US Census Bureau Population. Accessed July 24 2020 https://www.census.gov/topics/population.html
- 26. Centers for Disease Control and Prevention, Injury Prevention and Control Ten leading causes of death and injury—images 2005-2018. Accessed July 17, 2020 https://www.cdc.gov/injury/wisqars/LeadingCauses.html
- 27. Centers for Disease Control and Prevention, National Center for Health Statistics Number of deaths for leading causes of death. Accessed March 18, 2019 https://www.cdc.gov/nchs/fastats/leading-causes-of-death.htm
- 28. Smith Sehdev AE., Hutchins GM. Problems with proper completion and accuracy of the cause-of-death statement. Arch Intern Med. 2001;161(2):277-284. 10.1001/archinte.161.2.277 [DOI] [PubMed] [Google Scholar]
- 29. Alfsen GC., Mæhlen J. The value of autopsies for determining the cause of death. Tidsskr Nor Laegeforen. 2012;132(2):147. 10.4045/tidsskr.11.0427 [DOI] [PubMed] [Google Scholar]
- 30. Wilson BA., Ho M. Pasteurella multocida: from zoonosis to cellular microbiology. Clin Microbiol Rev. 2013;26(3):631-655. 10.1128/CMR.00024-13 [DOI] [PMC free article] [PubMed] [Google Scholar]
- 31. Körmöndi S., Terhes G., Pál Z. et al. Human pasteurellosis health risk for elderly persons living with companion animals. Emerg Infect Dis. 2019;25(2):229-235. 10.3201/eid2502.180641 [DOI] [PMC free article] [PubMed] [Google Scholar]
- 32. Christenson ES., Ahmed HM., Durand CM. Pasteurella multocida infection in solid organ transplantation. Lancet Infect Dis. 2015;15(2):235-240. 10.1016/S1473-3099(14)70895-3 [DOI] [PubMed] [Google Scholar]
- 33. Brooks EG., Reed KD. Principles and pitfalls: a guide to death certification. Clin Med Res. 2015;13(2):74-82. 10.3121/cmr.2015.1276 [DOI] [PMC free article] [PubMed] [Google Scholar]
- 34. Schrodi SJ. The impact of diagnostic code misclassification on optimizing the experimental design of genetic association studies. J Healthc Eng. 2017;2017:7653071. 10.1155/2017/7653071 [DOI] [PMC free article] [PubMed] [Google Scholar]
- 35. Maharjan L., Shah A., Shrestha KB., Shrestha G. Errors in cause-of-death statement on death certificates in intensive care unit of Kathmandu, Nepal. BMC Health Serv Res. 2015;15:507. 10.1186/s12913-015-1168-6 [DOI] [PMC free article] [PubMed] [Google Scholar]
- 36. Hanzlick R. Quality assurance review of death certificates: a pilot study. Am J Forensic Med Pathol. 2005;26(1):63-65. 10.1097/01.paf.0000154110.84737.e0 [DOI] [PubMed] [Google Scholar]
- 37. Jordan JM., Bass MJ. Errors in death certificate completion in a teaching hospital. Clin Invest Med. 1993;16(4):249-255. [PubMed] [Google Scholar]
- 38. Myers KA., Farquhar DR. Improving the accuracy of death certification. CMAJ. 1998;158(10):1317-1323. [PMC free article] [PubMed] [Google Scholar]