Abstract
Type-2 diabetes (T2D) is a global disease caused by the inability of pancreatic β-cells to secrete adequate insulin. However, the molecular mechanisms underlying the failure of β-cells to respond to glucose in T2D remains unknown. Here, we investigated the relative contribution of UDP-glucose (UDP-G), a P2Y14-specific agonist, in the regulation of insulin release using human isolated pancreatic islets and INS-1 cells. P2Y14 was expressed in both human and rodent pancreatic β-cells. Dose-dependent activation of P2Y14 by UDP-G suppressed glucose-stimulated insulin secretion (GSIS) and knockdown of P2Y14 abolished the UDP-G effect. 12-h pretreatment of human islets with pertussis-toxin (PTX) improved GSIS and prevented the inhibitory effect of UDP-G on GSIS. UDP-G on GSIS suppression was associated with suppression of cAMP in INS-1 cells. UDP-G decreased the reductive capacity of nondiabetic human islets cultured at 5 mm glucose for 72 h and exacerbated the negative effect of 20 mm glucose on the cell viability during culture period. T2D donor islets displayed a lower reductive capacity when cultured at 5 mm glucose for 72 h that was further decreased in the presence of 20 mm glucose and UDP-G. Presence of a nonmetabolizable cAMP analog during culture period counteracted the effect of glucose and UDP-G. Islet cultures at 20 mm glucose increased apoptosis, which was further amplified when UDP-G was present. UDP-G modulated glucose-induced proliferation of INS-1 cells. The data provide intriguing evidence for P2Y14 and UDP-G's role in the regulation of pancreatic β-cell function.
Keywords: pancreas, insulin secretion, purine, purinoceptor, diabetes, islet, hormone, G protein–coupled receptor, GPCR
Glucose-stimulated insulin secretion (GSIS) can be modulated by different metabolic, nervous, or hormonal factors (1). Although endogenously produced nucleotides such as ATP and UTP affect insulin secretion in a positive manner, when exogenously applied, these nucleotides might also impact GSIS differently, depending on the target receptors that they are activating (2).
The exogenous effects of ATP and UTP, as well as their metabolites, are mediated through interactions with two major subfamilies of plasma membrane receptors i.e. P2X (seven subtypes) and P2Y (eight subtypes) (3). P2X receptors are ligand-gated ion channels with a very rapid and transient mode of action, whereas P2Y receptors are metabotropic G protein–coupled receptors with a sustained duration of action. As mentioned, at least eight human P2Y receptors are known (P2Y1, P2Y2, P2Y4, P2Y6, P2Y11, P2Y12, P2Y13, and P2Y14) (3). Some of these receptors reportedly have a regulatory impact on the β-cell function in rodents (2, 4–7). P2Y1, P2Y11, P2Y12, and P2Y13 receptors selectively interact with ATP and/or ADP (8), whereas P2Y2, P2Y4, P2Y6 and P2Y14 receptors are activated by UTP, UDP, or its sugar metabolites (9, 10). The P2Y14 receptor specifically responds to UDP-glucose (UDP-G) stimulation and, to a lesser extent, also to other related sugar-nucleotides, but is unresponsive to ATP, ADP, UTP, and UDP (10, 11). UDP-G is a component of glycosylation reactions that take place intracellularly in many cell types especially in hepatocytes, in the process of glycogen metabolism (12, 13). UDP-G is also released during physiological and pathophysiological conditions where it functions as an important extracellular signaling molecule acting as potent agonists of the P2Y14 (13, 14).
The present study was carried out to investigate the biological effects of UDP-G on human pancreatic β-cells. Our data revealed that UDP-G negatively modulates GSIS by suppressing cAMP content via a pertussis toxin–sensitive mechanism.
Results
P2Y14 expression in human and mouse pancreatic islets
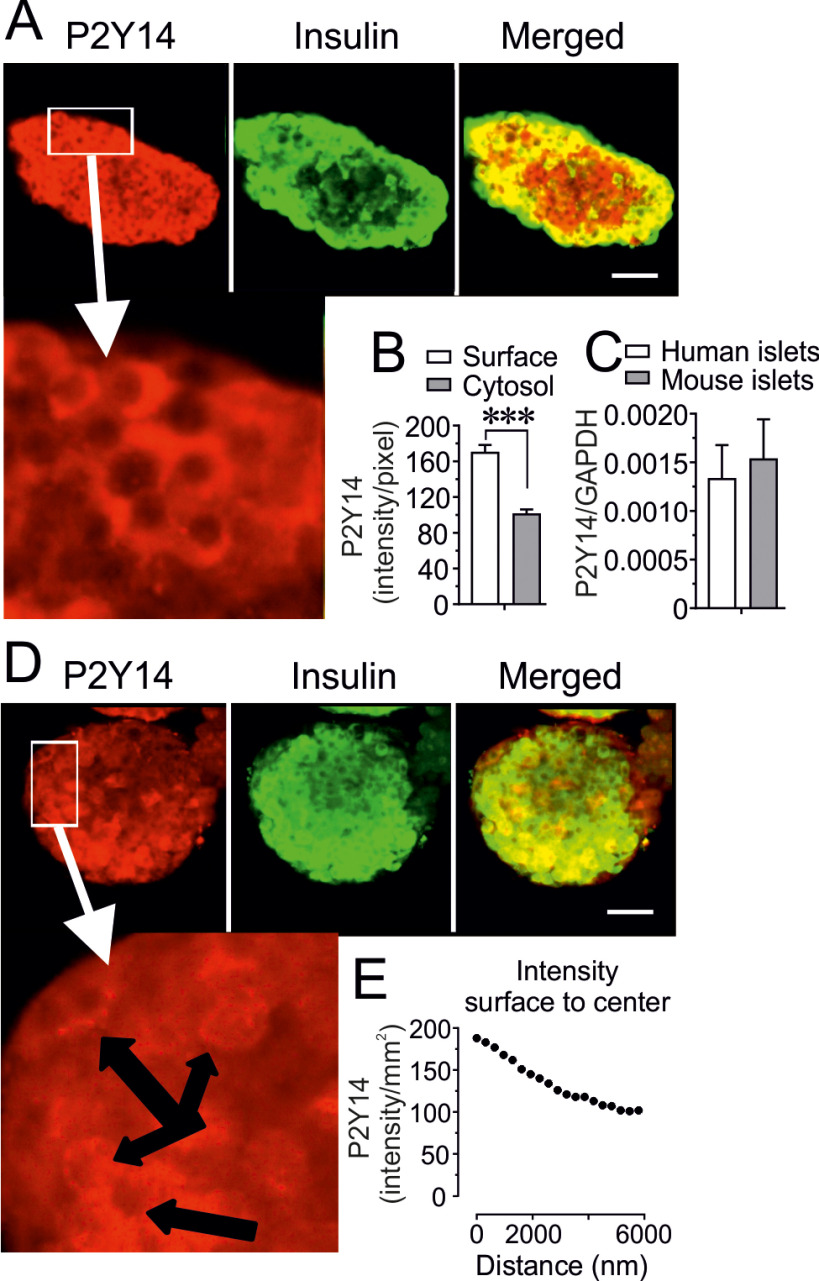
The expression pattern of P2Y14 in human and mouse pancreatic islets was investigated by immunofluorescence assay and confocal microscopy in combination with qPCR. Double labeling for P2Y14 and insulin revealed that P2Y14 is expressed in both human and mouse β-cells (Fig. 1, A–D). A linear and sequential analysis (300 nm for each point measurement) of confocal images revealed a higher P2Y14 intensity at the surface of β-cells (Fig. 1, A, B, D, E). The expression of P2Y14 mRNA in human and mouse islets were confirmed by qPCR (Fig. 1C).
Figure 1.
P2Y14 surface expression in human and mouse β-cells. A, representative confocal images demonstrating that P2Y14 protein is expressed predominantly on the surface of β-cells in human islets (scale bar: 20 μm). B, calculation of the mean intensity (surface and cytosolic) of P2Y14 protein expression in human islet β-cells using Zen 2009 (Carl Zeiss, Oberkochen, Germany) software. Results calculated from 19 β-cells, taken from randomly chosen islets isolated, from six mice are shown. Data are mean ± S.E. C, relative P2Y14 mRNA expression measured by qPCR in human and mouse islets. Mean ± S.E. from n = 3 (human) and 4 (mouse) islet preparations are shown. *** <0.001 (Student's t test). D, a representative confocal images of P2Y14 expression predominantly on the surface of β-cells in mouse islets (scale bar: 20 μm). E, a representative linear measurement of the mean P2Y14 expression intensity (surface to cytosol) in mouse islet β-cells using Zen 2009 (Carl Zeiss, Oberkochen, Germany) software.
The effect of the P2Y14 agonist UDP-glucose on insulin secretion
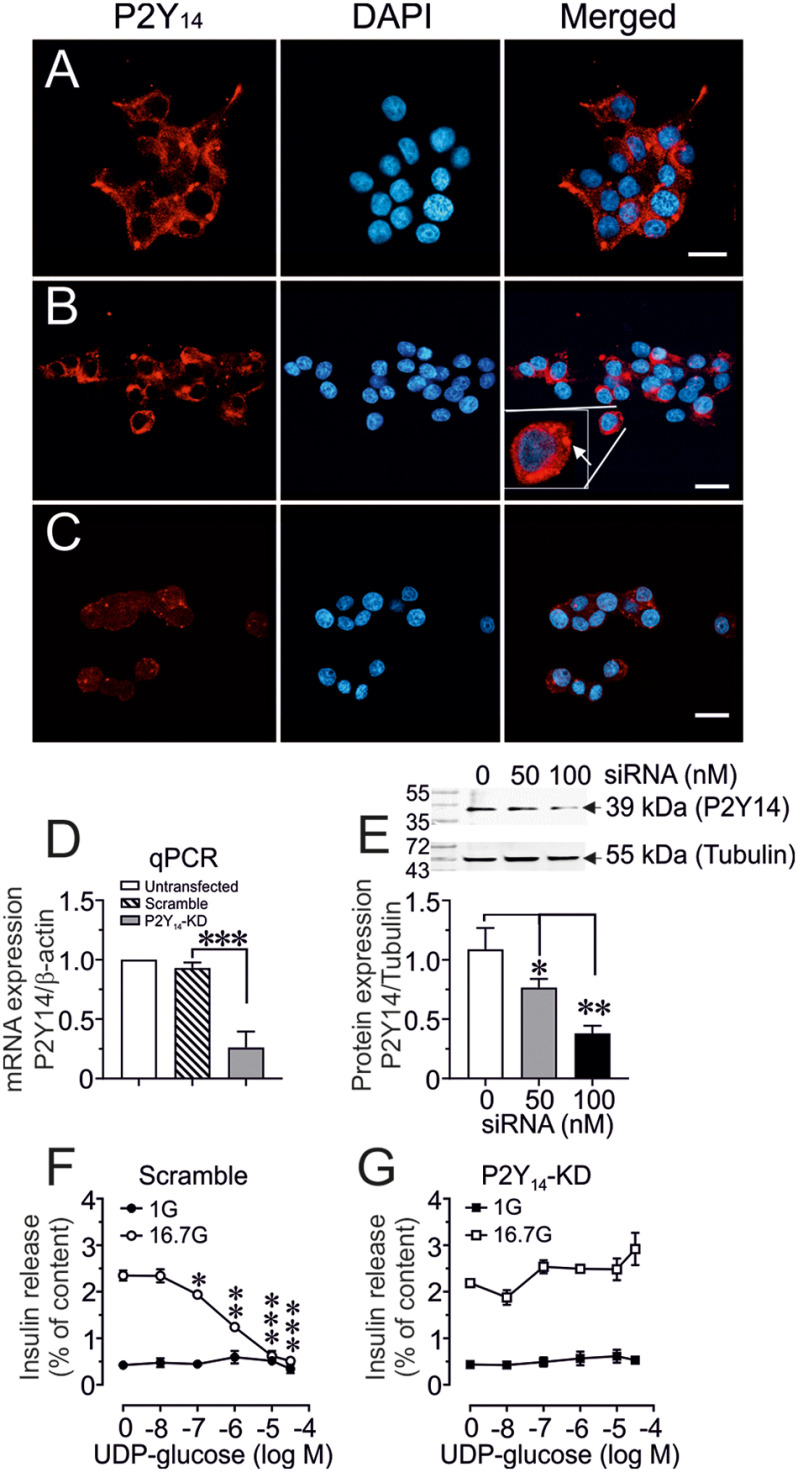
Expression and cellular localization of P2Y14 was also studied in rat insulinoma INS-1 832/13 cells which was in line with our observation of β-cells in human and mouse islets (Fig. 2). Fig. 2A (vehicle control) and 2B (scrambled control) showed a normal expression pattern of P2Y14 in INS-1 832/13 cells. Down-regulation of P2Y14 by siRNA (100 nm) (Fig. 2C) markedly attenuated the expression of P2Y14 at protein level as shown by confocal image. This was further confirmed by qPCR (mRNA) (Fig. 2D) and by Western blotting (protein) (Fig. 2E), which revealed that indeed 100 nm of siRNA is needed to completely down-regulate P2Y14 expression. We next tested the effect of a selective P2Y14 agonist e.g. UDP-G on GSIS upon P2Y14 knockdown (P2Y14-KD) in INS-1 832/13 cells. Whereas the UDP-G did not affect basal (1 mm glucose) insulin release, it dose-dependently inhibited glucose-stimulated (16.7 mm glucose) insulin secretion in scrambled control INS-1 832/13 cells (with normal P2Y14 expression), incubated for 60 min (Fig. 2F). Knockdown of P2Y14 by siRNA (100 nm) prevented the inhibitory effect of UDP-G on GSIS (Fig. 2G).
Figure 2.
P2Y14-Konckdown (P2Y14-KD) and β-cell function. A–C, representative confocal images demonstrating P2Y14 protein expression in untransfected (A), scrambled (B), or P2Y14-KD (C) INS-1 cells (scale bar: 10 μm). B, insert (Merged) shows an increased magnification of the P2Y14 expression in the designated INS-1 cell. D, P2Y14 mRNA expression relative to β-actin measured by qPCR in untransfected control, scrambled control, and P2Y14-KD INS-1 832/13 cells. E, a representative Western blot image of P2Y14 protein expression relative to tubulin in scrambled control and P2Y14-KD (50 or 100 nm) INS-1 832/13 cell homogenates. The band intensity was quantified using Image Laboratory software (Bio-Rad). Mean ± S.E. for three independent experiments, n = 3 replicates in each experiment is shown. *, p < 0.05; **, p < 0.01 (t test). F and G, concentration-dependent effect of UDP-G on basal (1 mm) or glucose-stimulated (16.7 mm) insulin secretion in scramble control and P2Y14-KD INS-1 832/13 cells. Mean ± S.E. for three different experiments performed at three different occasions is shown. *, p < 0.05; **, p < 0.01; ***, p < 0.001 compared with 0 UDP-G (t test).
Next, we found that in the presence of 16.7 mm glucose, UDP-G dose-dependently exerted a similar inhibitory action on GSIS from isolated human islets incubated for 60 min (Fig. 3A). In contrast, UDP-G did not affect basal insulin secretion at 1 mm glucose, demonstrating that UDP-G requires a stimulatory level of glucose for inhibiting insulin secretion (Fig. 3A). Because UDP-G is a selective P2Y14 agonist, and because P2Y14 is a Gi-coupled receptor, pertussis toxin (PTX) was used to evaluate the role of P2Y14 and UDP-G on the regulation of insulin secretion. As shown in Fig. 3, B and C, overnight pretreatment of islets with PTX (200 ng/ml) not only improved GSIS but also completely reversed the inhibitory action of UDP-G on GSIS. We also studied the effect of UDP-G on glucose-stimulated cAMP production in glucose-responsive INS-1 832/13 cells. GSIS (16.7 mm) in INS-1 832/13 cells were associated with an increased cAMP generation and the cAMP generation concomitant with the GSIS was markedly suppressed when UDP-G was present during the incubation period (Fig. 4, A and B).
Figure 3.
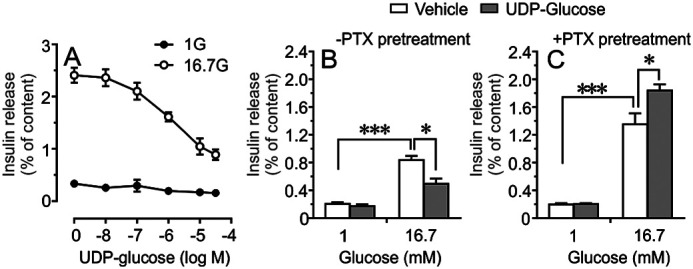
Inhibitory action of UDP-glucose (UDP-G) on insulin secretion. A, dose-response curve corresponding to the inhibitory effect of UDP-G on glucose-stimulated insulin release from isolated human islets incubated for 1 h. Insulin responses were calculated as percentage of total insulin content. Mean ± S.E. performed on islets from four donors are shown. B and C, effect of pertussis toxin (200 ng/ml) treatment (12 h) on insulin secretion from isolated islets incubated at 1 mm or 16.7 mm glucose in the presence or absence of UDP-G (10 μm). Mean ± S.E. from n = 3 different experiments are shown. *<0.05, ***<0.001 (Tukey-Kramer's multiple comparisons test).
Figure 4.
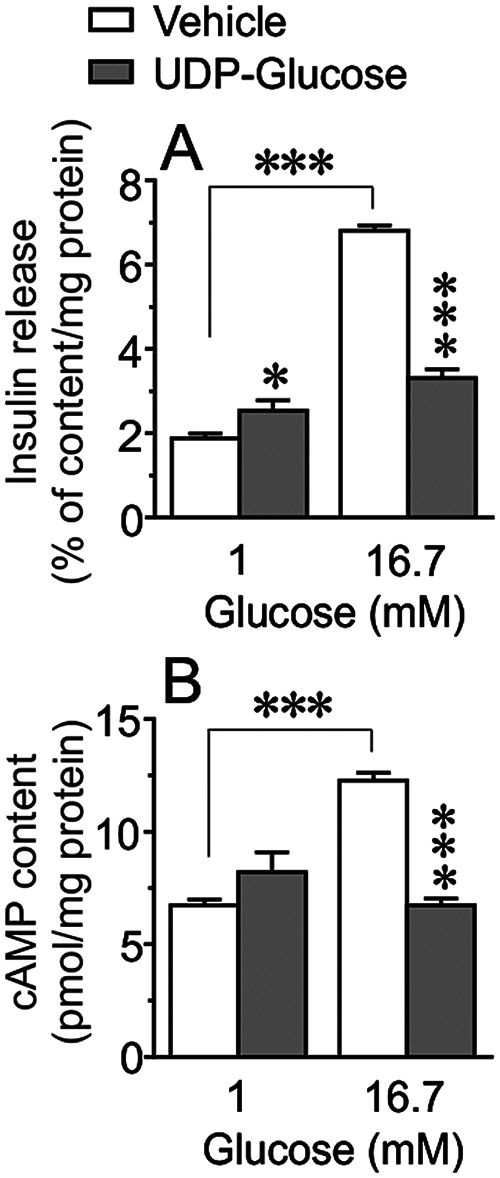
The inhibitory action of UDP-G on GSIS is associated with reduced cAMP generation. A and B, basal (1 mm) and glucose-stimulated (16.7 mm) insulin secretion (A) and cAMP content (B) in INS-1 cells incubated for 1 h in the presence or absence of UDP-G (10 μm). Results are mean ± S.E. from four independent experiments. ***<0.001 (Tukey-Kramer's multiple comparisons test).
The effect of UDP-glucose on pancreatic islet cell viability
Next, we investigated the impact of glucotoxicity on pancreatic islet cell viability by measuring the reductive capacity (reflecting β-cell mitochondrial metabolism) and apoptosis (reflecting β-cell dysfunction). The reductive capacity of isolated human pancreatic islets from nondiabetic (ND) donors cultured at 5 mm glucose for 72 h, was markedly decreased when UDP-G (10 μm) was present during the culture period (Fig. 5A). High glucose (20 mm) by itself, during the culture period, decreased the reductive capacity of pancreatic islets and the presence of UDP-G further intensifies this effect (Fig. 5A). The negative effects of high glucose alone or in combination with UDP-G was completely prevented by the nonmetabolizable cAMP analog dibutyryl cAMP (Bt2-cAMP) (100 μm) (Fig. 5A). This was also observed when islets from T2D donors were studied, i.e. UDP-G reduced further the already depressed reductive capacity of T2D islets and exacerbated the negative effect of high glucose on the reductive capacity of diabetic islet cells (Fig. 5B). The negative effect of high glucose alone or in combination with UDP-G during the culture period was prevented when Bt2-cAMP was present (Fig. 5B).
Figure 5.
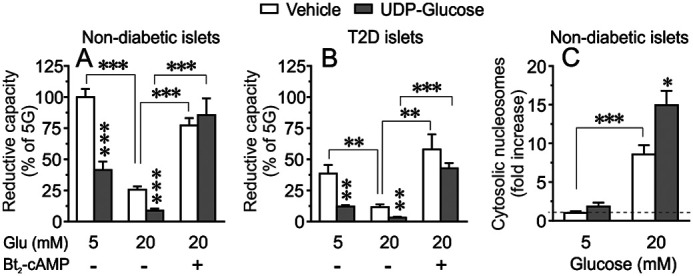
Cell viability and apoptosis after 72-h culture. A and B, effects of UDP-G (10 μm) on islet cell reductive capacity (viability) when isolated human islets from nondiabetic (A) or T2D donors (B) were cultured at 5 or 20 mm glucose for 72 h. Effect of Bt2-cAMP (100 μm) on islets cultured at 20 mm glucose are included. Mean ± S.E. for three donors in each group (three replicates from each donor) are shown. C, glucose-induced apoptosis measured as increased cytosolic nucleosome in isolated human islets cultured at 5 or 20 mm glucose for 72 h in the presence or absence of UDP-glucose (10 μm). Apoptosis is expressed as percentage of the control values measured at 5 mm glucose as denoted by dotted line. Results are mean ± S.E. from six independent experiments performed on islets from six donors. *, p < 0.05; **, p < 0.01; ***, p < 0.001 (Tukey-Kramer's multiple comparisons test).
We also investigated the effect of UDP-G on glucose-induced apoptosis (measurement of cytoplasmic nucleosome) in the islets from ND donors. As illustrated in Fig. 5C, culture of isolated islets at high glucose (20 mm) for 72 h markedly increased apoptosis, which was further amplified when UDP-G (10 μm) was present. The basal rate of islet cell apoptosis at 5 mm glucose culture was not appreciably affected by UDP-G (Fig. 5C). We next evaluated the specific role of P2Y14 in UDP-G–mediated apoptosis by measuring cytosolic nucleosomes in INS-1 832/13 cells. As shown in Fig. 6, whereas UDP-G exerted a similar apoptotic effect in 20 mm glucose cultured scrambled control cells, knockdown of P2Y14 markedly prevented the UDP-G mediated apoptosis.
Figure 6.
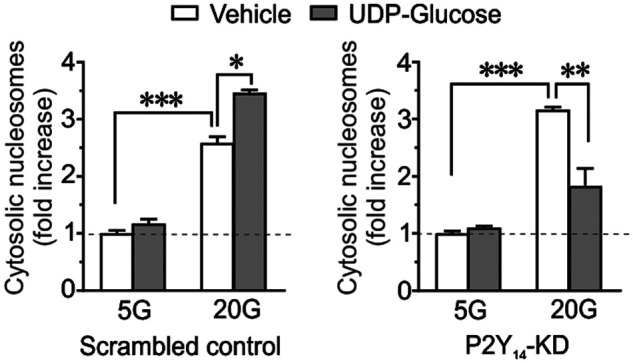
Glucose-induced apoptosis measured as increased cytosolic nucleosome in INS-1 832/13 cells cultured at 5 or 20 mm glucose for 72 h in the presence or absence of UDP-G (10 μm). Apoptosis is expressed as -fold increase of the control values measured at 5 mm glucose as denoted by dotted line. Results are mean ± S.E. from six independent experiments performed on six different cell passages. *, p < 0.05; **, p < 0.01; ***, p < 0.001 (Tukey-Kramer's multiple comparisons test).
Effect of UDP-glucose on cell proliferation
The impact of UDP-G on the INS-1 832/13 cell proliferation was also investigated by counting the actual cell number, which is a reliable assay method that has been shown recently (15) after a culture period of 24 h at 5 or 20 mm glucose in the presence or absence of different concentration of UDP-G (0.1, 1, 10 μm). As shown in Fig. 7, at 5 mm glucose, none of the UDP-G concentrations appreciably affected cell division/proliferation whereas at 20 mm glucose, which by itself increased cell proliferation compared with 5 mm glucose (Fig. 7), UDP-G at 10 μm suppressed the proliferative effect of high glucose (20 mm) on the INS-1 832/13 cells (Fig. 7).
Figure 7.
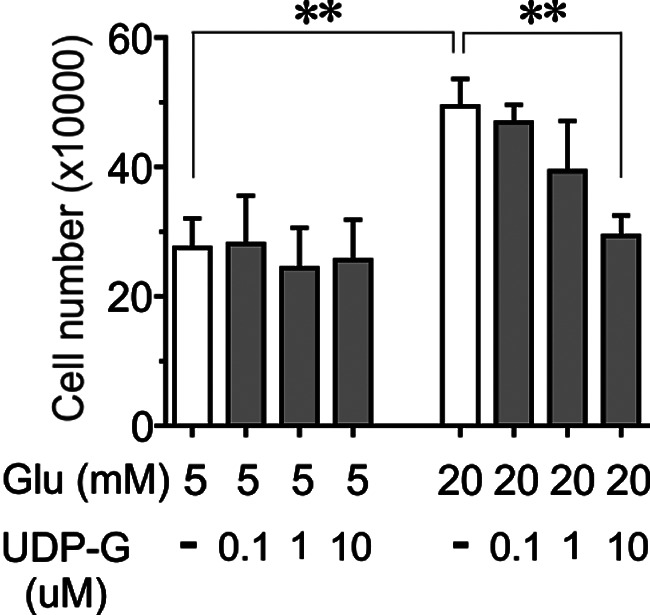
The effect of UDP-G on INS-1 832/13 cell proliferation. Data are shown as relative cell number counted after 24 h exposure to 5 or 20 mm glucose in the presence or absence of UDP-G (0.1, 1, 10 μm). Mean ± S.E. for n = 4 different experiments are shown. **, p < 0.005 (Student's t test).
Discussion
The findings reported here provide intriguing evidence of a role for the P2Y14 receptor in pancreatic β-cell function. Analysis of confocal microscopic images (roughly estimated surface/cytosolic expressional pattern) were indicative of cell surface expression of the P2Y14 in both human and mouse islets. Because pancreatic islet is a complex structure containing at least four different cell types, we also performed immunohistochemical analysis of P2Y14 expression in the commonly used β-cell line e.g. INS-1E cells, which indeed showed surface expression of P2Y14, confirming the observed confocal results in isolated human and mouse islets. Our functional data showed that the inhibitory effect of UDP-G, a selective agonist of P2Y14 (16), on GSIS is exerted via suppression of cellular cAMP generation. This effect of UDP-G seems to be in conjunction with a Gi protein because the blockade of Gi by PTX reversed the inhibitory impact of UDP-G on GSIS. Our results are thus in good agreement with a recent report showing that P2Y14 receptors signal through a Gi-coupled protein, thereby inhibiting adenylate cyclase activity resulting in a reduced cAMP generation (17), which is an important signaling molecule for GSIS (18, 19). Concerning pancreatic β-cells, it is well known that activation of GPCRs that signal through Gi proteins is associated with a reduced insulin secretory capacity (8, 20–22). In the current study, we show that activation of P2Y14 receptor by the specific agonist UDP-G is associated with a reduced β-cell functionality through the involvement of a PTX-sensitive Gi protein. This is in line with other studies demonstrating that GSIS can be negatively modulated by agents signaling through Gi protein, resulting in a reduced cAMP generation (16, 17, 20, 21). As a consequence, decreased cAMP levels negatively affect upstream signaling cascades such as PKA, which is of importance for a normal β-cell function (15, 18, 23, 24). A previous study showed very low (below detection) level of P2Y14 in pancreatic islets of ND and T2D by RNA-Seq (25). However, the detection level also depends on the abundance of protein and the robustness of methods as we could detect P2Y14 mRNA by qPCR, which is more sensitive compared with large-scale analytical methods such as RNA-Seq.
Our results also demonstrate that in isolated human islets, UDP-G dose-dependently inhibits GSIS. We have found that UDP-G did not significantly modify basal insulin release but completely inhibited insulin release at high glucose. Stimulatory levels of glucose regulate several elements of the β-cell secretory process including generation of cAMP, which is an important regulatory signaling molecule (18). Because P2Y14 is a PTX-sensitive Gi protein–coupled receptor, and because UDP-G does not activate any other P2Y-receptor subtypes (10, 11), the observed inhibitory action of UDP-G is most likely mediated via an inhibitory effect on cAMP generation via P2Y14 activation. The P2Y14-specific agonist UDP-G inhibited glucose-stimulated cAMP production and the effect on cAMP levels indicate that P2Y14 has a functional role in insulin-secreting β-cells. Therefore, our data strongly suggest that the observed UDP-G effect involves P2Y14 because specific knockdown of P2Y14 prevents the inhibitory impact of UDP-G on GSIS. In addition, the suppressive effect of UDP-G on GSIS seems to be mediated by involving the activation of Gi proteins, whose activation is known to be associated with β-cell repolarization followed by reduced exocytosis of insulin (21). Moreover, we found that PTX pretreatment also improved GSIS, indicating a tonic negative effect of Gi-coupled proteins on the GSIS under physiological conditions. Interestingly, in a previous study by Meister et al. (26), it was reported that P2Y14 ablation in mice is associated with a reduced insulin secretory response to an intraperitoneal glucose challenge where the authors concluded that P2Y14 activation positively modulates glucose-stimulated insulin releasing capacity of pancreatic β-cells. This is in contrast to our data where GSIS were markedly attenuated by P2Y14 activation and where P2Y14-KD was associated with diminished inhibitory effect of UDP-G on insulin secretion. The study performed by Meister et al. (26) was conducted with a P2Y14 gene-deficient mouse model, and caution should be taken when analyzing metabolic (in vivo) consequences of P2Y14 deletion in a whole animal, as epigenetic changes may contribute to a phenotype not necessarily associated with P2Y14 ablation in pancreatic β-cells.
Long-term culture experiments both at normal and at high glucose in the presence of UDP-G suggest a deteriorative action of UDP-G on β-cell function, as GSIS and β-cell viability were both reduced. The effects of UDP-G/P2Y14 were quantitatively similar in both ND and T2D islets, although diabetic islets displayed a decreased viability already at basal and physiological glucose levels. The cellular cAMP levels seem to be of great importance because addition of nonmetabolizable cAMP analog improves the cell viability during long-term culture of islets at high glucose.
Based on our data, we can conclude that the islet Gi-protein pathway is an important regulator of the insulin secretory mechanisms than previously anticipated. Imposed and persisting stimulation of a G protein–coupled receptors interacting with the inhibitory G protein i.e. Gi pathway results in an excessive reduction of β-cell cAMP generation, with subsequent inhibition of the insulin secretory signaling pathway and reduced β-cell viability (4–6, 22, 32) as it was also the case for P2Y14 activation in present study. Although the physiological roles of UDP-G in energy homeostasis, inflammation, and glucose metabolism are poorly understood, our experiments clearly demonstrate that UDP-G/P2Y14 has a detrimental effect on β-cell function, which may be important for the development of β-cell failure in T2D.
Experimental procedures
Animals
Female mice of the c57Bl/6j strain (Janvier Laboratory, Paris), weighing 25–30 g, kept at a standard pellet diet with tap water ad libitum, were used in our study. The experimental protocols were approved by the local human and animal welfare committee, at Uppsala and Lund, Sweden.
Chemicals
Collagenase (IV) was bought from Sigma-Aldrich, and fatty acid free BSA from Roche Applied Science. UDP-glucose (U-4625) was from Sigma-Aldrich. Polyclonal rabbit anti-P2Y14 (anti-GPR105) antibodies were purchased from Abcam (ab140896) and guinea pig–raised anti-insulin antibody (cat. no. 16049) was from Progen. Cy2-conjugated anti-mouse IgG (715-165-151) and Cy5-conjugated anti-guinea pig (cat. no. 706-225-148) were bought from Jackson ImmunoResearch Laboratories (West Grove, PA, USA). qPCR primers were bought from Applied Biosystems (see below for ID numbers). The insulin ELISA kit was from Mercodia (Sweden) and all other chemicals were from Merck AG, (Darmstadt, Germany) or Sigma-Aldrich.
Experimental buffer
The content of Krebs-Ringer bicarbonate buffer used for incubation of islets was (in mm): NaCl (120), KCl (4.7), CaCl2 (2.5), KH2PO4 (1.2), MgSO4 (1.2), HEPES (10), NaHCO3 (25), and 0.1% fatty acid–free BSA, with pH adjusted to 7.40. For the experiments with INS-1 cells, we used a HBSS buffer containing (in mm): NaCl (114), KCl (4.7), KH2PO4 (1.2), MgSO4 (1.16), HEPES (20), CaCl2 (2.5), NaHCO3 (25.5). The buffer pH was adjusted to 7.2 and thereafter supplemented with 0.2% fatty acid–free BSA.
Human pancreatic islets
Isolated human pancreatic islets from ND or type-2 diabetic (T2D) cadaveric donors were from both Prodo or some donors was obtained through a collaboration between Lund University Diabetes Centre (LUDC) and the Nordic Network for Clinical Islet Transplantation (Prof. Olle Korsgren, Uppsala University, Sweden). Donors were grouped as ND or T2D according to HbA1c levels (ND <6.2%, T2D >6.5% or a history of T2D). The ethical committees at Uppsala and Lund Universities, Sweden, approved the experimental procedures for human islets.
Isolation of mouse pancreatic islets
Mice were sacrificed by cervical dislocation. Preparation of pancreatic islets was then carried out by retrograde injection of 1.5 ml of a collagenase solution (1 mg/ml) via the bile-pancreatic duct as described previously (27). The islets were then handpicked (using a laboratory pipette) under stereomicroscope at room temperature.
INS-1 cell culture
Rat glucose-responding insulinoma cell line INS-1 832/13 was kindly provided by Dr. Chrisopher B. Newgard; Duke University, School of Medicine (28). The cells were seeded (350,000 cells/well) in a 24-well plate with 1 ml/well complete RPMI 1640 medium supplemented with 11.1 mm d-glucose and 10% FBS, 2% INS-1 supplement (18), 5 ml penicillin/streptomycin (10,000 units/10 mg/ml), and 10 mm Hepes (HyClone, Logan, UT, USA) (18). The cells were cultured in a humidified atmosphere with 5% CO2 at 37°C for 24 h (27). When the cells reached 90–95% confluence, they were washed with PBS and subjected to the various experimental procedures (see below).
P2Y14 knockdown by siRNA transfection
24 h prior to transfection, INS-1 (832/13) cells were seeded in a 24-well plate at 300,000 cells/ml/well in complete RPMI 1640 media without antibiotics. At 60% confluency, cells were transfected with 50 or 100 nm siRNA against P2Y14 (ID: MBS8228576-A, MBS8228576-B, and MBS8228576-C) (MyBio Source, San Diego, CA, USA) along with 1 µl of Lipofectamine RNAi Max transfection reagent in Opti-MEM media (Thermo Fisher Scientific) for control purposes, as described previously (27). After transfection, the media was replaced with complete RPMI 1640 media with antibiotics and the INS-1 832/13 cells were subjected to different experimental protocol.
cAMP measurements
INS-1 832/13 cells were incubated at 1 or 16.7 mm glucose in the presence or absence of UDP-G (1 μm). The incubation buffer also contained 3-isobutyl-1-methylxanthine (IBMX) (100 μm) to prevent the hydrolysis of cAMP by cellular phosphodiesterase (15, 18, 29). After incubation, the cells were washed with PBS and stored in RIPA buffer containing, HCl (100 mm) and IBMX (100 μm) for subsequent analysis of cAMP, which was measured using a direct cAMP ELISA kit (AD-900-066) (Enzo Life Sciences) according to the manufacturer's instructions. The protein concentrations in the cell lysates were measured by a BCA kit (Nr 23225; Thermo Fisher Scientific).
Measurement of insulin secretion
For functional studies, human islets or INS-1 832/13 cells (at 90% confluence in a 24-well plate) were pre-incubated for 30 min at 37°C in Krebs-Ringer bicarbonate buffer with 1 mm glucose (islets) or 120 min at 37°C in HBSS containing 2.8 mm glucose (INS-1 832/13 cells). After pre-incubation, the buffer was changed and the islets or INS-1 832/13 cells were incubated at the indicated test conditions for 60 min at 37° C. For islet experiments, incubation vials containing 12 islets in 1.0 ml of buffer solution were gassed with 95% O2/5% CO2 to obtain constant pH and oxygenation. All islet incubations were performed in an incubation box shaken at 30 cycles/min. The incubation volume for INS-1 832/13 cells (24-well plate) was 500 μl. Immediately after incubation, an aliquot of the medium was removed and frozen for subsequent assay of the released and cellular content of insulin. The insulin was measured using a Rat Insulin ELISA kit (cat. no. 10-1145; Mercodia, Uppsala, Sweden). The data were presented as the percentage of released insulin per total insulin per mg protein. The protein concentrations of the samples were measured by a BCA kit (Nr 23225; Thermo Fisher Scientific).
Confocal microscopy
P2Y14 protein expression in insulin-positive cells in human and mouse islets as well as INS-1 cells was determined by confocal microscopy using the Zen 2009 (Carl Zeiss, Oberkochen, Germany) software and rabbit polyclonal anti-GPR105 (P2Y14) antibodies at a 1:200 dilution. Handpicked islets were washed twice and fixed with 3% paraformaldehyde for 10 min, followed by permeabilization with 0.1% Triton X-100 for 15 min. The blocking solution contained 5% normal donkey serum in PBS and was used for 15 min. Primary antibodies against P2Y14 (1:100) and insulin (1:300) were diluted in blocking buffer and incubated overnight at 4°C. Immunoreactivity was quantified using fluorescently labeled secondary antibodies (1:100) and visualized by confocal microscopy (Carl Zeiss, Germany) by sequentially scanning at (excitation/emission) 488/505–530 nm (Cy2) and 633/>650 nm (Cy5) with the objective ×20, NA (0.6) (27).
Insulin staining was carried out using a primary guinea pig anti-insulin antibody (1:300) followed by incubation with fluorescent-conjugated secondary antibodies (1:100). Fluorescence was visualized with a Zeiss LSM510 confocal microscope by sequentially scanning at (excitation/emission) 488/505–530 nm (Cy2) and 633/>650 nm (Cy5) with the objective ×20, NA (0.6) (27). The normally low pinhole was adjusted to the signal intensity of the samples on the day of analysis and was kept constant during imaging for all the investigated islets. Colocalization analysis of islet P2Y14 with insulin (indicator of β-cells) in islets was performed using the ZEN2009 software based on Pearson's coefficient analysis, which recognizes the colocalized pair by comparison pixel by pixel intensity (19, 27, 30). The plasma membrane/cytosol ratio was calculated by mean intensity of plasma membrane to mean intensity in cytosol, as described previously (19, 27, 30).
Extraction of mRNA and quantitative RT-PCR
mRNA from human or mouse isolated islets was extracted using the RNeasy® Plus Mini Kit (Qiagen) following the manufacturer's instructions. The quantity of mRNA was measured by NanoDrop 1000 (NanoDrop Technologies). Thereafter, mRNA was reverse transcribed to cDNA using the RevertAid cDNA synthesis kit (Thermo Scientific). mRNA expression of genes of interest was assessed by quantitative RT-PCR performed on a ViiA System 7 (Applied Biosystems), using TaqMan® Reagents and comparative Ct (ΔΔCt) on a 384-well plate. The expression of human or mouse P2YR14 gene expression was then normalized to the reference gene GAPDH. Primer efficiency values (31) for the investigated genes were in the range of 1.85–2.15, and the template cDNAs were diluted in such a way that the quantified genes returned Ct values <30. The primer-ID numbers were human P2YR14 (Hn02101008_s1), mouse P2yr14 (Mn00690933_m1), rat P2yr14 (Rn02532502_s1), human GAPDH (Hn00591943_m1), mouse Gapdh (Mn01775763_g1), and rat β-actin (Rn00667869_m1).
Measurement of cellular reductive capacity and apoptosis
Cellular reductive capacity of ND or T2D islets was measured when the islets were subjected to 5 or 20 mm glucose for 72 h in the absence or presence of test agents. Thereafter the islets were dispersed into single cells and the measurement of reductive capacity was performed using the MTS reagent kit (cat. no. G3580) according to the manufacturer's instructions (Promega). Apoptosis was measured with the Cell Death Kit (Roche Diagnostics), which quantifies the appearance of cytosolic nucleosomes in both cultured human islet homogenates and cultured INS-1 832/13 homogenates as reported previously (19).
Cell proliferation by counting
INS-1 832/13 cells were seeded at 20,000 cells/well into 48-well plates in RPMI 1640 medium (Life Technologies) with GlutaMaxTM (Gibco) containing 11.1 mmol/liter glucose and supplemented with 15% fetal calf serum, 50 μg/liter streptomycin (Gibco), 75 mg/liter penicillin sulfate (Gibco), and 5 μl/ml β-mercaptoethanol (Sigma) and cultured at 37°C with 5% ambient CO2 for 18 h. Then the medium was changed to the same culture medium with 5 or 20 mm glucose in the presence or absence of UDP-G and the cells were cultured for additional 24 h. Thereafter the cells (in individual wells) were harvested by trypsination and counted using a Bürcker chamber as described previously (32).
Statistics
Results are expressed as mean ± S.E., and probability levels of random differences were determined by Student's t test (comparisons between two groups) or where applicable (comparisons between three or more groups) by analysis of variance followed by Tukey-Kramer's multiple comparisons test.
Data availability
All data are contained within the manuscript.
Acknowledgments
We thank Britt-Marie Nilsson and Anna Maria Ramsay for skilled technical assistance.
Author contributions—F. P. and A. S. conceptualization; F. P., S. A., G. V., I. M. A., P. D., and A. S. data curation; F. P., S. A., G. V., I. M. A., P. D., and A. S. formal analysis; F. P., S. A., P. D., and A. S., writing-original draft; F. P., S. A., P. D., and A. S. writing-review and editing; A. S. funding acquisition; P. D. and A. S. supervision.
Funding and additional information—This work was supported by the Swedish Research Council; Mats Paulsson Foundation Grant 2017-08 (to A. S.), Forget Foundation Grant 2019-01353 (to A. S.), and Swedish Diabetes Foundation Grant 2018-363 (to A. S.); and Lund University Diabetes Centre Grant LU2019 (to A. S.) (LUDC/EXODIAB/LUDC-IRC).
Conflict of interest—The authors declare that they have no conflicts of interest with the contents of this article.
- GSIS
- glucose-stimulated insulin secretion
- UDP-G
- UDP-glucose
- PTX
- pertussis toxin
- ND
- nondiabetic
- T2D
- type-2 diabetes
- Bt2-cAMP
- dibutyryl cAMP.
References
- 1. Yamazaki H., Zawalich K. C., and Zawalich W. S. (2010) Physiologic implications of phosphoinositides and phospholipase C in the regulation of insulin secretion. J. Nutr. Sci. Vitaminol. 56, 1–8 10.3177/jnsv.56.1 [DOI] [PubMed] [Google Scholar]
- 2. Salehi A., Qader S. S., Grapengiesser E., and Hellman B. (2005) Inhibition of purinoceptors amplifies glucose-stimulated insulin release with removal of its pulsatility. Diabetes 54, 2126–2131 10.2337/diabetes.54.7.2126 [DOI] [PubMed] [Google Scholar]
- 3. Burnstock G. (2014) Purinergic signalling in endocrine organs. Purinergic Signal. 10, 189–231 10.1007/s11302-013-9396-x [DOI] [PMC free article] [PubMed] [Google Scholar]
- 4. Parandeh F., Abaraviciene S. M., Amisten S., Erlinge D., and Salehi A. (2008) Uridine diphosphate (UDP) stimulates insulin secretion by activation of P2Y6 receptors. Biochem. Biophys. Res. Commun. 370, 499–503 10.1016/j.bbrc.2008.03.119 [DOI] [PubMed] [Google Scholar]
- 5. Salehi A., Parandeh F., Fredholm B. B., Grapengiesser E., and Hellman B. (2009) Absence of adenosine A1 receptors unmasks pulses of insulin release and prolongs those of glucagon and somatostatin. Life Sci. 85, 470–476 10.1016/j.lfs.2009.08.001 [DOI] [PubMed] [Google Scholar]
- 6. Tan C., Salehi A., Svensson S., Olde B., and Erlinge D. (2010) ADP receptor P2Y(13) induce apoptosis in pancreatic beta-cells. Cell. Mol. Life Sci. 67, 445–453 10.1007/s00018-009-0191-3 [DOI] [PMC free article] [PubMed] [Google Scholar]
- 7. Grapengiesser E., Salehi A., Qader S. S., and Hellman B. (2006) Glucose induces glucagon release pulses antisynchronous with insulin and sensitive to purinoceptor inhibition. Endocrinology 147, 3472–3477 10.1210/en.2005-1431 [DOI] [PubMed] [Google Scholar]
- 8. Novak I. (2008) Purinergic receptors in the endocrine and exocrine pancreas. Purinergic Signal. 4, 237–253 10.1007/s11302-007-9087-6 [DOI] [PMC free article] [PubMed] [Google Scholar]
- 9. Ralevic V., Burrell S., Kingdom J., and Burnstock G. (1997) Characterization of P2 receptors for purine and pyrimidine nucleotides in human placental cotyledons. Br. J. Pharmacol. 121, 1121–1126 10.1038/sj.bjp.0701262 [DOI] [PMC free article] [PubMed] [Google Scholar]
- 10. Lee B. C., Cheng T., Adams G. B., Attar E. C., Miura N., Lee S. B., Saito Y., Olszak I., Dombkowski D., Olson D. P., Hancock J., Choi P. S., Haber D. A., Luster A. D., and Scadden D. T. (2003) P2Y-like receptor, GPR105 (P2Y14), identifies and mediates chemotaxis of bone-marrow hematopoietic stem cells. Genes Dev. 17, 1592–1604 10.1101/gad.1071503 [DOI] [PMC free article] [PubMed] [Google Scholar]
- 11. Abbracchio M. P., Boeynaems J. M., Barnard E. A., Boyer J. L., Kennedy C., Miras-Portugal M. T., King B. F., Gachet C., Jacobson K. A., Weisman G. A., and Burnstock G. (2003) Characterization of the UDP-glucose receptor (re-named here the P2Y14 receptor) adds diversity to the P2Y receptor family. Trends Pharmacol. Sci. 24, 52–55 10.1016/S0165-6147(02)00038-X [DOI] [PMC free article] [PubMed] [Google Scholar]
- 12. Adeva-Andany M. M., Pérez-Felpete N., Fernández-Fernández C., Donapetry-García C., and Pazos-García C. (2016) Liver glucose metabolism in humans. Biosci. Rep. 36, e00416 10.1042/BSR20160385 [DOI] [PMC free article] [PubMed] [Google Scholar]
- 13. Lazarowski E. (2006) Regulated release of nucleotides and UDP sugars from astrocytoma cells. Novartis Found. Symp. 276, 73–84 [PubMed] [Google Scholar]
- 14. Harden T. K., Sesma J. I., Fricks I. P., and Lazarowski E. R. (2010) Signalling and pharmacological properties of the P2Y receptor. Acta Physiol. 199, 149–160 10.1111/j.1748-1716.2010.02116.x [DOI] [PMC free article] [PubMed] [Google Scholar]
- 15. Amisten S., Mohammad Al-Amily I., Soni A., Hawkes R., Atanes P., Persaud S. J., Rorsman P., and Salehi A. (2017) Anti-diabetic action of all-trans retinoic acid and the orphan G protein coupled receptor GPRC5C in pancreatic β-cells. Endocr. J. 64, 325–338 10.1507/endocrj.EJ16-0338 [DOI] [PubMed] [Google Scholar]
- 16. Das A., Ko H., Burianek L. E., Barrett M. O., Harden T. K., and Jacobson K. A. (2010) Human P2Y(14) receptor agonists: truncation of the hexose moiety of uridine-5'-diphosphoglucose and its replacement with alkyl and aryl groups. J. Med. Chem. 53, 471–480 10.1021/jm901432g [DOI] [PMC free article] [PubMed] [Google Scholar]
- 17. von Kügelgen I., and Hoffmann K. (2016) Pharmacology and structure of P2Y receptors. Neuropharmacology 104, 50–61 10.1016/j.neuropharm.2015.10.030 [DOI] [PubMed] [Google Scholar]
- 18. Dunér P., Al-Amily I. M., Soni A., Asplund O., Safi F., Storm P., Groop L., Amisten S., and Salehi A. (2016) Adhesion G protein-coupled receptor G1 (ADGRG1/GPR56) and pancreatic β-cell function. J. Clin. Endocrinol. Metab. 101, 4637–4645 10.1210/jc.2016-1884 [DOI] [PubMed] [Google Scholar]
- 19. Zhang E., Mohammed Al-Amily I., Mohammed S., Luan C., Asplund O., Ahmed M., Ye Y., Ben-Hail D., Soni A., Vishnu N., Bompada P., De Marinis Y., Groop L., Shoshan-Barmatz V., Renstrom E., et al. (2019) Preserving insulin secretion in diabetes by inhibiting VDAC1 overexpression and surface translocation in β cells. Cell Metab. 29, 64–77e66 10.1016/j.cmet.2018.09.008 [DOI] [PMC free article] [PubMed] [Google Scholar]
- 20. Amisten S., Atanes P., Hawkes R., Ruz-Maldonado I., Liu B., Parandeh F., Zhao M., Huang G. C., Salehi A., and Persaud S. J. (2017) A comparative analysis of human and mouse islet G-protein coupled receptor expression. Sci. Rep. 7, 46600 10.1038/srep46600 [DOI] [PMC free article] [PubMed] [Google Scholar]
- 21. Sharp G. W. (1996) Mechanisms of inhibition of insulin release. Am. J. Physiol. 271, C1781–C1799 10.1152/ajpcell.1996.271.6.C1781 [DOI] [PubMed] [Google Scholar]
- 22. Atanes P., Ruz-Maldonado I., Hawkes R., Liu B., Zhao M., Huang G. C., Al-Amily I. M., Salehi A., Amisten S., and Persaud S. J. (2018) Defining G protein-coupled receptor peptide ligand expressomes and signalomes in human and mouse islets. Cell. Mol. Life Sci. 75, 3039–3050 10.1007/s00018-018-2778-z [DOI] [PMC free article] [PubMed] [Google Scholar]
- 23. Jimenez-Feltstrom J., Lundquist I., and Salehi A. (2005) Glucose stimulates the expression and activities of nitric oxide synthases in incubated rat islets: An effect counteracted by GLP-1 through the cyclic AMP/PKA pathway. Cell Tissue Res. 319, 221–230 10.1007/s00441-004-1013-4 [DOI] [PubMed] [Google Scholar]
- 24. Amisten S., Duner P., Asplund O., Mohammed Al-Amily I., Groop L., and Salehi A. (2018) Activation of imidazoline receptor I2, and improved pancreatic β-cell function in human islets. J. Diabetes Complications 32, 813–818 10.1016/j.jdiacomp.2018.06.010 [DOI] [PubMed] [Google Scholar]
- 25. Segerstolpe A., Palasantza A., Eliasson P., Andersson E. M., Andréasson A. C., Sun X., Picelli S., Sabirsh A., Clausen M., Bjursell M. K., Smith D. M., Kasper M., Ämmälä C., and Sandberg R. (2016) Single-cell transcriptome profiling of human pancreatic islets in health and type 2 diabetes. Cell Metab. 24, 593–607 10.1016/j.cmet.2016.08.020 [DOI] [PMC free article] [PubMed] [Google Scholar]
- 26. Meister J., Le Duc D., Ricken A., Burkhardt R., Thiery J., Pfannkuche H., Polte T., Grosse J., Schöneberg T., and Schulz A. (2014) The G protein-coupled receptor P2Y14 influences insulin release and smooth muscle function in mice. J. Biol. Chem. 289, 23353–23366 10.1074/jbc.M114.580803 [DOI] [PMC free article] [PubMed] [Google Scholar]
- 27. Al-Amily I. M., Duner P., Groop L., and Salehi A. (2019) The functional impact of G protein-coupled receptor 142 (Gpr142) on pancreatic β-cell in rodent. Pflugers Arch. 471, 633–645 10.1007/s00424-019-02262-7 [DOI] [PMC free article] [PubMed] [Google Scholar]
- 28. Hohmeier H. E., and Newgard C. B. (2004) Cell lines derived from pancreatic islets. Mol. Cell Endocrinol. 228, 121–128 10.1016/j.mce.2004.04.017 [DOI] [PubMed] [Google Scholar]
- 29. Kumar R., Balhuizen A., Amisten S., Lundquist I., and Salehi A. (2011) Insulinotropic and antidiabetic effects of 17β-estradiol and the GPR30 agonist G-1 on human pancreatic islets. Endocrinology 152, 2568–2579 10.1210/en.2010-1361 [DOI] [PubMed] [Google Scholar]
- 30. Costes S. V., Daelemans D., Cho E. H., Dobbin Z., Pavlakis G., and Lockett S. (2004) Automatic and quantitative measurement of protein-protein colocalization in live cells. Biophys. J. 86, 3993–4003 10.1529/biophysj.103.038422 [DOI] [PMC free article] [PubMed] [Google Scholar]
- 31. Pfaffl M. W. (2001) A new mathematical model for relative quantification in real-time RT-PCR. Nucleic Acids Res. 29, e45 10.1093/nar/29.9.e45 [DOI] [PMC free article] [PubMed] [Google Scholar]
- 32. Soni A., Amisten S., Rorsman P., and Salehi A. (2013) GPRC5B a putative glutamate-receptor candidate is negative modulator of insulin secretion. Biochem. Biophys. Res. Commun. 441, 643–648 10.1016/j.bbrc.2013.10.099 [DOI] [PubMed] [Google Scholar]
Associated Data
This section collects any data citations, data availability statements, or supplementary materials included in this article.
Data Availability Statement
All data are contained within the manuscript.


