Abstract
Muscle atrophy is regulated by the balance between protein degradation and synthesis. FOXO1, a transcription factor, helps to determine this balance by activating pro-atrophic gene transcription when present in muscle fiber nuclei. Foxo1 nuclear efflux is promoted by AKT-mediated Foxo1 phosphorylation, eliminating FOXO1's atrophy-promoting effect. AKT activation can be promoted by insulin-like growth factor 1 (IGF1) or insulin via a pathway including IGF1 or insulin, phosphatidylinositol 3-kinase, and AKT. We used confocal fluorescence time-lapse imaging of FOXO1–GFP in adult isolated living muscle fibers maintained in culture to explore the effects of IGF1 and insulin on FOXO1–GFP nuclear efflux with and without pharmacological inhibitors. We observed that although AKT inhibitor blocks the IGF1- or insulin-induced effect on FOXO1 nuclear efflux, phosphatidylinositol 3-kinase inhibitors, which we show to be effective in these fibers, do not. We also found that inhibition of the protein kinase ACK1 or ATM contributes to the suppression of FOXO1 nuclear efflux after IGF1. These results indicate a novel pathway that has been unexplored in the IGF1- or insulin-induced regulation of FOXO1 and present information useful both for therapeutic interventions for muscle atrophy and for further investigative areas into insulin insensitivity and type 2 diabetes.
Keywords: Foxo1, skeletal muscle, nuclear translocation, IGF-1, insulin, Akt, FOXO, insulin-like growth factor (IGF), Akt PKB, protein phosphorylation
Skeletal muscle is essential for all voluntary and reflex movement and is one of the primary insulin sensitive tissues. Indeed, skeletal muscle insulin insensitivity is implicated as a major marker for the onset of type 2 diabetes (1). Loss of muscle mass itself is associated with aging (2–4) or disuse (5, 6), from myopathies and muscular dystrophy, and from systemic disorders such as diabetes (7), cancer (8, 9), and heart failure (10), where it is associated with poor prognosis for these diseases (8, 9, 11). Additionally, loss of muscle mass and muscle strength leads to a lack of mobility and difficulty in breathing, which cause a deterioration in quality of life and increased likelihood of morbidity (12). Muscle atrophy, or loss of muscle mass, is characterized by an excess of protein degradation relative to protein synthesis in muscle. Muscle atrophy is regulated at the cellular level by several signaling pathways that modulate the balance between protein synthesis and degradation. Here we investigate a major signaling pathway involved in muscle atrophy that is regulated by both insulin and IGF1.
Both insulin and IGF1 play large and important roles in skeletal muscle. Interaction with insulin, IGF1, or hybrid insulin–IGF1 receptors is key in the growth, differentiation, and homeostasis of skeletal muscle (13). Additionally, inactivation of insulin and IGF1 receptors in skeletal muscle has been shown to cause type 2 diabetes in mice (14). These growth hormones also play roles in preventing muscle atrophy. A major downstream target of insulin and IGF1 is FOXO1, a transcription factor involved in activating pro-atrophic gene transcription.
The FOXO (forkhead box class O) family is a conserved transcription factor family involved in various cellular roles including cell proliferation and cell survival (15). Four isoforms of FOXO exist in humans: FOXO1, FOXO3A, FOXO4, and FOXO6, and all are expressed in skeletal muscle fibers except FOXO6 (15). Of these, FOXO1 and FOXO3A are implicated as critical for muscle atrophy because the two isoforms promote transcription of E3 ubiquitin ligases, MURF-1, and MAFbx/ATROGIN1, which are responsible for protein degradation via the proteasome and are highly expressed during muscle atrophy (16–19). Additionally, up-regulation of either FOXO1 or FOXO3A individually is capable of activating muscle atrophy (18, 20). Here our study focuses on the FOXO1 isoform.
The phosphorylation status of FOXO1 dictates the localization of FOXO1 in either nuclei or cytoplasm of myofibers and thus determines the transcriptional activity of FOXO1. AKT (protein kinase B) is a serine/threonine specific protein kinase that, when activated, phosphorylates FOXO1 on three conserved sites (Thr24, Ser256, and Ser319) (21) in both cytoplasm and nuclei (22). This phosphorylation causes the FOXO1 nuclear localization signal to be obscured, thus preventing nuclear entry of FOXO1. AKT phosphorylation of FOXO1 within nuclei results in FOXO1 unbinding DNA (23, 24), and with recruitment of chaperone protein 14-3-3 and CRM1 and RAN (24), the nuclear export signal (NES) is exposed, and FOXO1 is transported out of the nuclei (25, 26). Upon dephosphorylation of FOXO1 (27, 28), the nuclear localization signal is exposed, and FOXO1 enters myofibers nuclei, binds DNA, and induces transcription of pro-atrophic genes (21). Thus, the nuclear–cytoplasmic balance of FOXO1 is important for controlling protein breakdown and preventing muscle atrophy (29).
The canonical pathway for activating AKT kinase activity by IGF1/insulin begins with IGF1/insulin activating the IGF1/insulin receptors, causing receptor autophosphorylation and phosphorylation of Insulin Receptor Substrate 1 (IRS1), resulting in activation of Phosphatidylinositol (3,4,5)-trisphosphate (PIP3) and the consequent production of PIP3 in the plasma membrane. AKT binds to plasma membrane PIP3 together with Pyruvate Dehydrogenase Kinase 1 (PDK1), which phosphorylates AKT at Thr308, and mechanistic target of rapamycin kinase complex 2 (MTORC2), which phosphorylates AKT at Ser473, resulting in full AKT kinase activation. Among many additional actions, activated AKT phosphorylates FOXO1, promoting net loss of Foxo1 from muscle fiber nuclei in response to IGF1 and/or insulin.
Using FOXO1–GFP expressed in primary cultured living adult skeletal muscle fibers studied by time-lapse fluorescence confocal imaging, we first show that AKT, but not PI3K, is necessary for the rapid and pronounced nuclear efflux of FOXO1–GFP in response to either IGF1 or insulin in adult muscle fibers. We then examine two PI3K-independent kinases: ACK1 (30) and ATM (31), for their possible roles in the largely PI3K-independent nuclear efflux of FOXO1 in response to IGF1 or insulin. Our novel results demonstrate that PI3K-independent pathways may play an important role in the response of skeletal muscle to IGF1/insulin and thus have major implications for insulin insensitivity, type 2 diabetes, and suppression of FOXO1-mediated muscle protein breakdown and consequent muscle atrophy.
Results
Inhibition of AKT increases nuclear Foxo1 under control conditions
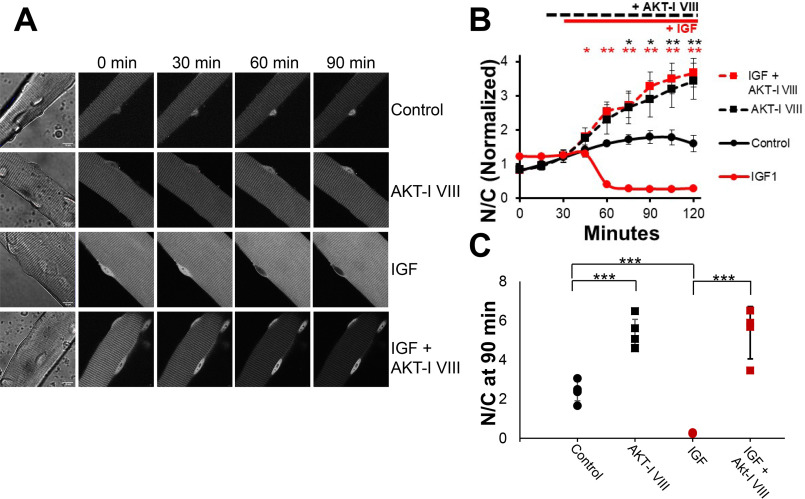
In muscle fibers, changes in FOXO1 nuclear/cytoplasmic distribution reflect small differences in relatively large nuclear influx and nuclear efflux of FOXO1 (22, 27). As previously described (27), under our control condition of serum-free medium with no added drugs, hormones, or growth factors, FOXO1–GFP nuclear fluorescence remained roughly constant (indicating flux balance) or increased slightly (indicating slight excess of influx over efflux) over the ≤2-h course of observation (Fig. 1, A, top row, and B, black circles and black line). FOXO1 nucleocytoplasmic distribution is regulated by FOXO1 phosphorylation stratus, and AKT is a major kinase phosphorylating FOXO1. Consistent with AKT regulation of Foxo1 distribution, adding AKT-I VIII (1 μm), an inhibitor of both AKT1 and AKT2, shortly after the 15-min time point caused a robust increase in nuclear FOXO1–GFP fluorescence (Fig. 1, A, second row, and B, black squares and black line) compared with the control (above), confirming the involvement of AKT in promoting FOXO1 nuclear exclusion under control conditions in our adult fiber culture system.
Figure 1.
Inhibition of AKT promotes net nuclear accumulation of FOXO1–GFP under control conditions and completely blocks the dramatic IGF1-induced net nuclear efflux of FOXO1–GFP. A, representative fluorescent images of FOXO1–GFP in skeletal muscle fibers under different conditions. The first column shows the fiber under transmitted light conditions and the 10-μm scale bar that applies to all images in the figure. Each row shows the same fiber at different times (top labels) during the experiment and illustrates a different experimental condition (right side labels). Image intensity here and in Fig. 2 was decreased at later times to avoid pixel saturation in the nuclei of FOXO1–GFP in samples with AKT inhibition. Note that this has no effect on N/C values because it applies to the entire image. B, time course experiment analysis of FOXO1–GFP N/C levels (average of N/C values from images shown in A, plus others, normalized to the average N/C before compounds were added) in the presence or absence of select compounds. For this and all further time-course graphs, significance is denoted as follows: *, P < 0.05; **, P < 0.01. Red asterisks correspond to red symbols, and black asterisks correspond to black symbols. There were no added compounds in control (A, top row; B, solid black line). AKT inhibitor VIII was added at 15 min (A, second and fourth rows; B, dashed lines). IGF1 was added at 30 min (A, third and fourth rows; B, red lines). C, N/C (not normalized) at the 90-min time point for each condition. Significance is denoted as follows: *, P < 0.05; **, P < 0.02; ***, P < 0.01 for this and all further 90-min time point graphs.
Inhibition of AKT prevents the dramatic FOXO1 nuclear efflux caused by application of IGF1
Adding only IGF1 (13 nm) shortly after the 30-min time point to fibers in another compartment of the same culture dish resulted in a robust rapid and almost complete loss of nuclear FOXO1–GFP (Fig. 1, A, third row, and B, red circles and red line), consistent with marked activation of FOXO1–GFP nuclear efflux as we have previously reported (13, 27, 36). However, when the same addition of IGF1 to another compartment was preceded by addition of AKT-I VIII, the loss of nuclear FOXO1–GFP caused by IGF1 addition was completely eliminated (Fig. 1, A, bottom row, and B, red squares and red line), and the time course was essentially the same as that observed when only AKT-I VIII was added by itself, without any IGF1 (Fig. 1B, black line). Thus, the entire effect of IGF1 on FOXO1–GFP nuclear efflux was mediated by AKT.
The values of the nuclear/cytoplasmic ratio of FOXO1–GFP (N/C, not normalized) at 90 min clearly demonstrate the results of the different conditions on nuclear FOXO1. The 90-min time point used here was the point 60 min after IGF1 addition. Control fibers have a “final” N/C of ∼2 (Fig. 1C, black circles). Fibers treated with the AKT-I VIII in the absence or presence of IGF1 have a higher FOXO1 N/C compared with control and are nearly identical to one another (Fig. 1C, black and red squares). Finally, IGF treatment without any inhibitor results in a FOXO1 N/C close to 0 (Fig. 1C, red circles). Thus, inhibiting AKT fully prevented any effect of IGF1 on FOXO1–GFP nucleocytoplasmic distribution.
Inhibition of PI3K increases nuclear FOXO1 under control conditions
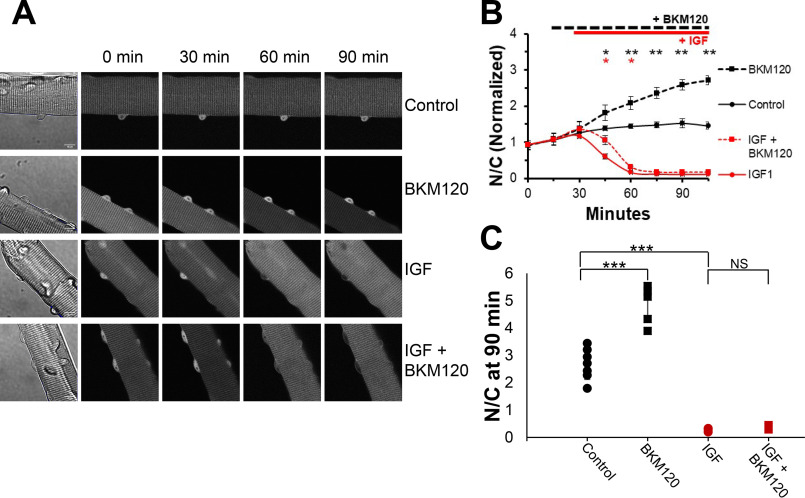
The lipid kinase PI3K is an intermediate player in the canonical signaling pathway (IGF1 → PI3K → AKT FOXO1) leading from IGF1 application to AKT activation, FOXO1 phosphorylation, and FOXO1 nuclear efflux, which corresponds to a decrease (i.e. inhibition) of FOXO1 transcriptional activity in the muscle fiber nuclei. We thus sought to determine the involvement of PI3K in the FOXO1 nucleocytoplasmic movements examined here. Fibers studied under the same control conditions as in Fig. 1 again showed a gradual increase and stabilization of nuclear FOXO1–GFP (Fig. 2, A, top row, and B, black circles and black line). As was the case for inhibition of AKT under control conditions in Fig. 1B, inhibition of PI3K under control conditions with BKM120 (10 μm), a novel PI3K inhibitor, drives FOXO1–GFP into fiber nuclei (Fig. 2, A, second row, and B, black squares and black line), again reaching considerably higher levels than seen in control.
Figure 2.
Inhibition of PI3K promotes net nuclear accumulation of FOXO1–GFP under control conditions but does not block the marked IGF1-induced net nuclear efflux of FOXO1–GFP. A, representative fluorescent images of FOXO1–GFP in skeletal muscle fibers under different conditions. The first column shows the fiber under transmitted light conditions and contains a 10-μm scale bar that applies to all images in the figure. Each row shows the same fiber at different times (top labels) during the experiment and illustrates a different experimental condition (right side labels). B, time course experiment analysis of FOXO1–GFP N/C levels (average of N/C values from images shown in A, plus others, normalized to the average N/C before compounds were added) in the presence or absence of select compounds. C, N/C (not normalized) at the 90-min time point for each condition. There were no added compounds in control (A, top row; B, solid black line). The PI3K inhibitor BKM120 was added at 15 min (A, second and fourth rows; B, dashed lines). IGF1 was added at 30 min (A, third and fourth rows; B, red lines). NS, not significant.
The N/C (not normalized) values at time 90 min clearly demonstrate these results. Control fibers respond as in the previous experiment (Fig. 2C, black circles), and treatment with the BKM120 alone causes a final N/C higher than control (Fig. 2C, black squares). This marked rise in nuclear FOXO1–GFP compared with control indicates the efficacy of the PI3K inhibitor in our experimental context.
Inhibition of PI3K does not block the dramatic effect of IGF1 on FOXO1 nuclear efflux
We next examined whether blocking PI3K was sufficient to block the dramatic effect of IGF on promoting FOXO1 nuclear efflux. As in Fig. 1, adding IGF1 alone shortly after the 30-min time point again resulted in a nearly complete loss of FOXO1–GFP in nuclei (Fig. 2, A, third row, and B, red circles and red line). Unexpectedly, when the IGF1 addition was preceded by the addition of PI3K inhibitor BKM120, FOXO1–GFP in nuclei still dropped rapidly (Fig. 2, A, bottom row, and B, red squares and red line), following a similar time course as when fibers were treated with IGF1 alone, without the inhibitor (Fig. 2B, red line). This result was in complete contrast to the results from the AKT inhibitor experiments (Figs. 1A, bottom row, and 1B, red line), where application of Akt inhibitor completely eliminated the effects of IGF1 on FOXO1–GFP nucleocytoplasmic distribution. However, the IGF1-induced decrease of nuclear FOXO1–GFP in the presence of BKM120 was slightly delayed compared with the response in the absence of the inhibitor, consistent with a small contribution of PI3K to the observed IGF1 induced FOXO1–GFP nuclear efflux.
The N/C values (not normalized) at time 90 min clearly demonstrate these results. Treatment with IGF1 alone results in an N/C close to 0 (Fig. 2C, red circles), and similarly, treatment with both the PI3K inhibitor and IGF1 also leads to an N/C close to 0 (Fig. 2C, red squares). Here, PI3K inhibition caused nearly no change in the effect of IGF1 on FOXO1–GFP nucleocytoplasmic distribution.
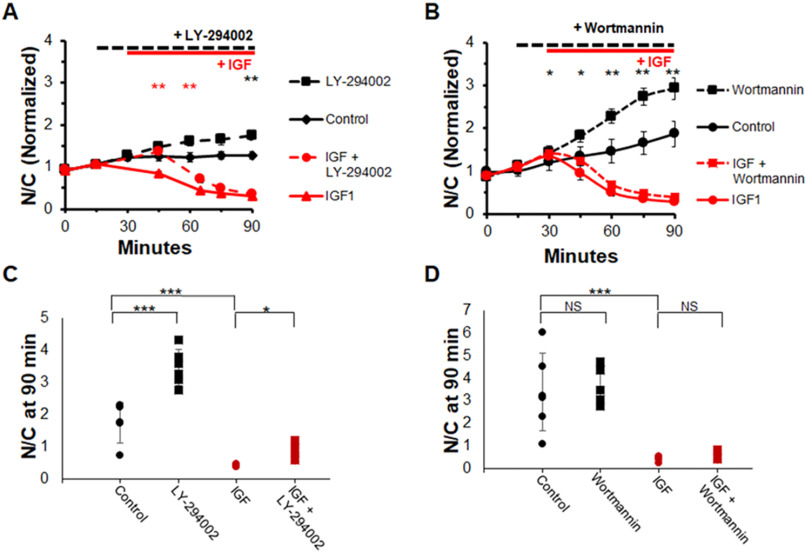
To ensure that this was not a particular effect of the PI3K inhibitor BKM120, we utilized two other common inhibitors of PI3K: wortmannin (10 μm) and LY294002 (25 μm). The results from these experiments (Fig. 3) mirrored results with BKM120 (Fig. 2). The nuclear FOXO1–GFP of fibers under control conditions remained approximately constant or increased gradually over the course of the experiment (Fig. 3, A and B, black circles and black line). Use of either PI3K inhibitor, LY294002 or wortmannin, caused a more rapid increase of nuclear FOXO1–GFP (Fig. 3, A and B, black squares and black line) compared with control. Adding IGF1 alone caused a rapid loss of FOXO1–GFP in myofiber nuclei (Fig. 3, A and B, red circles and red line). With the addition of either wortmannin or LY294002 prior to IGF1 addition, the effect of IGF1 addition was nearly unaffected (Fig. 3, A and B, red squares and red line) and the nuclear FOXO1–GFP fluorescence over time looked almost identical to the IGF1-only N/C ratio (Fig. 3, A and B, red circles and red line). LY294002, but not wortmannin, caused a slight but significant delay in the response to IGF1. A snapshot of individual fiber N/C values at 90 min also demonstrate these results. These results demonstrate that PI3K is not necessary for the effect of IGF1 on promoting rapid and nearly complete FOXO1 nuclear exclusion.
Figure 3.
Inhibition of PI3K with alternate inhibitors does not block IGF1 effect on FOXO1 localization. A and B, time course experiment analysis of FOXO1–GFP N/C levels in the presence or absence of select compounds. C and D, N/C (not normalized) at 90-min time point for each condition. There were no added compounds in control (A and B, solid black line; C and D, black circles). PI3K inhibitor, LY-294002 or wortmannin, was added at 15 min (A and B, dashed lines; C and D, black and red squares). IGF1 was added at 30 min (A and B, red lines; C and D, red circles and squares). NS, not significant.
AKT inhibition blocks insulin effect on FOXO1 nuclear efflux, whereas PI3K inhibition does not
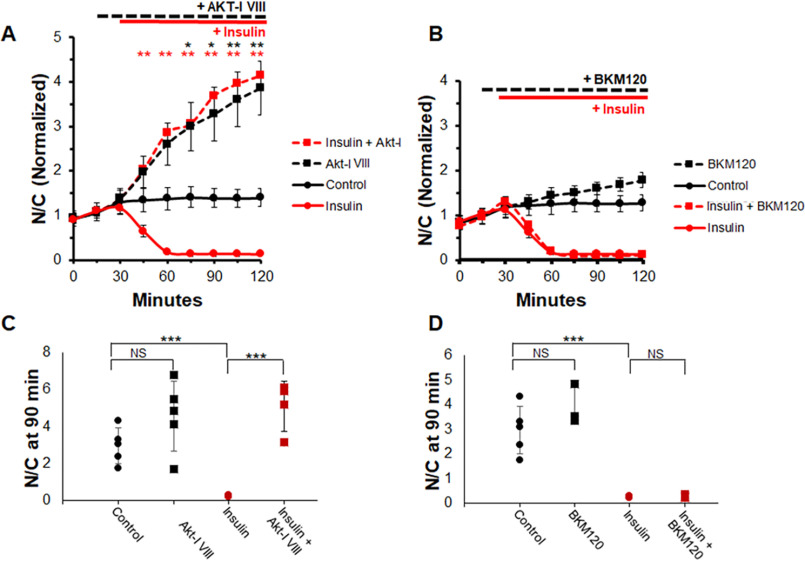
Similarly, we tested whether the effect of insulin on FOXO1 localization could be blocked through AKT or PI3K inhibition because insulin is also believed to activate the same canonical PI3K/AKT pathway. As with IGF1, adding insulin alone shortly after the 30-min time point results in a dramatic decrease of nuclear FOXO1–GFP (Fig. 4A, red circles and solid red line). AKT inhibition with AKT-I VIII either followed or not followed by the addition of insulin results in a significant and robust increase in nuclear FOXO1–GFP and entirely abolishes the FOXO1–GFP response to insulin (Fig. 4A, dashed lines). However, like adding IGF1, adding insulin after the addition of PI3K inhibitor BKM120 still leads to FOXO1–GFP decreasing rapidly in myofiber nuclei (Fig. 4B, red squares and dashed red line).
Figure 4.
AKT inhibition blocks insulin effect on FOXO1 nuclear efflux, whereas PI3K inhibition does not. Shown is a time course experiment analysis of FOXO1–GFP N/C levels and N/C bar graph (not normalized) at 90-min time point in the presence or absence of AKT inhibitor (A) or PI3K inhibitor (B) with or without insulin. A and C, control (A, solid black line; C, black circles) have no added compounds. AKT-I VIII was added at 15 min (A, dashed lines; C, squares). IGF was added at 30 min (A, red lines; C, red circles and squares). PI3K inhibitor BKM120 was added at 15 min (B, dashed lines; D, squares). Insulin was added at 30 min (B, red lines; D, red circles and squares). NS, not significant.
These results are reflected by the N/C values collected at 90 min. Treatment with insulin alone results in a N/C value close to 0 (Fig. 4, C and D, red circles). Treatment with AKT-I VIII (Fig. 4C, black or red squares) results in higher N/C values compared with control in both the presence and the absence of insulin. Note that an individual fiber had a particularly low response to AKT-I VIII treatment in the absence of insulin. This kind of variability occurs frequently in myofibers, as we discuss in a previous paper (32), and is commonly a result of low starting FOXO1–GFP nuclear content. Removing this fiber results in significant difference between control and inhibitor-treated fiber N/C values with a P value less than 0.02 (graph without fiber not shown). Treatment with the PI3K inhibitor followed by insulin leads to an N/C level close to 0 (Fig. 4D, red squares). These observations suggest that the signal from insulin, like IGF, is relayed to AKT without involvement of PI3K.
PI3K inhibition does not prevent IGF1-induced AKT phosphorylation
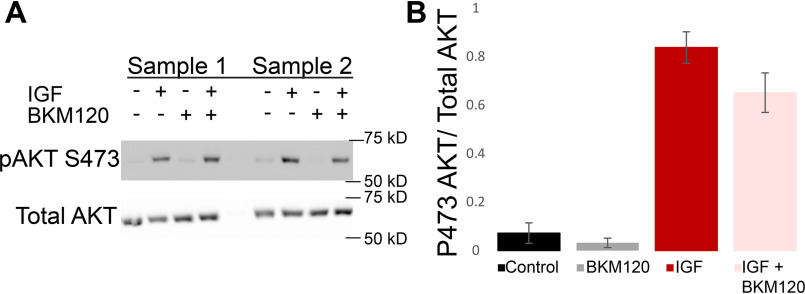
The kinase activity of AKT is partially activated by phosphorylation of threonine 308, and full activation necessitates phosphorylation of serine 473. Next used Western blotting to determine whether AKT phosphorylation at site Ser473 was occurring. Western blotting experiments (Fig. 5A) demonstrate a major increase in AKT phosphorylation at Ser473 upon addition of IGF1 under control conditions (Fig. 5B, dark red bar). This effect is not suppressed by PI3K inhibitor BKM120 (Fig. 5B, pink bar), confirming that AKT can be activated even in the presence of PI3K inhibitors.
Figure 5.
PI3K inhibition does not prevent IGF1-induced AKT phosphorylation. FDB samples were treated as control, with only IGF1, with only PI3K inhibition, or with both IGF1 and PI3K inhibition. AKT phosphorylation at Ser473 (A, top left) and total AKT (A, bottom left) were detected and quantified (B) under these conditions for multiple samples (samples 1 and 2 are shown, each sample used four mice, total n = 12). Phosphorylation of AKT at Ser473 is low under control and PI3K-inhibited conditions, whereas treatment with IGF1, even in the presence of PI3K-inhibitior BKM120, results in a strong increase in Ser473 phosphorylation.
PI3K inhibition is effective in the isolated adult muscle fiber system
We next verified the efficacy of the PI3K inhibitor BKM120 in skeletal muscle fibers. Here we examined changes in the subsarcomeric localization of a PH domain construct (37) to detect PIP3, a product generated when PI3K is activated. We used NES-EGFP-PH-ARNO2G-I303Ex2 (hereafter referred to as PH-ARNO-GFP), a construct that has been demonstrated to have a strong preference for PIP3 (37) to detect both the activation of PI3K upon insulin application and inhibition of PI3K via BKM120. Previous studies using this PH-ARNO-GFP construct have shown that it is not localized at the t-tubules or fiber membrane during states of PI3K inactivation (38), but with addition of insulin, it moves to the t-tubules and membrane of the cell, indicating PI3K activity leading to PIP3 generation at these muscle fiber external membranes.
Here we tested the localization of PH-ARNO-GFP under various conditions. Under control conditions, PH-ARNO-GFP was localized in a diffuse single sarcomeric band, as seen in both the confocal image (Fig. 6A) and in the single band (I1) in the Fourier transform of the image (Fig. 6, B and C). After treatment with insulin, PH-ARNO-GFP localizes to the TT membrane, forming a doublet pattern in the confocal image (Fig. 6A) and a second, more lateral band (I2) in the Fourier transform (Fig. 6, B and C). Subsequent addition of the PI3K inhibitor BKM120 reverts the localization of PH-ARNO-GFP to the pre-insulin state of the cell (Fig. 6, A–C). Utilizing BKM120 prior to insulin addition results in no movement of PH-ARNO-GFP on insulin addition (Fig. 6, D–F). These results clearly demonstrate that PI3K is activated by insulin and fully inhibited by BKM120 in these adult muscle fibers.
Figure 6.
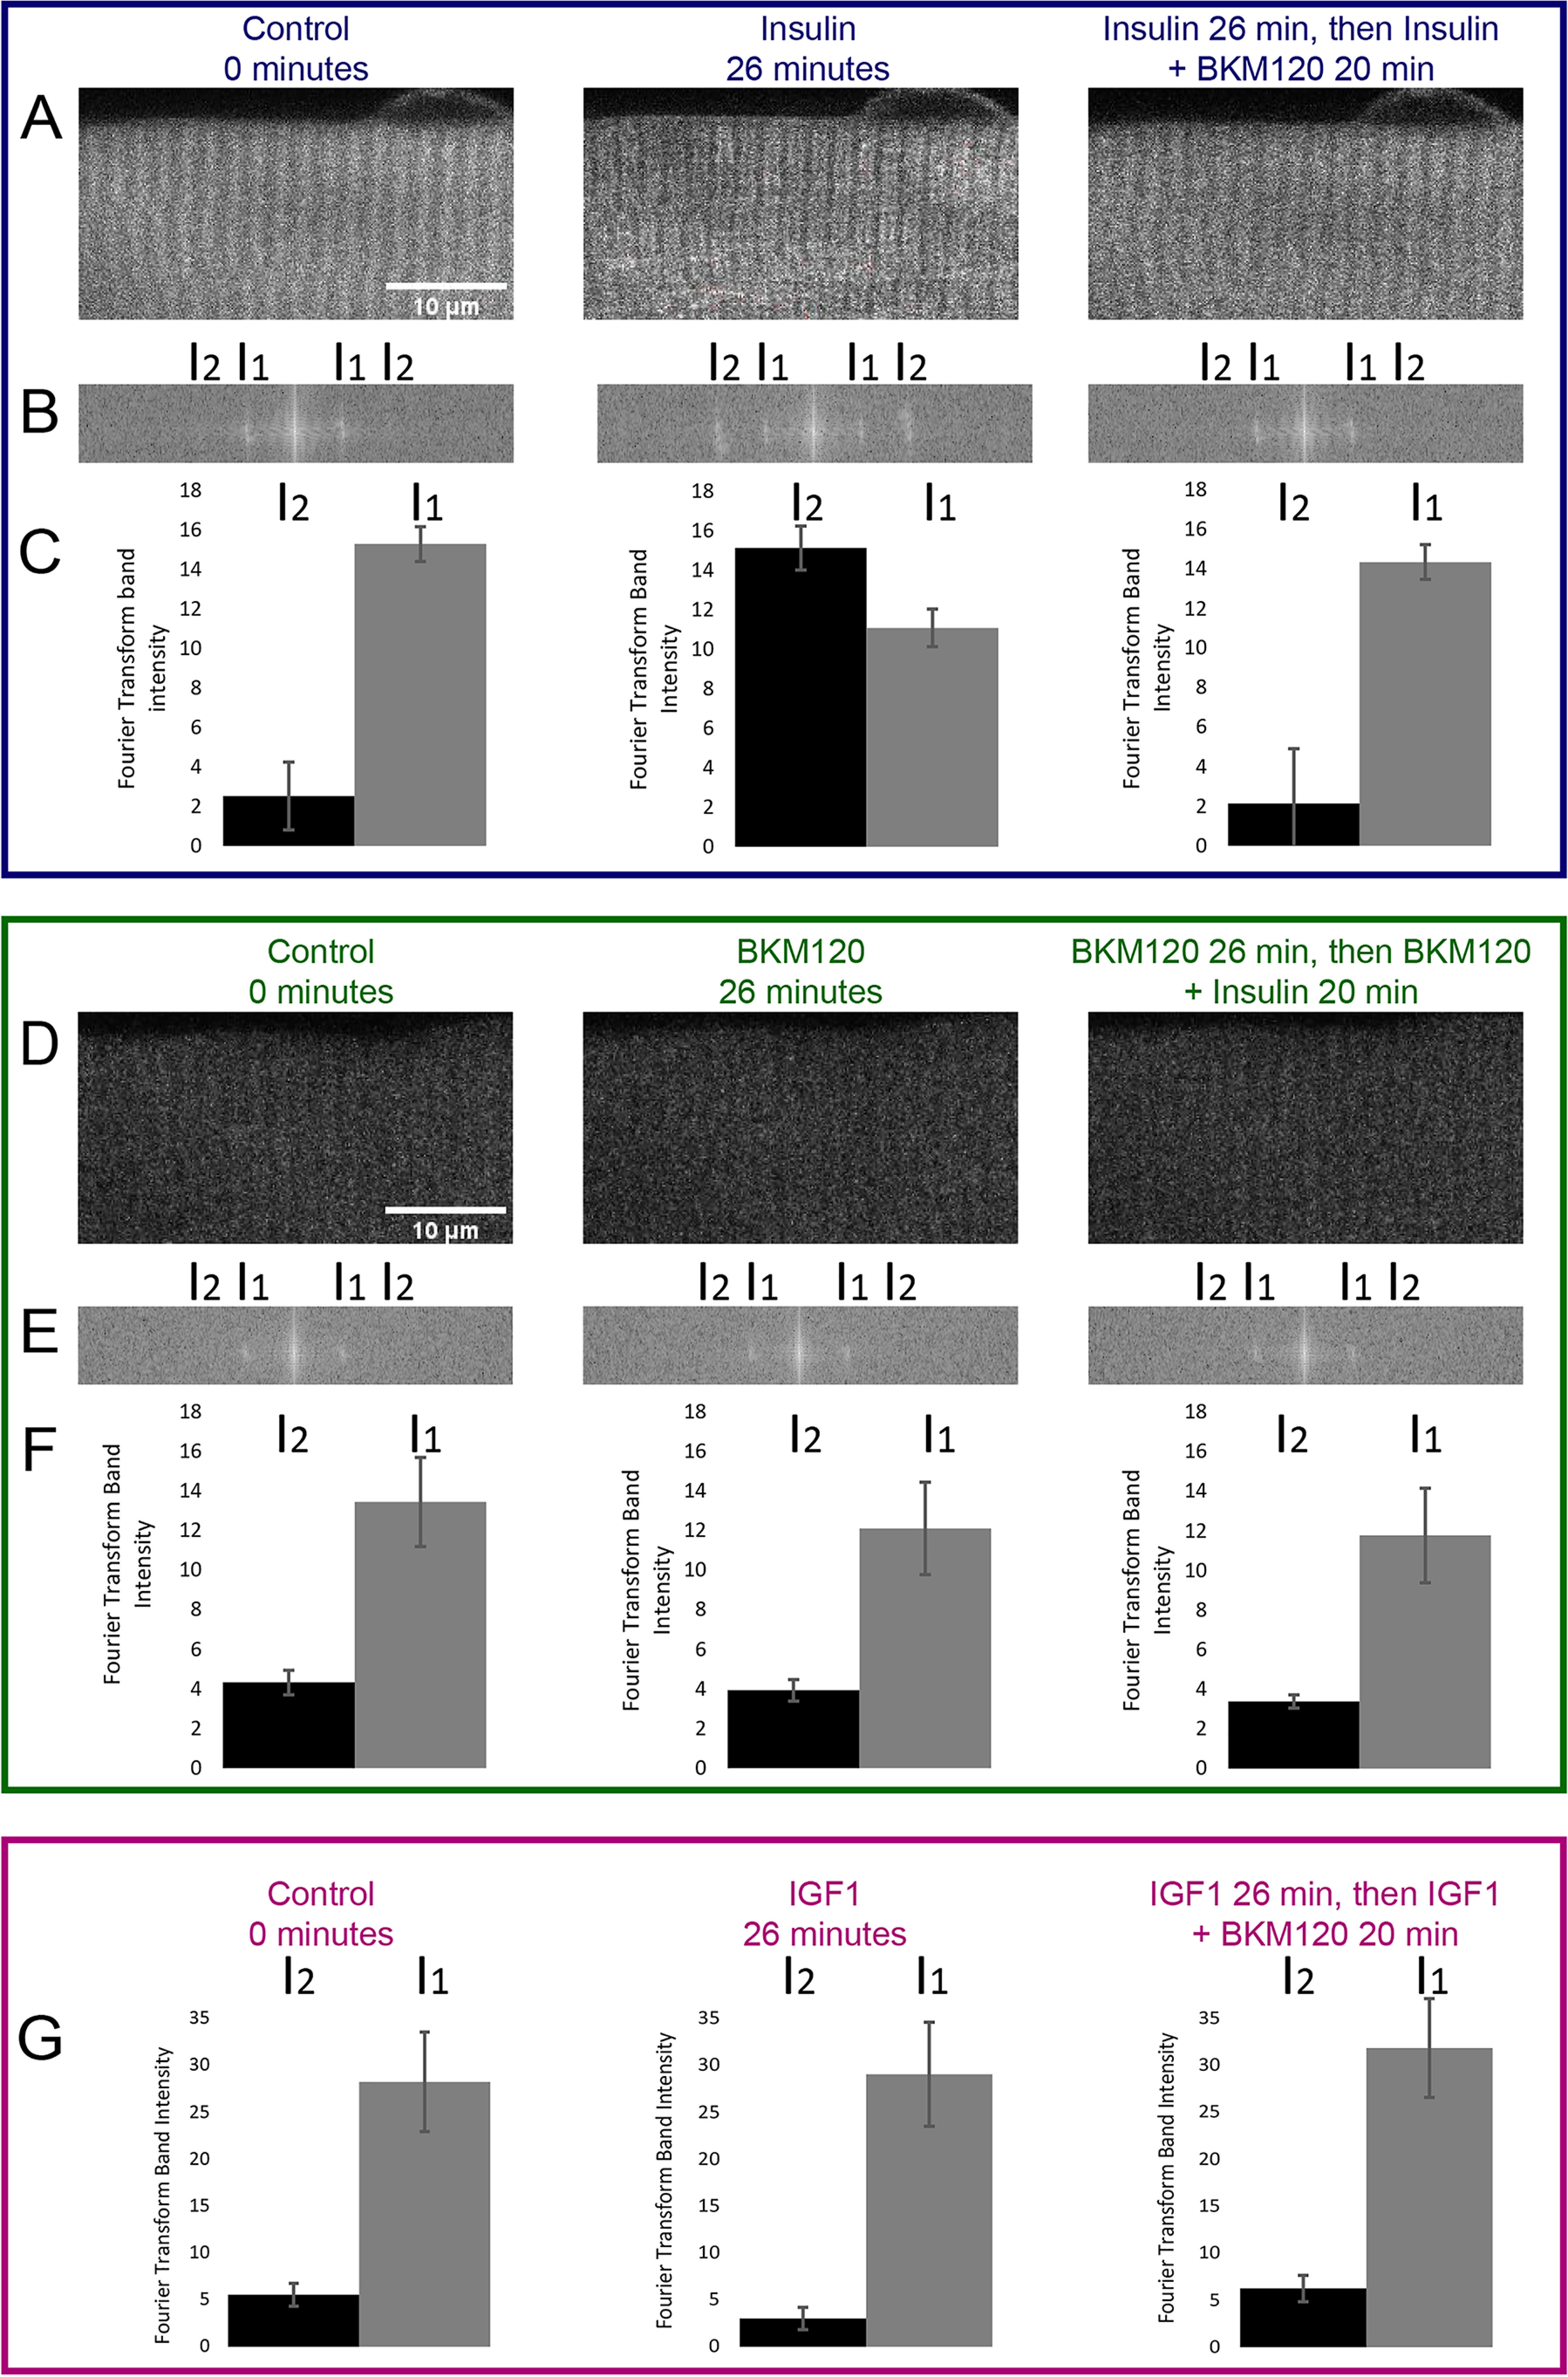
PI3K inhibition blocks insulin effect on subsarcomeric localization of the PIP3 biosensor PH-ARNO-GFP. A and D, fluorescent imaging of PH-ARNO-GFP expressing FDB fibers before treatment (0 min), after initial treatment (insulin or BKM120 for 26 min) or after final treatment (insulin + BKM120 for 20 min). Scale bar shown in 0 min images of A and D apply to the following time point images. In A, a change in PH-ARNO localization is visible from control to insulin treatment to insulin + BKM120 treatment. In D, addition of BKM120 prior to insulin application prevents any translocation of PH-ARNO-GFP. B and E, Fourier transform of images in A and D. The change in PH-ARNO-GFP localization after insulin addition can be visualized via Fourier transform as an increase in intensity at I2. C and F, quantification of Fourier transform band intensity at I1 and I2. Band intensity at I2 changes dramatically in C 20 min after insulin addition; this dramatic change is reversed and blocked with the use of BKM120. G, IGF1 has no effect on PH-ARNO-GFP localization. Shown is the quantification of Fourier transforms done on images of PH-ARNO-GFP electroporated FDB fibers imaged before treatment (0 min), after initial treatment with IGF1 (IGF for 26 min) or after treatment with IGF1 and BKM120 (IGF + BKM120 for 20 min). Band intensity at I1 or I2 does not change upon IGF1 addition.
IGF1 does not activate PI3K in adult muscle fibers
Interestingly, application of IGF1 to fibers under control conditions causes essentially no effect on PH-ARNO-GFP localization, either in the presence or absence of PI3K inhibitor BKM120 (Fig. 6G), indicating that IGF1 alone does not increase PI3K activation in adult muscle fibers. To verify that IGF1 was active in these fibers, another group of fibers from the same muscle as in Fig. 7 were transduced to express FOXO1–GFP (instead of PH-ARNO-GFP). Exposure of these fibers to IGF1 caused a rapid loss of nuclear FOXO1–GFP as in the other fibers confirming IGF1 responsiveness in these fibers. Thus, not only does IGF1 cause FOXO1 nuclear efflux (Fig. 1), it apparently does so without even activating PI3K (Fig. 6G). This is in contrast to insulin, which does activate PI3K in muscle fibers, but such active PI3K is not needed for AKT activation and FOXO1 nuclear efflux.
Figure 7.
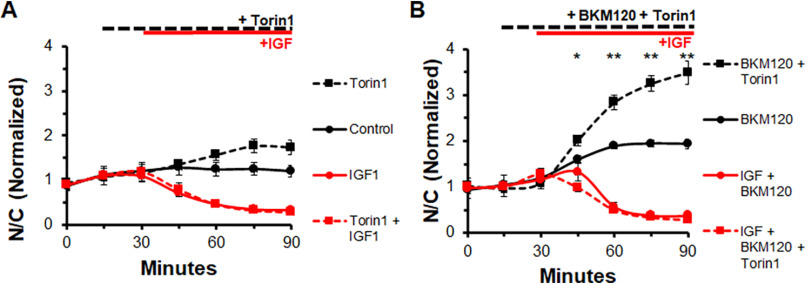
Inhibiting MTORC1 and MTORC2 does not block effects of IGF1 on FOXO1 nuclear efflux in the presence or absence of PI3K inhibitor BKM120. A, time course experiment of FOXO1–GFP N/C levels in the presence or absence of MTOR inhibitor, Torin, and IGF1. Control (solid black line) has no added compounds. The MTOR inhibitor Torin1 was added at 15 min (dashed lines). IGF1 was added at 30 min (red lines). B, time course experiment of FOXO1–GFP N/C levels in the presence of PI3K inhibition with or without the MTOR inhibitor Torin and IGF1. PI3K inhibitor BKM120 was added to each condition at 15 min (all lines). Torin1 was added at 15 min (dashed lines), and IGF1 was added at 30 min (red lines).
Inhibiting MTORC2 does not block effects of IGF on FOXO1 translocation, even when combined with PI3K inhibition
MTOR complex 1 and complex 2 can both be effectively inhibited using the MTOR inhibitor, Torin1. As shown above (Figs. 1–3) nuclear FOXO1–GFP rises gradually and stabilizes in fibers under control conditions (Fig. 7A, solid black line), here over the course of 90 min. In fibers treated with MTOR inhibitor Torin1 (1 μm), nuclear FOXO1–GFP increases over time (Fig. 7A, dashed black line) more than in control fibers, demonstrating that MTORC contributes to FOXO1 nuclear efflux under control conditions in our system. Under IGF1 treatment alone, a dramatic loss of nuclear FOXO1–GFP occurs (Fig. 7A, solid red line). Similar to PI3K inhibition, MTOR inhibition is unable to block the effect of IGF1 on nuclear FOXO1–GFP (Fig. 7A, dashed red line, overlapping with solid red line).
We next examined the effect of MTOR inhibition together with PI3K inhibition to determine whether blocking both is sufficient to block the IGF1 effect on FOXO1–GFP nuclear efflux. In this experiment, as before (Figs. 2 and 3), PI3K inhibition did not alter the marked FOXO1–GFP nuclear efflux in response to IGF1. Inhibition of both MTOR and PI3K caused an increase in nuclear FOXO1-GFP (Fig. 7B, dashed black line) compared with inhibition of only PI3K (Fig. 7B, solid black line). Treatment with PI3K inhibitor BKM120 prior to IGF1 did not prevent the IGF1-induced loss of nuclear FOXO1–GFP (Fig. 7B, solid red line). Use of both the PI3K inhibitor and the MTOR inhibitor Torin1 led to a dramatic increase of nuclear FOXO1–GFP (Fig. 7B, dashed black line) compared with treatment with PI3K inhibitor alone (Fig. 7B, solid black line). However, use of both inhibitors prior to IGF1 treatment did not prevent the rapid and nearly complete loss of nuclear FOXO1–GFP after IGF1 addition (Fig. 7B, dashed red line).
IGF1-induced FOXO1 nuclear efflux is partially regulated by ACK1
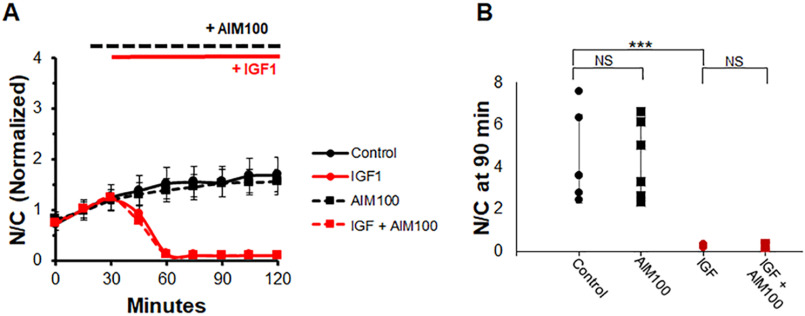
ACK1 is a kinase that can phosphorylate AKT (30, 39–41) independently of PI3K. First, we sought to determine the effects of ACK1 inhibition alone in the presence and absence of IGF1. As expected, IGF1 causes a rapid drop in nuclear FOXO1–GFP (Fig. 8A, red circles and solid red line), whereas addition of ACK1-I prior to IGF1 is unable to prevent the effects of IGF1 on FOXO1 translocation (Fig. 8A, red squares and dashed red line). Interestingly, ACK1-I treatment alone has no effect compared with control (Fig. 8A, black squares and dashed black line), unlike treatment with the PI3K or MTORC inhibitors in the absence of IGF1. Also shown is the N/C (not normalized) at the final time point. Control and ACK1 inhibition are both at similarly high levels of N/C (Fig. 8B, black circles and squares). IGF1 causes an N/C close to 0 (Fig. 8B, red circles), and the combination of the ACK1 inhibitor and IGF1 also results in an N/C close to 0 (Fig. 8B, red squares).
Figure 8.
Inhibition of only ACK1, a PI3K-independent activator of AKT, has no effect on FOXO1–GFP compared with control or in the presence of IGF1. A, time course experiment of FOXO1–GFP N/C levels in the presence or absence of the ACK1 inhibitor AIM100 and IGF. B, bar graph of N/C (not normalized) at the 90-min time point. Control (A, solid black line; B, black circles) has no added compounds. The ACK1 inhibitor AIM100 was added at 15 min (A, dashed lines; B, squares). IGF1 was added at 30 min (A, red lines; B, red circles and squares). NS, not significant.
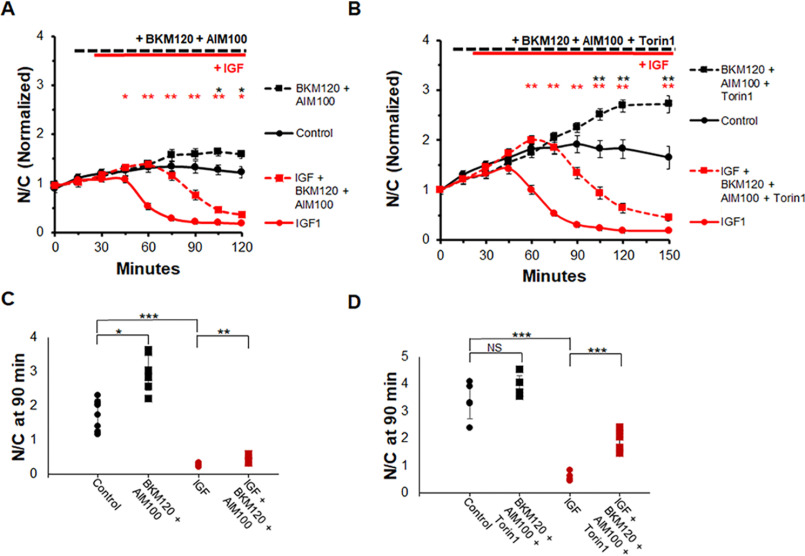
We next sought to determine whether the combined inhibition of ACK1 and PI3K would be sufficient to block IGF1-induced FOXO1 translocation. Control fibers (treated as previously) exhibited a small rise of FOXO1–GFP N/C with time (Fig. 9A, solid black line). The combination of BKM120 (10 μm), a PI3K inhibitor, and AIM-100 (2 μm), an ACK1 inhibitor, caused a slight increase in FOXO1–GFP N/C compared with control (Fig. 9A, dashed black line). Addition of IGF1 alone caused a rapid loss of FOXO1–GFP in myofiber nuclei (Fig. 9A, solid red line). In contrast, 15-min pre-exposure to both the ACK1 and PI3K inhibitors caused a considerable delay (∼40 min) in the half-time of the decrease in FOXO1–GFP N/C when IGF1 was added (Fig. 9A, dashed red line) compared with the case in previous experiments in which IGF1 was added after PI3K inhibition alone. However, the IGF1 effect on FOXO1–GFP was not entirely blocked, and nuclear FOXO1–GFP eventually approached a very low level at the end of the recording, although this response was greatly delayed.
Figure 9.
Combined inhibition of PI3K, MTOR, and ACK1 partially blocks IGF1 effect on FOXO1–GFP nuclear efflux. A and C, time course experiment and N/C bar graph (not normalized) at 90-min time point using an ACK1 inhibitor (AIM100), a PI3K inhibitor (BKM120), and IGF1. Control (A, solid black line; C, black circles) has no added compounds. PI3K inhibition and ACK1 inhibition (A, dashed lines; C, squares). IGF1 was added at 30 min (A, red lines; C, red circles and squares). B and D, time course experiment and N/C bar graph (not normalized) at the 90-min time point using ACK1 inhibitor (AIM100), PI3K inhibitor (BKM120), MTOR inhibitor (Torin1), and IGF1. Control (B, solid black line; D, black circles) has no added compounds. PI3K inhibition, ACK1 inhibition, and MTOR inhibition (B, dashed lines; D, squares) are shown. IGF1 was added at 30 min (B, red lines; D, red circles and squares). NS, not significant.
We then performed an experiment utilizing inhibitors against ACK1, PI3K, and MTOR (Fig. 9B). In this protocol each condition included PI3K inhibitor BKM120. Fibers treated with the PI3K inhibitor alone had a gradual increase in FOXO1–GFP N/C followed by a slight decline (Fig. 9B, solid black line), as seen previously. The addition of all three inhibitors shortly after the 15-min mark resulted in a rapid rise of FOXO1–GFP in the nuclei (Fig. 9B, dashed black line) compared with PI3K inhibition alone. The addition of IGF1 in the presence of only the PI3K inhibitor caused a rapid loss of FOXO1–GFP in fiber nuclei (Fig. 9B, solid red line) as seen in previous experiments. In contrast, addition of IGF1 in the presence of all three inhibitors was followed by an initial modest increase in FOXO1–GFP N/C. The initial rise was followed after a delay by an eventual marked decline in nuclear FOXO1–GFP in response to IGF1 in the presence of all three inhibitors (Fig. 9B, dashed red line). The half-time of decline in nuclear FOXO1–GFP caused by IGF1 addition in the presence of the three inhibitors was delayed by ∼40 min compared with the response of fibers that received IGF1 in the presence of the PI3K inhibitor alone (Fig. 9B, solid red line).
Examination of the N/C at the 90-min time point clearly demonstrates the effect the combination of inhibitors has on FOXO1–GFP translocation in the presence and absence of IGF1. IGF1 treatment alone caused a drop of nuclear FOXO1–GFP to close to 0 N/C (Fig. 9, C, red circles, and D, red circles), whereas the combination of PI3K-I and ACK1-I slows down the effect of IGF1 such that at 90 min the FOXO1–GFP N/C is ∼1 (Fig. 9C, red squares). The combination of three inhibitors causes a stronger effect. Treatment with the PI3K-I, ACK1-I, and MTOR-I plus IGF1 led to a N/C level of ∼2 despite the effects of IGF1 on FOXO1–GFP translocation (Fig. 9D, red squares). These results indicate that ACK1 is a player in the IGF1-induced FOXO1 translocation pathway, as well as that there are other actors present in the pathway that we have yet to account for.
IGF1-induced FOXO1 nuclear efflux is also partially mediated by the kinase ATM
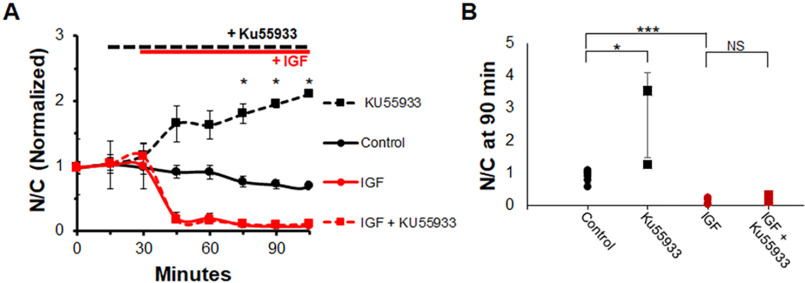
ATM is another kinase that can activate AKT independently of PI3K (31) and is present in muscle. First, we sought to determine the effects of inhibition of ATM in the presence and absence of IGF1. As expected, IGF1 causes a rapid drop in nuclear FOXO1–GFP (Fig. 10A, red circles and solid red line). The addition of ATM inhibitor Ku55933 prior to IGF1 is unable to prevent the effects of IGF1 on FOXO1 translocation (Fig. 10A, red squares and dashed red line). Treatment with ATM-I alone, without IGF1, has an effect similar to PI3K and MTOR inhibitors compared with control (Fig. 10A, black squares and dashed black line), causing an increase in N/C of FOXO1–GFP compared with control. At the 90-min time point, compared with control (Fig. 10B, black circles), the inhibitor Ku55933 significantly increases FOXO1–GFP N/C (Fig. 10B, black squares). However, treatment with Ku55933 prior to IGF1 addition (Fig. 10B, red squares) results in FOXO1–GFP N/C values similar to treatment with IGF1 alone (Fig. 10B, red circles).
Figure 10.
Inhibition of ATM, a PI3K-independent activator of AKT, promotes FOXO1–GFP nuclear accumulation compared with control but is unable to block the IGF1 effect on FOXO1–GFP nuclear efflux. A, time course experiment of FOXO1–GFP N/C levels in the presence or absence of ATM inhibitor KU55933 and IGF1. B, bar graph of N/C (not normalized) at the 90-min time point. Control (A, solid black line; B, black circles) has no added compounds. ATM inhibitor KU55933 was added at 15 min (A, dashed lines; B, squares). IGF1 was added at 30 min (A, red lines; B, red circles and squares). NS, not significant.
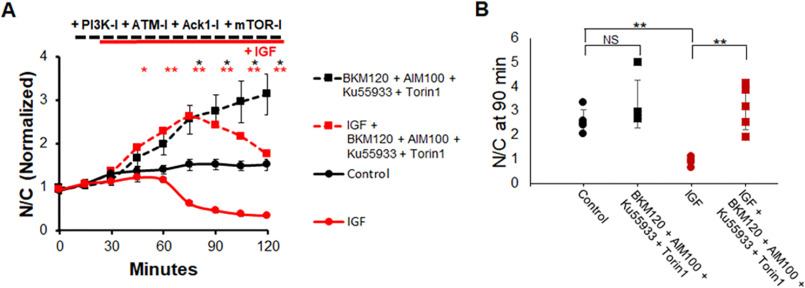
We then performed an experiment utilizing inhibitors against ACK1, ATM, PI3K, and MTOR (Fig. 11A). Control fibers showed a minimal increase in FOXO1–GFP N/C followed by a steady state N/C (Fig. 11A, solid black line), as seen previously. The addition of all four inhibitors shortly after the 30-min mark resulted in a rapid rise of FOXO1–GFP in the nuclei (Fig. 11A, dashed black line) compared with control. The addition of IGF1 alone caused a loss of FOXO1–GFP in fiber nuclei (Fig. 11A, solid red line) as seen in previous experiments. The addition of IGF1 in the presence of all four inhibitors was followed by an initial increase in FOXO1–GFP N/C. The initial rise was followed after a delay by an eventual decline in nuclear FOXO1–GFP in response to IGF1 in the presence of all four inhibitors (Fig. 11A, dashed red line). The decline in nuclear FOXO1–GFP caused by IGF1 addition in the presence of the four inhibitors was so delayed compared with the response of fibers that received IGF1 alone (Fig. 11A, solid red line) that the half-time of decay was not reached by the end of the experiment (Fig. 11A, dashed red line). At 90 min, when IGF1 alone has a strong effect (Fig. 11B, red circles) compared with control (Fig. 11B, black circles), treatment with the four inhibitors BKM120, AIM100, Ku55933, and Torin1 before adding IGF1 is able to significantly alter the effect of IGF1 on FOXO1–GFP.
Figure 11.
Inhibition of PI3K, MTOR, ACK1, and ATM markedly suppresses the effect of IGF1 on FOXO1–GFP translocation. A, time course experiment using ACK1 inhibitor (AIM100), PI3K inhibitor (BKM120), MTOR inhibitor (Torin1), ATM inhibitor (KU-55933), and IGF1. B, bar graph of N/C (not normalized) at the 90-min time point. Control (A, solid black line; B, black circles) has no added compounds. Inhibitors were added at 15 min (A, dashed lines; B, squares). IGF1 was added at 30 min (A, red lines; B, red circles and squares). NS, not significant.
The results in Figs. 11 and 12 indicate that ATM is also a player in the IGF1-induced FOXO1 translocation pathway. In addition, there may be other actors present in the pathway that we have yet to account for.
Figure 12.
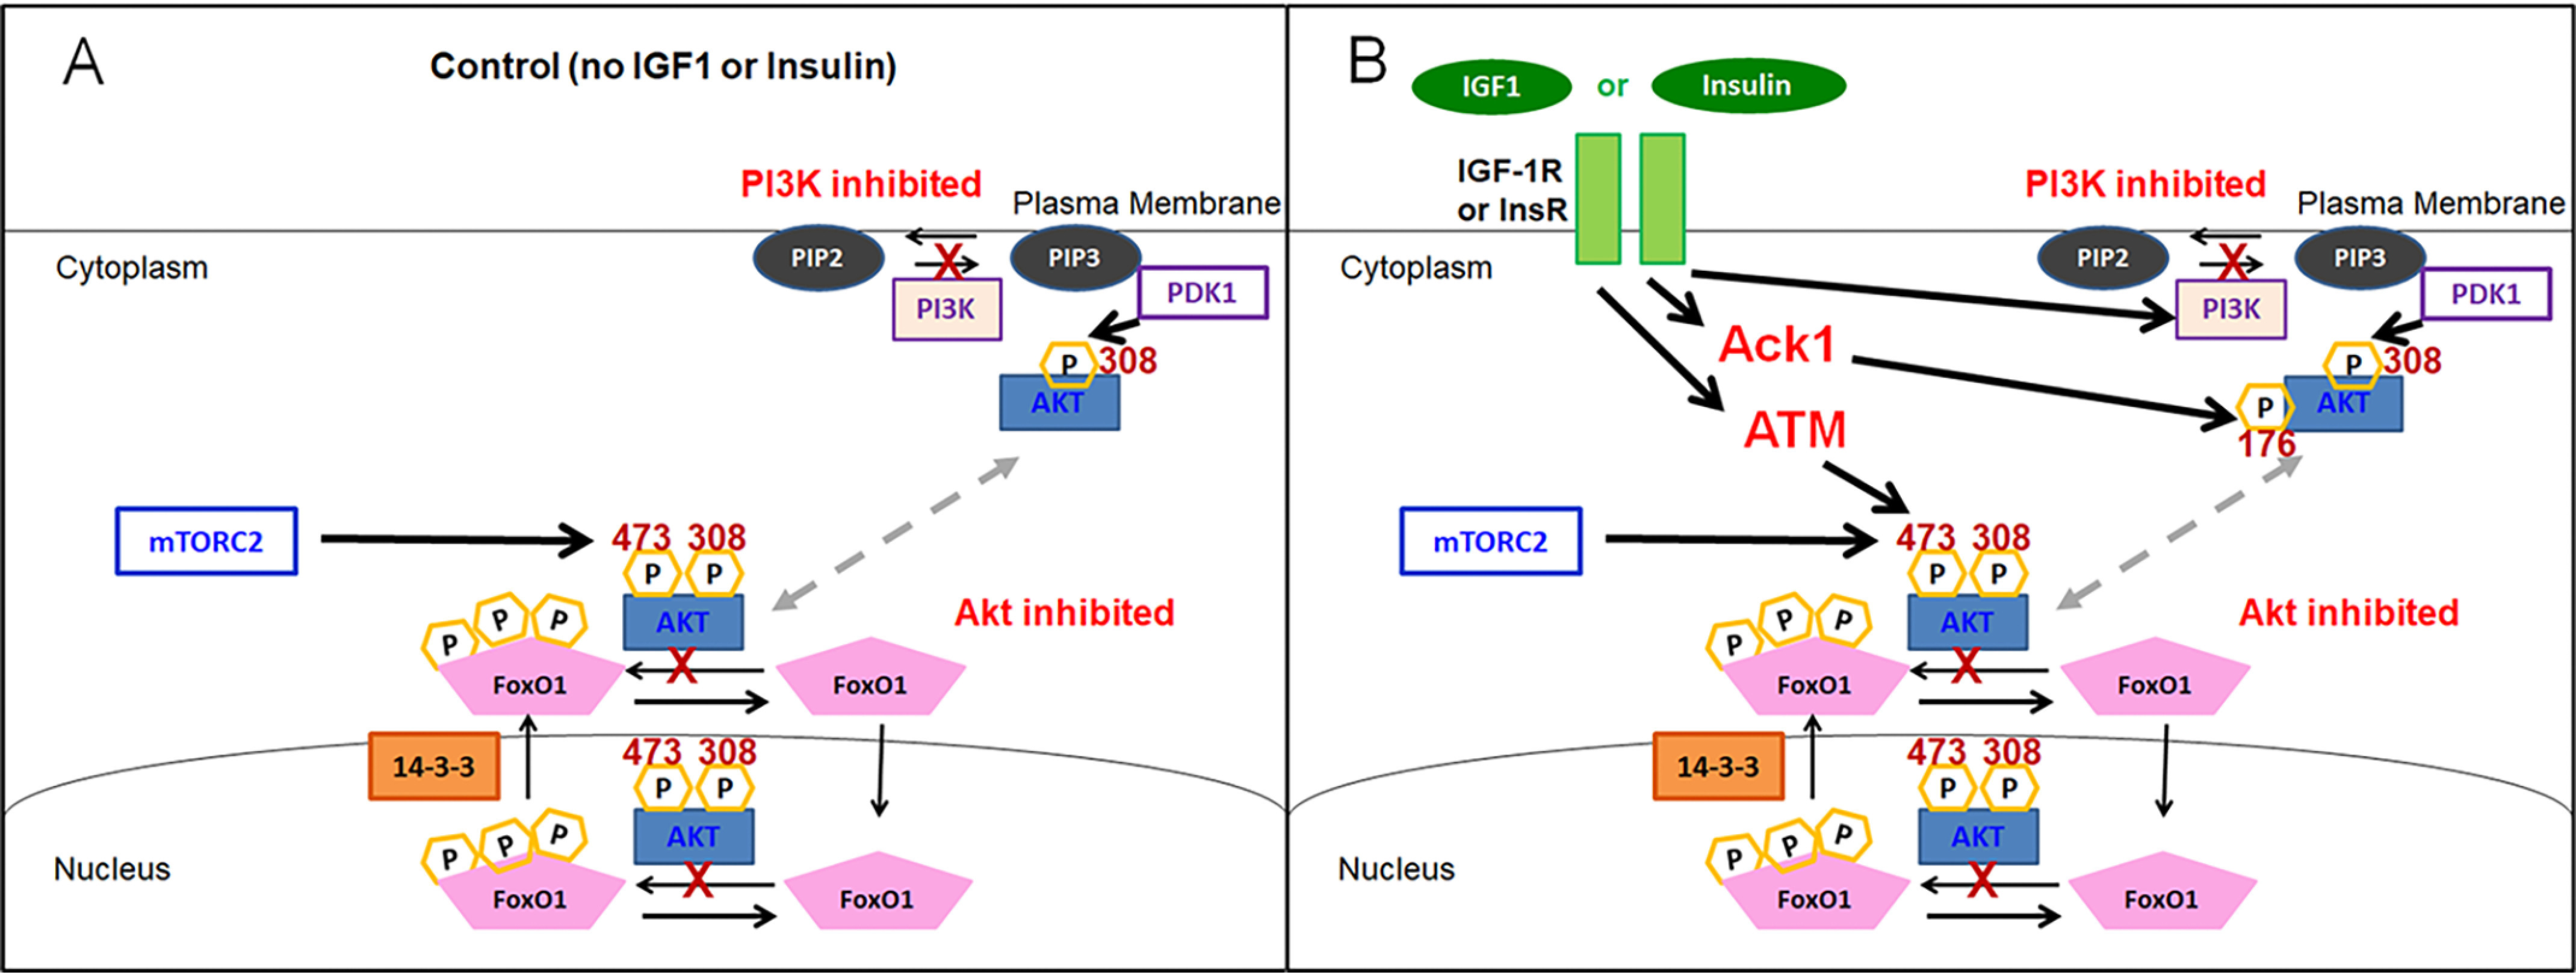
Cartoon illustrating multiple signaling pathways whereby IGF1 or insulin leads to the activation of AKT and the consequent phosphorylation and marked nuclear efflux of FOXO1. A, in the absence of IGF1 or insulin, our results suggest that PI3K contributes strongly to basal AKT activation under control growth factor– and hormone-free conditions. B, in the presence of IGF1 or insulin, our results suggest that PI3K is not required for AKT activation and that alternate mechanisms, including ACK1 and ATM, contribute to insulin or IGF1-dependent AKT activation. Note that although not illustrated in B, only insulin and not IGF1 causes PI3K activation.
Discussion
Muscle atrophy–hypertrophy is believed to be regulated by the IGF1 → PI3K → AKT pathway. However, our present results demonstrate that each of three accepted inhibitors of PI3K (BKM 120, LY294002, or wortmannin) are almost totally ineffective on their own in blocking the pronounced IGF1- or insulin-induced nuclear exclusion of FOXO1–GFP that we observe in adult skeletal muscle fibers in the absence of these inhibitors. Previously, these same PI3K inhibitors have been shown to inhibit the effects of IGF1 addition in other cell systems, including skeletal muscle cell lines (36, 42). Thus, the effects of IGF1 on AKT activation and the resulting suppression of muscle atrophy and promotion of muscle hypertrophy have been believed to be mediated via the IGF1 → PI3K → AKT pathway. Indeed, this does appear to be the predominant pathway in immature, developing, and regenerating muscle fibers, as well as in skeletal muscle cell lines. However, this may not be the full signaling pathway operative in adult skeletal muscle (43), which is subject to disuse, aging, and disease-dependent atrophy.
Our study examines intermediate steps in signaling from IGF1 or insulin to AKT in fully developed adult muscle fibers. Using intact individual skeletal muscle fibers isolated from young adult mice, we find that the robust marked effect of IGF1 or insulin of promoting rapid and pronounced nuclear efflux of FOXO1–GFP is almost fully insensitive to the addition of any of the three PI3K inhibitors. Importantly, each of the PI3K inhibitors was effective in increasing FOXO1–GFP nuclear influx in the absence of both IGF1 and insulin (Fig. 12A), thus establishing that each inhibitor was effective as used in our adult muscle fiber system. Furthermore, studies with PH-ARNO-GFP demonstrated that the PI3K inhibitor BKM120 was effective in fully blocking insulin-activated PH-ARNO-GFP redistribution in muscle fibers (Fig. 6). These studies also showed that PI3K is not activated by IGF1 in these fibers (Fig. 6G). Thus, the small PI3K inhibitor contribution in slowing the response to IGF1 (Figs. 2B and 3, A and B) must be from PI3K that is already active in the control condition and that continues to be active when IGF1 is added. In addition, in contrast to inhibiting PI3K (Figs. 2 and 3), inhibiting AKT fully eliminated the IGF1- or insulin-induced nuclear efflux of FOXO1–GFP (Fig. 1), demonstrating that the pathway from IGF1 addition to FOXO1–GFP nuclear exclusion was via AKT. Taken together, our observations imply the presence of alternative signaling pathways from IGF1 or insulin to AKT that are independent of PI3K (Fig. 12B). Our present results show that the kinases ACK1 and ATM may at least partially contribute to the PI3K-independent pathway from IGF1 to AKT.
Revised model for FOXO1 regulation
Results from this study suggest two new PI3K-independent pathways, including the involvement of either ACK1 or ATM in activation of AKT in the presence of IGF1 or insulin. Here we show that under control conditions in the absence of IGF or insulin, PI3K contributes strongly to the basal AKT activation, leading to Foxo1 accumulation in nuclei when PI3K is inhibited in the absence of IGF1 or insulin addition. (Fig. 12A). In marked contrast, in the presence of IGF or insulin it appears that PI3K is at most only partially responsible for AKT activation and that ACK1 and ATM, along with other possible alternate mechanisms, also contribute to Akt activation and the resulting FOXO1 nuclear efflux (Fig. 12B).
Localization of FOXO1 to myofiber nuclei results in activation of atrogene transcription leading to protein breakdown and, thus, muscle atrophy. The localization of FOXO1 is regulated through post-translational modifications. Phosphorylation by AKT has previously been shown to cause a shift of FOXO1 to the cytoplasm of myofibers, and thus regulation of this phosphorylation is of importance because it directly affects the function of FOXO1. Here we demonstrate for the first time that IGF or insulin may activate alternate kinases to PI3K that activate AKT and lead to FOXO1 phosphorylation. This information on a parallel regulatory pathway of FOXO1 localization could lead to a better understanding of FOXO1 regulation and possible avenues for muscle atrophy therapy, as well as insulin insensitivity in diabetes.
AKT is necessary for IGF1-induced FOXO1 movement to the cytoplasm, whereas PI3K is not
Phosphorylation of FOXO1 by AKT reduces FOXO1 localization to the nucleus significantly. Here we show that AKT is necessary for IGF1-induced movement of FOXO1 (Fig. 1) because inhibition of AKT fully eliminates the effect of IGF1 or insulin on FOXO1 movement out of the nucleus. In contrast, our results suggest that PI3K is not the only intermediate capable of activating AKT post-IGF1 or insulin treatment (Figs. 2 and 3). Although PI3K inhibition leads to an increase of N/C compared with control in the absence of IGF1, there is only a slight delay when treating myofibers with IGF1 together with a PI3K inhibitor (Figs. 2 and 3, dashed red lines) compared with treating myofibers with IGF1 alone (Figs. 2 and 3, solid red line).
Additionally, we show that insulin, a hormone that has overlapping interactions with IGF1 receptors, also causes a rapid efflux of FOXO1–GFP out of the nuclei that is blocked by AKT inhibition while being largely insensitive to PI3K inhibition (Fig. 4). These observations indicate that there are alternate pathways relaying the signal from IGF1/insulin to AKT and, finally, FOXO1–GFP phosphorylation and efflux from myofibers nuclei.
Although there are multiple candidate kinases for activating AKT independently of PI3K in the presence of IGF1 or insulin, thus far only ACK1 and ATM have shown an effect
MTORC2 exists in a positive feedback loop with AKT where AKT is able to phosphorylate MTORC2 and then be phosphorylated by MTORC2. Here we confirm that inhibiting only MTOR or both MTOR and PI3K is unable to prevent the effect of IGF1 on FOXO1 movement out of myofiber nuclei. Like PI3K inhibition alone, although inhibition by either MTOR or both MTOR and PI3K causes a rise in N/C compared with control (Fig. 7, dashed black lines) in the absence of IGF1, neither condition is sufficient to block the effects of IGF1 (Fig. 7, dashed red lines) on FOXO1 localization. This suggests that there are other kinases at play in activating AKT downstream of IGF1.
Several kinases have been suggested as PI3K-independent catalysts of AKT activity. Two of these kinases, ACK1 and ATM, have also been shown to respond to growth factor treatment in other cells (30, 31). Although it has been shown that ACK1 and ATM directly affect AKT and may lead to indirect activation of AKT, this study is the first in investigating the impact of ACK1 and ATM on the IGF1- or insulin-induced FOXO1 efflux out of myofiber nuclei. Unlike the ATM, PI3K, AKT, or MTOR inhibitors, use of ACK1 inhibition alone caused no difference to nuclear FOXO1–GFP compared with control. This suggests that ACK1 is not active in the absence of IGF1. The inability of ACK1 inhibition to block the IGF1 effect on FOXO1–GFP (Fig. 8) indicates that PI3K or other kinases are also involved in relaying the IGF1 signal to activate AKT.
Use of an ACK1 inhibitor or an ATM inhibitor in combination with PI3K inhibition and in combination with both inhibition of PI3K and MTOR results in a marked delay and subsequent slowing of the IGF1 activated FOXO1 nuclear efflux. This delay appears to be further increased upon the combination of ACK1, ATM, PI3K, and MTOR inhibition. These results indicate that ACK1 and ATM contribute strongly to the IGF1-induced FOXO1 movement from the nucleus and that inhibition of ACK1 and ATM is sufficient to partially block some of the IGF1 effect (Fig. 11). It is, however, apparent that there are one or more alternate pathways at play in regulating AKT after IGF1 treatment. It is noteworthy that inhibiting either only ATM (Fig. 10) or only PI3K (Figs. 2 and 3) causes similar effects: an increase in FOXO1 nuclear accumulation in the absence of added IGF1 and only slight or no delay in the IGF1-induced pronounced nuclear efflux of FOXO1. Determining the relative contributions of the various kinases to the overall IGF1-induced response requires further studies. In addition, it would be highly interesting to determine how atrogene expression, which is activated by nuclear FOXO1, is modulated by these various pathways contributing to IGF1-stimulated AKT activation and FOXO1 nuclear efflux in future studies.
Insulin/IGF1 signaling in myotubes and mature muscle fibers
The canonical pathway for activation of AKT by IGF1/insulin includes binding of IGF1 or insulin to the IGF1 and/or insulin receptor, activation of the lipid kinase PI3K, PI3K-mediated phosphorylation of the plasma membrane lipid PIP2 to PIP3, and movement of unphosphorylated AKT to PIP3-containing locations in the plasma membrane where it is phosphorylated at Ser308 and Thr473 and thereby activated. A classic paper, cited over 3,000 times, establishes that in L6 myotubes insulin strongly activates AKT kinase activity and that this activation of AKT is completely blocked by the presence of the PI3K inhibitor wortmannin (44). This clearly establishes that in the L6 myotube system, AKT activation by insulin application requires PI3K. We do not dispute the effectiveness of this pathway in L6 myotubes. However, our results demonstrate that in adult skeletal muscle fibers under the conditions of our studies, the activation of AKT-dependent FOXO1–GFP nuclear efflux by insulin or IGF1 is essentially independent of whether or not PI3K is inhibited, implying the existence of alternative pathways from insulin/IGF1 to AKT that do not require PI3K. In contrast, AKT inhibitor VIII fully prevents the IGF1 or insulin effect on FOXO1–GFP nuclear efflux, establishing the essential role of AKT in the pathway from IGF1/insulin application to FOXO1–GFP nuclear efflux in adult muscle. We thus conclude that in adult muscle fibers there are one or more parallel pathways from IGF1 or insulin application to AKT activation that do not involve PI3K.
We hypothesize that these parallel pathways may not be active in L6 myotubes or in other muscle fiber precursor model systems. However, the alternative possibility that some difference in experimental conditions might have given rise to the differing results in previous versus present experiments must also be entertained. This issue invites further experimental investigation in future studies.
Conclusion
Our results suggest that IGF1- or insulin-induced FOXO1 movement out of nuclei in adult isolated skeletal muscle fibers is fully dependent on AKT but not on PI3K. Furthermore, this requires that one or more alternate mechanisms are involved in IGF1-induced AKT activation, and these mechanisms include, but are likely not limited to, the kinases ACK1 and ATM. Further work is needed to determine alternate mechanisms that are involved, but these findings alone may be useful in designing therapies for those struggling with muscle atrophy or for better understanding the effects of treatments for diseases like cancer that may induce muscle atrophy, as well as in diabetes.
Experimental procedures
Materials
The following materials were used: adFOXO1-GFP (gift from Dr. Joseph Hill, UT Southwestern Medical Center), leptomycin B (LC Laboratories, Woburn, MA, USA), IGF-1 (mouse, Sigma I8779), Akt inhibitor Akt-I-1,2 at 1 μm (124017, Calbiochem, Billerica, MA, USA), PI3K inhibitors: BKM-120 at 10 μm (2619-5, Biovision Inc., Milpitas, CA, USA), LY294002 at 25 μm (9901, Cell Signaling), and wortmanin at 10 μm (W3144, Sigma); Ack1 inhibitors: GNF-7 (SML1501, Sigma) and AIM-100 at 2 μm (104833, Calbiochem); mTOR inhibitor Torin1 at 1 μm (14379, Cell Signaling); ATM inhibitor: Ku55933 (SML1109, Sigma). NES-EGFP-PH-ARNO2G-I303Ex2 was a gift from Gerry Hammond (Addgene plasmid no. 116868; RRID:Addgene_116868).
FDB fiber preparation
Flexor digitorum brevis (FDB) skeletal muscle fibers were isolated from adult (4–6 weeks old) female CD1 mice. All animal procedures were carried out according to protocols approved by the University of Maryland Institutional Animal Care and Use Committee as previously described (27, 45, 46). Isolated FDB muscle was digested in MEM containing collagenase type I (C0130, Sigma) at 2 mg/ml for 3 h at 37 °C. The fibers were then gently triturated with a small opening glass pipette. Groups of individual dissociated fibers were plated into each chamber of a four-chamber glass-bottomed dish (D35C4-20-1-N, In Vitro Scientific). In the case of live fiber experiments, we used dishes coated with laminin (23017-015, Invitrogen). The fibers were washed three times and cultured in serum-free MEM.
Adenoviral infection and electroporation
For adenoviral infection, 3.5 μl of purified adenovirus adFOXO1–GFP was added to infect the fibers after plating on glass-bottomed dishes. The fibers were incubated for 72 h following virus addition before imaging. Our laboratory has used this adenovirus protocol extensively to express fluorescent GFP fusion constructs of both FOXO1 (22, 27, 32) and other transcriptional regulators (27, 33, 34).
Electroporation for expression of exogenous cDNA for PH-ARNO-GFP in FDB muscle fibers was carried out on anesthetized 4–6-week-old CD1 mice. The hind foot was cleaned, and 20 μl of hyaluronidase (0.5 mg/ml) was injected subcutaneously with a Hamilton syringe and sterile small-bore needle into each hind foot. After 1 h, the animal was anesthetized again, and the hind foot was cleaned with alcohol. 20 μl of FOXO1–GFP cDNA is subcutaneously injected subcutaneously in each hind foot. Sterile electrodes are placed in the skin at the heel and toes. The field strength is set to 150 V/cm with 1-Hz, 20-ms pulse duration for 20 s. As early as 3 days later, FDBs are prepared according to the above protocol. Muscle fibers are imaged 24–72 h after being plated in culture. This procedure is widely used in the muscle field and has been used previously by us and other laboratories (34, 35).
Western blotting experimental protocol
Isolated FDB muscle fibers were placed into 60-mm Petri dishes (P5481, Sigma–Aldrich) in MEM with gentamycin and kept at 37 °C for 3 days. After treatment as described for 90 min, the fibers were collected. The myofibers were lysed with radioimmune precipitation assay buffer (Cell Signaling Technology, 9806S) supplemented with a protease/phosphatase inhibitor (A32961, Invitrogen) with sonication. Protein concentration was measured using a BCA protein assay (Thermo Fisher Scientific). 60 μg of protein were loaded and separated in 4–12% gradient gels and then transferred to a nitrocellulose membrane. The membranes were blocked in 5% milk and incubated overnight in primary AKT antibody (9272, 1:200; Cell Signaling Technology) or phospho-AKT Ser473 antibody (9271, 1:200; Cell Signaling Technology). The membranes were visualized after incubation with horseradish peroxidase–conjugated rabbit antibodies and ECL substrate (Thermo Fisher Scientific). Ponceau S staining was performed to ensure proper loading and protein transfer. The bands were quantified using ImageJ (National Institutes of Health).
Confocal fluorescence imaging of FOXO1–GFP or PH-ARNO-GFP, and experimental protocol
Cultured myofibers were isolated 3 days prior to the experiment and transduced to express FOXO1–GFP or 1 day prior to the experiment if from mice electroporated with NES-EGFP-PH-ARNO2G-I303Ex2. Nontransduced fibers or fibers from nonelectroporated mice showed negligible fluorescence, so measured fluorescence images represent FOXO1–GFP or NES-EGFP-PH-ARNO2G-I303Ex2. A four-compartment dish was used to enable simultaneous imaging of four distinct conditions (Figs. 1A and 2A). The dish of cultured fibers was removed from the incubator and was placed on an Olympus IX70 inverted microscope equipped with Olympus FLUOVIEW 500 laser scanning confocal microscope imaging system as previously described (27). The excitation wavelength was 488 nm with a 505-nm long-pass emission filter to monitor the FOXO1–GFP or NES-EGFP-PH-ARNO2G-I303Ex2 fluorescence. In the case of FOXO1–GFP experiments, each compartment was washed with L-15 and allowed to stabilize for 30 min prior to the experiment while striated, and intact fibers were selected for imaging (Figs. 1A and 2A, first column shows transmitted light images). The selected muscle fibers were then imaged at 15-min intervals (Fig. 1A). The first image was taken at time 0 min (which is 30 min after L-15). Note that the images may contain multiple nuclei within the same multinucleate individual skeletal muscle fiber (Fig. 1A). For these experiments, no more than two nuclei were used in analysis for each fiber. For NES-EGFP-PH-ARNO2G-I303Ex2 experiments, each compartment was washed with L-15 and allowed to stabilize for 30 min prior to the experiment while striated, and intact fibers were selected for imaging. The selected muscle fibers were then imaged at 2-min intervals. The first image was taken at time 0 min (which is 30 min after L-15).
Fluorescence image analysis
For quantification (Fig. 1B), the mean pixel fluorescence was determined for nuclei (N) and for a large cytoplasmic (C) area devoid of nuclei and corrected for background using Image J software (National Institutes of Health, Bethesda, MD). The mean pixel fluorescence over a given area is proportional to the concentration of FOXO1–GFP within that area. The N and C values for each nucleus at each time point were used to give a nuclear/cytoplasmic ratio of FOXO1–GFP (N/C). Because the cytoplasmic volume is much larger than the nuclear volume in muscle fibers, C remains constant when N changes significantly because of nucleocytoplasmic movements of FOXO1–GFP, and the N/C ratio effectively represents a calculation to normalize for differences in expression of FOXO1–GFP. We calculate N/C as a function of time for each nucleus from images acquired at 15-min intervals to monitor changes over time with or without the addition of various agents. To account for variability in FOXO1 nucleocytoplasmic distribution and fluxes between fibers (38), our N/C time course data for each nucleus was normalized to the N/C value in the same fiber at the 15-min time, a time point at which all fibers are still under control conditions. For comparing different treatments at a given time point, mean values of nonnormalized N/C from multiple nuclei and fibers were used. For the NES-EGFP-PH-ARNO2G-I303Ex2 experiments, we used Fourier analysis to monitor the change in the striated fluorescence pattern of the fibers in response to IGF or insulin application. Here muscle fiber images were aligned horizontally, and ImageJ Fast Fourier Transform was used on the image at different time points to generate a Fourier transform of the image. These generated images were analyzed by measuring the intensity of the pixels on the Fourier transform that represent the repeating spatial frequency of the fluorescence across the two-dimensional space of the image.
Statistics
The values presented in the time-course graphs of N/C are means ± S.D., whereas values for 90-min N/C graphs are individual data points ± S.D. Student's t test was used to determine the significance of difference. In all figures, p < 0.05 was considered significant.
Data availability
All data described are located within the article.
Acknowledgments
We thank Dr. Joseph Hill (University of Texas Southwestern Medical Center) for kindly providing the adenovirus coding for Foxo1–GFP.
Author contributions—S. J. R. and M. F. S. conceptualization; S. J. R. data curation; S. J. R. and M. F. S. formal analysis; S. J. R. and M. F. S. investigation; S. J. R. and M. F. S. methodology; S. J. R. writing-original draft; S. J. R. and M. F. S. writing-review and editing; M. F. S. resources; M. F. S. software; M. F. S. supervision; M. F. S. funding acquisition; M. F. S. visualization; M. F. S. project administration.
Funding and additional information—This work was supported by NIAMS, National Institutes of Health Grants R01-AR-056477 and R37-AR-055099. S.J.R. was partially supported by NIAMS, National Institutes of Health Training Grant T32 AR-007592 to the Interdisciplinary Program in Muscle Biology and NHLBI, National Institutes of Health Training Grant T32 HL-007698 to the Interdisciplinary Program in Cardiovascular Disease, University of Maryland School of Medicine. The content is solely the responsibility of the authors and does not necessarily represent the official views of the National Institutes of Health.
Conflict of interest—The authors declare that they have no conflicts of interest with the contents of this article.
- IGF
- insulin-like growth factor
- PI3K
- phosphatidylinositol 3-kinase
- NES
- nuclear export signal
- mTOR
- mammalian target of rapamycin
- mTORC
- mTOR complex
- PIP3
- phosphatidylinositol (3,4,5)-triphosphate
- I
- inhibitor
- FDB
- flexor digitorum brevis
- MEM
- minimum essential medium.
References
- 1. DeFronzo R. A., and Tripathy D. (2009) Skeletal muscle insulin resistance is the primary defect in type 2 diabetes. Diabetes Care 32, S157–S163 10.2337/dc09-S302 [DOI] [PMC free article] [PubMed] [Google Scholar]
- 2. Yanase T., Yanagita I., Muta K., and Nawata H. (2018) Frailty in elderly diabetes patients. Endocr. J. 65, 1–11 10.1507/endocrj.EJ17-0390 [DOI] [PubMed] [Google Scholar]
- 3. Janssen I., Heymsfield S. B., Wang Z. M., and Ross R. (2000) Skeletal muscle mass and distribution in 468 men and women aged 18−88 yr. J. Appl. Physiol. 89, 81–88 10.1152/jappl.2000.89.1.81 [DOI] [PubMed] [Google Scholar]
- 4. Xu H., Lamb G. D., and Murphy R. M. (2017) Changes in contractile and metabolic parameters of skeletal muscle as rats age from 3 to 12 months. J. Muscle Res. Cell Motil. 38(5–6), 405–420 [DOI] [PubMed] [Google Scholar]
- 5. Campbell E. L., Seynnes O. R., Bottinelli R., McPhee J. S., Atherton P. J., Jones D. A., Butler-Browne G., and Narici M. V. (2013) Skeletal muscle adaptations to physical inactivity and subsequent retraining in young men. Biogerontology 14, 247–259 10.1007/s10522-013-9427-6 [DOI] [PubMed] [Google Scholar]
- 6. Aihara M., Hirose N., Katsuta W., Saito F., Maruyama H., and Hagiwara H. (2017) A new model of skeletal muscle atrophy induced by immobilization using a hook-and-loop fastener in mice. J. Phys. Ther. Sci. 29, 1779–1783 10.1589/jpts.29.1779 [DOI] [PMC free article] [PubMed] [Google Scholar]
- 7. Tang L., Li N., Jian W., Kang Y., Yin B., Sun S., Guo J., Sun L., and Ta D. (2017) Low-intensity pulsed ultrasound prevents muscle atrophy induced by type 1 diabetes in rats. Skelet. Muscle 7, 29 10.1186/s13395-017-0145-7 [DOI] [PMC free article] [PubMed] [Google Scholar]
- 8. Imai K., Takai K., Watanabe S., Hanai T., Suetsugu A., Shiraki M., and Shimizu M. (2017) Sarcopenia impairs prognosis of patients with hepatocellular carcinoma: the role of liver functional reserve and tumor-related factors in loss of skeletal muscle volume. Nutrients 9, 1054 10.3390/nu9101054 [DOI] [PMC free article] [PubMed] [Google Scholar]
- 9. Cho K.-M., Park H., Oh D.-Y., Kim T.-Y., Lee K. H., Han S.-W., Im S.-A., Kim T.-Y., and Bang Y.-J. (2017) Skeletal muscle depletion predicts survival of patients with advanced biliary tract cancer undergoing palliative chemotherapy. Oncotarget 8, 79441–79452 10.18632/oncotarget.18345 [DOI] [PMC free article] [PubMed] [Google Scholar]
- 10. Čelutkienė J., Balčiūnas M., Kablučko D., Vaitkevičiūtė L., Blaščiuk J., and Danila E. (2017) Challenges of treating acute heart failure in patients with chronic obstructive pulmonary disease. Card. Fail. Rev. 3, 56–61 10.15420/cfr.2016:23:2 [DOI] [PMC free article] [PubMed] [Google Scholar]
- 11. Zhou X., Wang J. L., Lu J., Song Y., Kwak K. S., Jiao Q., Rosenfeld R., Chen Q., Boone T., Simonet W. S., Lacey D. L., Goldberg A. L., and Han H. Q. (2010) Reversal of cancer cachexia and muscle wasting by ActRIIB antagonism leads to prolonged survival. Cell 142, 531–543 10.1016/j.cell.2010.07.011 [DOI] [PubMed] [Google Scholar]
- 12. Newman A. B., Kupelian V., Visser M., Simonsick E. M., Goodpaster B. H., Kritchevsky S. B., Tylavsky F. A., Rubin S. M., and Harris T. B. (2006) Strength, but not muscle mass, is associated with mortality in the health, aging and body composition study cohort. J. Gerontol. A Biol. Sci. Med. Sci. 61, 72–77 10.1093/gerona/61.1.72 [DOI] [PubMed] [Google Scholar]
- 13. O'Neill B. T., Lee K. Y., Klaus K., Softic S., Krumpoch M. T., Fentz J., Stanford K. I., Robinson M. M., Cai W., Kleinridders A., Pereira R. O., Hirshman M. F., Abel E. D., Accili D., Goodyear L. J., et al. (2016) Insulin and IGF-1 receptors regulate FoxO-mediated signaling in muscle proteostasis. J. Clin. Invest. 126, 3433–3446 10.1172/JCI86522 [DOI] [PMC free article] [PubMed] [Google Scholar]
- 14. Garcia-Perez M. A., Pineda B., Hermenegildo C., Tarin J. J., and Cano A. (2009) Isopropanolic Cimicifuga racemosa is favorable on bone markers but neutral on an osteoblastic cell line. Osteoporos. Int. 4, 337–342 10.1186/s13395-017-0145-7 [DOI] [PubMed] [Google Scholar]
- 15. Arden K. C., and Biggs W. H. (2002) Regulation of the FoxO family of transcription factors by phosphatidylinositol-3 kinase–activated signaling. Arch. Biochem. Biophys. 403, 292–298 10.1016/S0003-9861(02)00207-2 [DOI] [PubMed] [Google Scholar]
- 16. Bodine S. C., Latres E., Baumhueter S., Lai V. K., Nunez L., Clarke B. A., Poueymirou W. T., Panaro F. J., Na E., Dharmarajan K., Pan Z. Q., Valenzuela D. M., DeChiara T. M., Stitt T. N., Yancopoulos G. D., et al. (2001) Identification of ubiquitin ligases required for skeletal muscle atrophy. Science 294, 1704–1708 10.1126/science.1065874 [DOI] [PubMed] [Google Scholar]
- 17. Gomes M. D., Lecker S. H., Jagoe R. T., Navon A., and Goldberg A. L. (2001) Atrogin-1, a muscle-specific F-box protein highly expressed during muscle atrophy. Proc. Natl. Acad. Sci. U.S.A. 98, 14440–14445 10.1073/pnas.251541198 [DOI] [PMC free article] [PubMed] [Google Scholar]
- 18. Sandri M., Sandri C., Gilbert A., Skurk C., Calabria E., Picard A., Walsh K., Schiaffino S., Lecker S. H., and Goldberg A. L. (2004) Foxo transcription factors induce the atrophy-related ubiquitin ligase atrogin-1 and cause skeletal muscle atrophy. Cell 117, 399–412 10.1016/S0092-8674(04)00400-3 [DOI] [PMC free article] [PubMed] [Google Scholar]
- 19. Sanchez A. M. J., Candau R. B., and Bernardi H. (2014) FoxO transcription factors: Their roles in the maintenance of skeletal muscle homeostasis. Cell. Mol. Life Sci. 71, 1657–1671 10.1007/s00018-013-1513-z [DOI] [PMC free article] [PubMed] [Google Scholar]
- 20. Kamei Y., Miura S., Suzuki M., Kai Y., Mizukami J., Taniguchi T., Mochida K., Hata T., Matsuda J., Aburatani H., Nishino I., and Ezaki O. (2004) Skeletal muscle FOXO1 (FKHR) transgenic mice have less skeletal muscle mass, down-regulated type I (slow twitch/red muscle) fiber genes, and impaired glycemic control. J. Biol. Chem. 279, 41114–41123 10.1074/jbc.M400674200 [DOI] [PubMed] [Google Scholar]
- 21. Zhao X., Gan L., Pan H., Kan D., Majeski M., Adam S. A., and Unterman T. G. (2004) Multiple elements regulate nuclear/cytoplasmic shuttling of FOXO1: characterization of phosphorylation- and 14-3-3-dependent and -independent mechanisms. Biochem. J. 378, 839–849 10.1042/BJ20031450 [DOI] [PMC free article] [PubMed] [Google Scholar]
- 22. Wimmer R. J., Liu Y., Schachter T. N., Stonko D. P., Peercy B. E., and Schneider M. F. (2014) Mathematical modeling reveals modulation of both nuclear influx and efflux of Foxo1 by the IGF-I/PI3K/Akt pathway in skeletal muscle fibers. Am. J. Physiol. Cell Physiol. 306, C570–C574 10.1152/ajpcell.00338.2013 [DOI] [PMC free article] [PubMed] [Google Scholar]
- 23. Van Der Heide L. P., Hoekman M. F. M., and Smidt M. P. (2004) The ins and outs of FoxO shuttling: mechanisms of FoxO translocation and transcriptional regulation. Biochem. J. 380, 297–309 10.1042/BJ20040167 [DOI] [PMC free article] [PubMed] [Google Scholar]
- 24. Brunet A., Kanai F., Stehn J., Xu J., Sarbassova D., Frangioni J. V., Dalal S. N., DeCaprio J. A., Greenberg M. E., and Yaffe M. B. (2002) 14-3-3 transits to the nucleus and participates in dynamic nucleocytoplasmic transport. J. Cell Biol. 156, 817–828 10.1083/jcb.200112059 [DOI] [PMC free article] [PubMed] [Google Scholar]
- 25. Tzivion G., Dobson M., and Ramakrishnan G. (2011) FoxO transcription factors: regulation by AKT and 14-3-3 proteins. Biochim. Biophys. Acta 1813, 1938–1945 10.1016/j.bbamcr.2011.06.002 [DOI] [PubMed] [Google Scholar]
- 26. Brent M. M., Anand R., and Marmorstein R. (2008) Structural basis for DNA recognition by FoxO1 and its regulation by post-translational modification. Structure 16, 1407–1416 [DOI] [PMC free article] [PubMed] [Google Scholar]
- 27. Schachter T. N., Shen T., Liu Y., and Schneider M. F. (2012) Kinetics of nuclear-cytoplasmic translocation of Foxo1 and Foxo3A in adult skeletal muscle fibers. Am. J. Physiol. Cell Physiol. 303, C977–C990 10.1152/ajpcell.00027.2012 [DOI] [PMC free article] [PubMed] [Google Scholar]
- 28. Yan L., Lavin V. A., Moser L. R., Cui Q., Kanies C., and Yang E. (2008) PP2A regulates the pro-apoptotic activity of FOXO1. J. Biol. Chem. 283, 7411–7420 10.1074/jbc.M708083200 [DOI] [PMC free article] [PubMed] [Google Scholar]
- 29. Fanzani A., Conraads V. M., Penna F., and Martinet W. (2012) Molecular and cellular mechanisms of skeletal muscle atrophy: an update. J. Cachexia. Sarcopenia Muscle 3, 163–179 10.1007/s13539-012-0074-6 [DOI] [PMC free article] [PubMed] [Google Scholar]
- 30. Mahajan K., Coppola D., Challa S., Fang B., Chen Y. A., Zhu W., Lopez A. S., Koomen J., Engelman R. W., Rivera C., Muraoka-Cook R. S., Cheng J. Q., Schönbrunn E., Sebti S. M., Earp H. S., et al. (2010) Ack1 mediated AKT/PKB tyrosine 176 phosphorylation regulates its activation. PLoS One 5, e9646 10.1371/journal.pone.0009646 [DOI] [PMC free article] [PubMed] [Google Scholar]
- 31. Halaby M. J., Hibma J. C., He J., and Yang D. Q. (2008) ATM protein kinase mediates full activation of Akt and regulates glucose transporter 4 translocation by insulin in muscle cells. Cell. Signal. 20, 1555–1563 10.1016/j.cellsig.2008.04.011 [DOI] [PubMed] [Google Scholar]
- 32. Liu Y., Russell S. J., and Schneider M. F. (2018) Foxo1 nucleo-cytoplasmic distribution and unidirectional nuclear influx are the same in nuclei in a single skeletal muscle fiber but vary between fibers. Am. J. Physiol. Cell Physiol. 314, C334–C348 [DOI] [PMC free article] [PubMed] [Google Scholar]
- 33. Liu Y., Hernandez-Ochoa E. O., Randall W. R., and Schneider M. F. (2012) NOX2-dependent ROS is required for HDAC5 nuclear efflux and contributes to HDAC4 nuclear efflux during intense repetitive activity of fast skeletal muscle fibers. Am. J. Physiol. Cell Physiol. 303, C334–C347 10.1152/ajpcell.00152.2012 [DOI] [PMC free article] [PubMed] [Google Scholar]
- 34. Shen T., Liu Y., Contreras M., Hernández-Ochoa E. O., Randall W. R., and Schneider M. F. (2010) DNA binding sites target nuclear NFATc1 to heterochromatin regions in adult skeletal muscle fibers. Histochem. Cell Biol. 134, 387–402 10.1007/s00418-010-0744-4 [DOI] [PMC free article] [PubMed] [Google Scholar]
- 35. Schertzer J. D., Plant D. R., and Lynch G. S. (2006) Optimizing plasmid-based gene transfer for investigating skeletal muscle structure and function. Mol. Ther. 13, 795–803 10.1016/j.ymthe.2005.09.019 [DOI] [PubMed] [Google Scholar]
- 36. Latres E., Amini A. R., Amini A. A., Griffiths J., Martin F. J., Wei Y., Lin H. C., Yancopoulos G. D., and Glass D. J. (2005) Insulin-like growth factor-1 (IGF-1) inversely regulates atrophy-induced genes via the phosphatidylinositol 3-kinase/Akt/mammalian target of rapamycin (PI3K/Akt/mTOR) pathway. J. Biol. Chem. 280, 2737–2744 10.1074/jbc.M407517200 [DOI] [PubMed] [Google Scholar]
- 37. Goulden B. D., Pacheco J., Dull A., Zewe J. P., Deiters A., and Hammond G. R. V. (2019) A high-avidity biosensor reveals plasma membrane PI(3,4)P2 is predominantly a class I PI3K signaling product. J. Cell Biol. 218, 1066–1079 10.1083/jcb.201809026 [DOI] [PMC free article] [PubMed] [Google Scholar]
- 38. Lauritzen H. P. M. M., Ploug T., Prats C., Tavaré J. M., and Galbo H. (2006) Imaging of insulin signaling in skeletal muscle of living mice shows major role of t-tubules. Diabetes 55, 1300–1306 10.2337/db05-1216 [DOI] [PubMed] [Google Scholar]
- 39. Mahajan K., Coppola D., Chen Y. A., Zhu W., Lawrence H. R., Lawrence N. J., and Mahajan N. P. (2012) Ack1 tyrosine kinase activation correlates with pancreatic cancer progression. Am. J. Pathol. 180, 1386–1393 10.1016/j.ajpath.2011.12.028 [DOI] [PMC free article] [PubMed] [Google Scholar]
- 40. Zhao X., Lv C., Chen S., and Zhi F. (2018) A role for the non-receptor tyrosine kinase ACK1 in TNF-α–mediated apoptosis and proliferation in human intestinal epithelial caco-2 cells. Cell Biol. Int. 42, 1097–1105 [DOI] [PubMed] [Google Scholar]
- 41. Mahajan K., and Mahajan N. P. (2010) Shepherding AKT and androgen receptor by Ack1 tyrosine kinase. J. Cell. Physiol. 224, 327–333 10.1002/jcp.22162 [DOI] [PMC free article] [PubMed] [Google Scholar]
- 42. Stitt T. N., Drujan D., Clarke B. A., Panaro F., Timofeyva Y., Kline W. O., Gonzalez M., Yancopoulos G. D., and Glass D. J. (2004) The IGF-1/PI3K/Akt pathway prevents expression of muscle atrophy–induced ubiquitin ligases by inhibiting FOXO transcription factors. Mol. Cell 14, 395–403 10.1016/S1097-2765(04)00211-4 [DOI] [PubMed] [Google Scholar]
- 43. Schiaffino S., and Mammucari C. (2011) Regulation of skeletal muscle growth by the IGF1-Akt/PKB pathway: insights from genetic models. Skelet. Muscle 1, 4 10.1186/2044-5040-1-4 [DOI] [PMC free article] [PubMed] [Google Scholar]
- 44. Alessi D. R., Andjelkovic M., Caudwell B., Cron P., Morrice N., Cohen P., and Hemmings B. A. (1996) Mechanism of activation of protein kinase B by insulin and IGF-1. EMBO J. 15, 6541–6551 10.1002/j.1460-2075.1996.tb01045.x [DOI] [PMC free article] [PubMed] [Google Scholar]
- 45. Liu Y., Cseresnyes Z., Randall W. R., and Schneider M. F. (2001) Activity-dependent nuclear translocation and intranuclear distribution of NFATc in adult skeletal muscle fibers. J. Cell Biol. 155, 27–39 10.1083/jcb.200103020 [DOI] [PMC free article] [PubMed] [Google Scholar]
- 46. Liu Y., Randall W. R., and Schneider M. F. (2005) Activity-dependent and -independent nuclear fluxes of HDAC4 mediated by different kinases in adult skeletal muscle. J. Cell Biol. 168, 887–897 10.1083/jcb.200408128 [DOI] [PMC free article] [PubMed] [Google Scholar]
Associated Data
This section collects any data citations, data availability statements, or supplementary materials included in this article.
Data Availability Statement
All data described are located within the article.


