Figure 6.
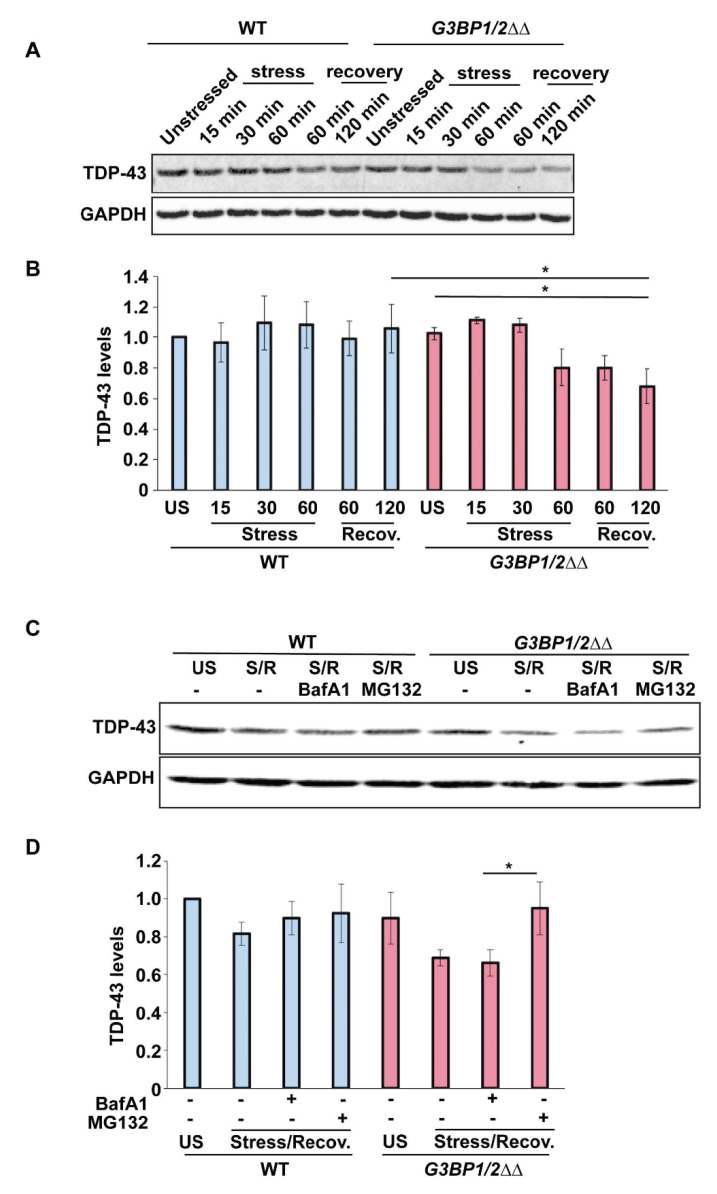
SG assembly correlates with maintenance of TDP-43 protein levels during stress recovery. (A) U2-OS (WT) and G3BP1/2ΔΔ cells were left unstressed, stressed with 0.5 mM sodium arsenite for 1 h or stressed with 0.5 mM sodium arsenite for 1 h followed by recovery for 2 h. Westerns were carried out to assess TDP-43 protein levels. (B) Quantitation of data in (A). Data generated from 3 biological replicates with mean ± s.d shown; TDP-43 levels were normalized to GAPDH loading controls. An ANOVA with Tukey’s post-hoc test was used to assess significance. (C) U2-OS (WT) and G3BP1/2ΔΔ cells were left unstressed (US), stressed with 0.5 mM sodium arsenite for 1 h, followed by recovery for 2 h (S/R). Proteasomal (10 μM MG132) and Lysosomal (0.5 μM Bafilomycin A1) inhibitors were added co-incident with arsenite addition. Westerns carried out as described in (A). (D) Quantitation of (C), as described in (B). An ANOVA with Tukey’s post-hoc test was used to assess significance (* indicates significance).

