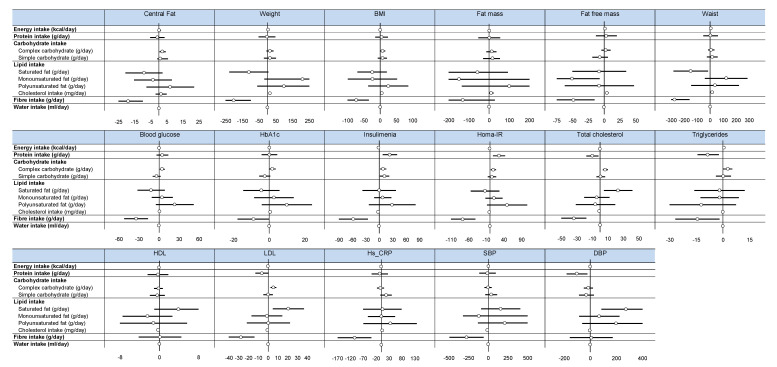
Figure 2.
Effect of nutritional factors on health outcomes—Forest plots represent effect sizes (dot) and their 95% confidence intervals (horizontal lines on both sides). For details, please see Supplementary Table l. Data are adjusted on age. The effect of each variable on the outcome is represented in the forest-plot by a dot on a horizontal line. The black dots represent the coefficient for each variable, and the length of each line around the dots represent its 95% confidence interval (95CI). The black solid vertical line represents the null estimate (with a value of 0). Horizontal lines that cross the null vertical line represent non-significant variables on the outcome. HbA1c: glycated hemoglobin; Homa-IR: Homeostatic Model Assessment of Insulin Resistance, HDL: high-density lipoprotein, LDL: low-density lipoprotein, Hs-CRP: high-sensitivity C—reactive protein. BMI: Body Mass Index. SBP: systolic blood pressure; DBP: diastolic blood pressure.

