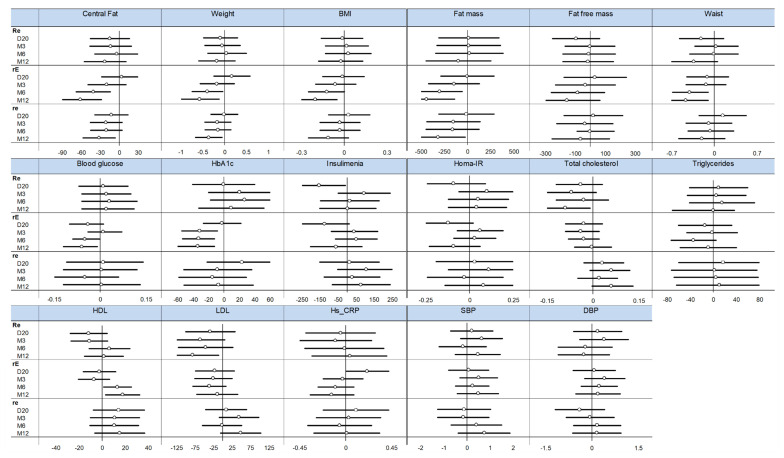
Figure 3.
Effect of fiber intake on health outcomes depending on time and group—Forest plots represent effect sizes (dot) and their 95% confidence intervals (horizontal lines on both sides). For details, please see Table S2. HbA1c: glycated haemoglobin; Homa-IR: Homeostatic Model Assessment of Insulin Resistance, HDL: high-density lipoprotein, LDL: low-density lipoprotein, Hs-CRP: high-sensitivity c-reactive protein. BMI: Body Mass Index. SBP: systolic blood pressure; DBP: diastolic blood pressure. Re, rE and re: see methods for details. D: day; M: month.

