

Abstract
Objective: To evaluate the safety of computerized physician order entry (CPOE) and associated clinical decision support (CDS) systems in electronic health record (EHR) systems at pediatric inpatient facilities in the US using the Leapfrog Group’s pediatric CPOE evaluation tool.
Methods: The Leapfrog pediatric CPOE evaluation tool, a previously validated tool to assess the ability of a CPOE system to identify orders that could potentially lead to patient harm, was used to evaluate 41 pediatric hospitals over a 2-year period. Evaluation of the last available test for each institution was performed, assessing performance overall as well as by decision support category (eg, drug-drug, dosing limits). Longitudinal analysis of test performance was also carried out to assess the impact of testing and the overall trend of CPOE performance in pediatric hospitals.
Results: Pediatric CPOE systems were able to identify 62% of potential medication errors in the test scenarios, but ranged widely from 23–91% in the institutions tested. The highest scoring categories included drug-allergy interactions, dosing limits (both daily and cumulative), and inappropriate routes of administration. We found that hospitals with longer periods since their CPOE implementation did not have better scores upon initial testing, but after initial testing there was a consistent improvement in testing scores of 4 percentage points per year.
Conclusions: Pediatric computerized physician order entry (CPOE) systems on average are able to intercept a majority of potential medication errors, but vary widely among implementations. Prospective and repeated testing using the Leapfrog Group’s evaluation tool is associated with improved ability to intercept potential medication errors.
Keywords: computerized physician order entry, patient safety, computer simulation, medication order entry, software testing, electronic health records
INTRODUCTION
The Institute of Medicine’s 1999 report “To Err Is Human” brought to light the significant problem of medical errors in modern medicine, estimating as many as 98 000 deaths annually in the United States as a result of medical errors that could have been prevented.1 In the years since, implementation of electronic health records (EHRs) has been promoted as a method to improve patient safety. Particular focus has been placed on the use of computerized physician order entry (CPOE) with associated clinical decision support (CDS) to reduce medication errors and subsequent adverse drug events (ADEs).
Children are particularly vulnerable to medication errors for multiple reasons: the use of weight-based or body surface area–based dosing, increased sensitivity to dosing errors, variable ability to metabolize and excrete medications, and limitations of CPOE that are often designed initially for an adult population.2–6 In the inpatient pediatric population, studies have reported medication errors in 5.7% of orders placed (compared to 5.3% of orders in a separate adult study), occurring in 6/100 admissions, and an analysis focusing on neonatal intensive care units revealed that 47% of medical errors in those units involved medications.4,7–9
As part of an effort to improve medical safety, leading patient safety experts working with the Leapfrog Group (www.leapfroggroup.org), a consortium of health care purchasers, developed an independent, inexpensive, and standardized tool embedded in its annual voluntary hospital survey to evaluate the performance of CPOE systems in reducing ADEs using simulated patient cases.10,11 The tool has been employed mainly in adult hospitals (over 1400 hospitals used it in 2015), and in previous publications CPOE evaluation tool scores were shown to be highly related to rates of preventable ADEs, with 4 fewer preventable ADEs per 100 admissions for every 5% increase in overall score.12 Use of CPOE for hospitalized children has demonstrated a reduction in some types of medication errors, but results have been variable. Early studies showed reductions in medication errors by 40–41% after implementation of CPOE, but later results showed more modest improvements.13–15 One study demonstrated an association between CPOE implementation and hospital-wide reduction in mortality, but it was not specifically associated with a reduction in medication errors.16 As previously shown by Metzger et al. using the CPOE evaluation tool in adult hospitals, much of the impact of CPOE on intercepting medication errors depends on the hospital-specific implementation and varies widely within a given vendor group of hospitals.17
To this end, we sought to evaluate the state of CPOE implementation in pediatric settings, but also to assess whether use of the CPOE evaluation tool could motivate further improvement within a given institution.
METHODS
The Leapfrog group’s CPOE evaluation tool
Development and validation of the Leapfrog CPOE evaluation tool has been described in detail previously.10,11,17 Briefly, the tool uses simulated patients with associated test orders to evaluate a CPOE’s ability to alert providers to potentially harmful medication errors. The tool evaluates both basic, commonly available decision support and more advanced clinical decision support (Table 1) and provides a onetime cross-sectional assessment of whether appropriate decision support is provided to a clinician entering an order. Both a pediatric and an adult version of the CPOE evaluation tool were created; only the pediatric version is evaluated here.
Table 1.
Clinical decision support categories
| Category | Description | |
|---|---|---|
| Basic decision support | Drug-drug interactions | Medication that results in known dangerous interaction when administered in combination with another medication in a new or existing order for the patient |
| Allergies and cross-allergies | Medication for which patient allergy or allergy to other drugs in same category has been documented | |
| Therapeutic duplication | Medication with therapeutic overlap with another new or active order; may be same drug or within drug class, or involve components of combination products | |
| Inappropriate single dose | Medication with a specified dose that exceeds recommended dose ranges | |
| Contraindicated route of administration | Order specifying a route of administration (eg, oral, intramuscular, intravenous) not appropriate for the identified medication | |
| Advanced decision support | Contraindication/dose limits based on patient diagnosis | Medication either contraindicated based on patient diagnosis or diagnosis affects appropriate dosing |
| Contraindication/dose limits based on laboratory studies | Medication either contraindicated for this patient based on laboratory studies or for which relevant laboratory results must be considered in appropriate dosing | |
| Cost of care in redundant testing | Laboratory test that duplicates a service within a time frame in which there are typically minimal benefits from repeating the test | |
| Monitoring | Intervention that requires an associated or secondary order to meet the standard of care (eg, prompt to order drug levels during medication ordering) | |
| Inappropriate cumulative (daily) dose | Medication for which a shortened dosing interval or repeated doses can lead to exceeding recommended daily dose limit | |
| Nuisance order | Order with such a mild or typically inconsequential interaction that clinicians typically ignore the advice provided; scoring is based on not causing an alert to be displayed for these orders |
Table courtesy of First Consulting Group
A hospital representative downloads and enters into the EHR a set of actual unsafe scenarios that include patient profiles, and then test orders are linked to the patient profiles. A clinician with experience using the institution’s CPOE application then enters the orders into the application and records what, if any, alerts or messages are presented. These results are then entered into the Leapfrog reporting website, and a score is determined and a report generated. Overall and categorical scores are then presented to the hospital. To prevent gaming of the system (ie, creating decision support “on the fly”), a number of control orders are included that are not expected to invoke any alerts, and the entire process can take no more than 6 hours, with many hospitals completing it more quickly.10,11,17 Hospitals that exceed the time threshold or report excess alerts on control orders are disqualified. Screenshots of sample patient profiles and test orders are included in Figures 1A and B.
Figure 1.

(A) Sample patient profiles used in the adult Leapfrog Group computerized physician order entry (CPOE) evaluation tool. Sample pediatric profiles were not available for public release but are similar. (B) Sample test orders used in the Leapfrog Group CPOE evaluation tool.
During the study period from February 2008 to December 2010, 41 institutions participated in testing the pediatric component of the Leapfrog CPOE evaluation tool. Information collected at the time of testing included hospital demographics, EHR vendor and date of implementation, and academic affiliation. Test results for individual testing categories, basic and advanced groupings (as described in Table 1), and overall scores were collected. Many hospitals underwent testing multiple times during the testing period, providing longitudinal results.
Data analysis
The first part of our study was an analysis of the last available test results for each individual institution. The last available test was chosen to be more reflective of the evolving state of CPOE implementation in the United States. Overall scores and the basic decision support grouping had a single mode with left tail extremes in their distribution, while the advanced decision support grouping had a normal distribution.
Nonparametric analysis to account for possible assumptions about the population distribution yielded almost identical results compared to standard parametric testing. For simplicity, parametric test results are displayed.
Overall scores were analyzed as the dependent variable using a linear regression model. Covariates included vendor, hospital type (pediatric or pediatric incorporated within a larger institution), and academic affiliation.
The second part of our study analyzed the effect on scores of the passage of time. Using a simple linear regression, we evaluated each hospital’s first test score as a function of time since CPOE implementation. We then evaluated the longitudinal progress of hospitals over repeated testing by establishing the first test date as time zero and then performing a linear mixed model to evaluate underlying trends as well as the effect of possible fixed factors such as academic affiliation, hospital type, and vendor.
RESULTS
Demographics of participating institutions
A large majority of hospitals completed the evaluation more than once (range 1– 4); the median number of tests was 2 and the mean per institution was 2.20, creating a total of 96 test results. Six evaluations were omitted because they exceeded a deception-analysis threshold based on the gaming detection strategies described, leaving a final tally of 90 test results to be analyzed. Excluded tests were reviewed and did not reveal findings that would have affected the outcome of the study. The rate of excluded tests (6 of 96) was lower than that reported in the Metzger study (10 of 81).17
A majority of hospitals evaluated (30 of 41, 73.2%) were freestanding pediatric institutions, and the remainder were general hospitals that also provide care for pediatric patients. Participating hospitals also tended to be affiliated with academic institutions (30 of 41, 73.2%) and were significantly larger when compared to the general size distribution of children’s hospitals in the United States (Table 2).
Table 3.
Overall scores and scores by category for last evaluation performed (n = 41)
| Decision support categories | Mean percent detected (95% confidence interval) |
|---|---|
| Basic decision support | |
| Drug-drug interactions | 60.1 (50.5–69.8) |
| Allergies and cross-allergies | 99.2 (98.0–100) |
| Therapeutic duplication | 52.0 (39.3–64.6) |
| Inappropriate single dose | 81.1 (72.7–89.5) |
| Contraindicated route of administration | 70.8 (61.2–80.5) |
| Advanced decision support | |
| Contraindication/dose limits based on patient diagnosis | 28.9 (17.0–40.7) |
| Contraindication/dose limits based on other laboratory studies | 56.1 (46.0–66.2) |
| Cost of care | 35.4 (22.0–48.7) |
| Monitoring | 38.0 (26.8–49.2) |
| Inappropriate cumulative (daily) dose | 70.2 (60.8–79.6) |
| Nuisance order | 39.0 (28.1–49.9) |
Table 2.
Demographics of hospitals evaluated (n = 41)
| Hospital size (beds) | Number (%) | Size of CHA member hospitals (%) |
|---|---|---|
| <50 | 2 (4.9) | 11.0 |
| 50–99 | 7 (17.1) | 20.3 |
| 100–199 | 8 (19.5) | 33.9 |
| 200–299 | 9 (22.0) | 14.4 |
| 300–399 | 10 (24.4) | 8.5 |
| 400–599 | 5 (12.2) | 9.3 |
| 600+ | 0 | 2.5 |
| Teaching | 30 (73.2) | |
| Pediatric only | 24 (58.5) | |
| Pediatric and adult | 6 (14.6) | |
| Non-teaching | 11 (26.8) | |
| Pediatric only | 6 (14.6) | |
| Pediatric and adult | 5 (12.2) |
National children’s hospital data courtesy of Children’s Hospital Association (CHA)
Descriptions of overall scores for last test
Overall, the institutions evaluated received an average score of 62.0% (95% CI, 57.9–66.1%) on their last test recorded. Scores ranged from a low of 22.7% to a high of 91.1%. The scores of the top 5 institutions were clustered relatively closely, from 76.1–91.1%, but the bottom 5 included 1 outlier and ranged from 22.7–46.8%. The single bottom outlier scored nearly 24% lower than the next lowest hospital and only identified order errors in the following categories: cost of care, drug allergies, and monitoring. It also scored well in the nuisance order category, likely because in this case very few alerts were displayed in general rather than with the improved specificity this category sought to assess. Notably, this hospital was using major EHR and medication reference database vendors.
Regarding the basic decision support group, the CPOE systems tested identified an average of 71.6% unsafe simulated scenarios (95% CI, 66.5–76.8%), but still with wide variation, ranging from 20–100%. Performance in the advanced decision support category was significantly lower, with an average score of 50.4% (95% CI, 46.0–54.8%). The overall, basic, and advanced category scores are displayed in Figure 2 as violin plots, a plot type that combines box plots and kernel density plots.18 A paired T-test comparing means of basic and advanced categories found a strongly significant difference (P < .0001, with an average difference of 21.2 percentage points).
Figure 2.
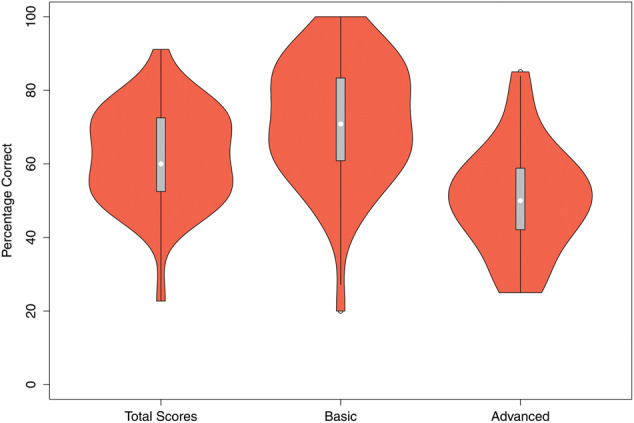
Violin plots, a plot type that combines box plots and kernel density plots, comparing total, basic, and advanced scores for last tests. Scores in the basic decision support group were significantly higher than in the advanced decision support group (P < .0001).
Linear regression
A linear model was performed with total score as the dependent variable and hospital type, EHR vendor, time since implementation, and academic affiliation as the independent variables. None of the examined variables were significantly associated with overall score. Scores by vendor are displayed in Figure 3. Because several vendors had only 1 installation, which may have reduced our ability to detect a difference between the major vendors, a secondary analysis was performed using only vendors with 5 hospitals or more, and there was still no significant difference. The calculated power needed to demonstrate a minimum difference of 10% between just the 3 largest vendor groups with a power of 0.8 and alpha of 0.05 would have required a sample size of 26 subjects per group (78 total).
Figure 3.
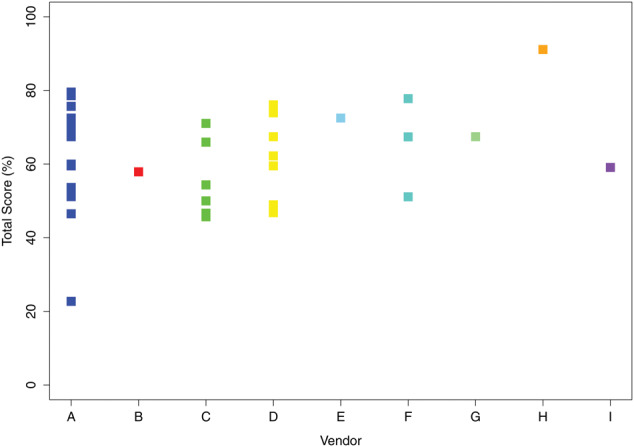
Scores by vendor: (A) n = 16, (B) n = 1, (C) n = 7, (D) n = 10, (E) n = 1, (F) n = 3, (G) n = 1, (H) n = 1, (I) n = 1.
Basic and advanced decision support
CPOE systems that underwent testing performed significantly better in the basic decision support grouping than in the advanced grouping. The most reliably identified errors were in the allergies and cross-allergies group, with an average score of 99.2%. A majority of hospitals also performed well regarding the inappropriate single dose (81.1%) and cumulative daily dose (70.2%) groups, and the contraindicated route of administration (70.8%). In the basic decision support categories, the poorest performance occurred with drug-drug interactions and therapeutic duplication. Simple linear regression between an institution’s performance in the basic and advanced CDS groups showed a significant association, R = 0.432 and P = .005 (Figure 4).
Figure 4.

Correlation between scores in basic and advanced decision support categories with fit line. R = 0.432 and P = .005.
Time since implementation analysis
There was a significant range across the institutions in time since EHR/CPOE implementation to first CPOE evaluation. The shortest period from implementation to testing was 39 days, and the longest was 12.5 years. On average, CPOE systems had been in place for 4.1 years. We anticipated that systems with CPOE in place longer would have higher scores upon initial testing, but using simple linear regression we found that time since implementation was not correlated with total score (P = .897, Figure 5). Regression analysis was also performed, analyzing the basic and advanced decision support groups independently as a function of time since implementation, and no correlation was observed (data not shown).
Figure 5.
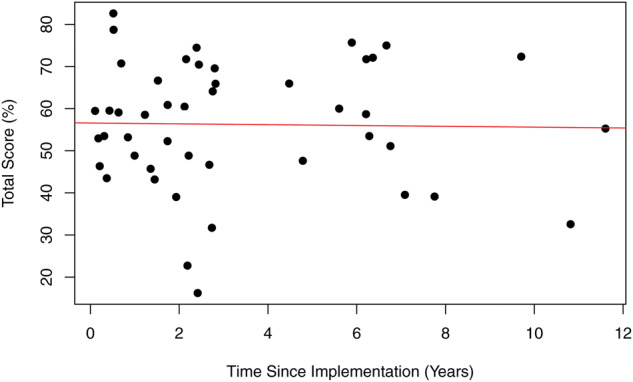
Total score on initial testing as a function of time since implementation of computerized physician order entry system.
Time zero analysis
Evaluation tools can not only document performance, but also, by providing feedback, spur further improvement. In order to evaluate the impact that prospective CPOE testing may have on performance, we assigned the initial date of testing for each institution as day zero and performed a linear mixed model of their performance in subsequent testing using academic affiliation, hospital type, and vendor as possible fixed factors. We included a random intercept within each hospital to account for correlated repeated measures. We found that from time zero, there was a significant upward trend in scores of 4.0% (95%CI, 1.2–6.9%) per year after initial testing (P = .008). Of the factors evaluated, only pediatric vs combined hospitals reached significance. In pediatric-only facilities, the upward trend was only 2.9%, whereas facilities with both adult and pediatric patients increased 11.1% per year during the study period (P = .03, Figure 6).
Figure 6.
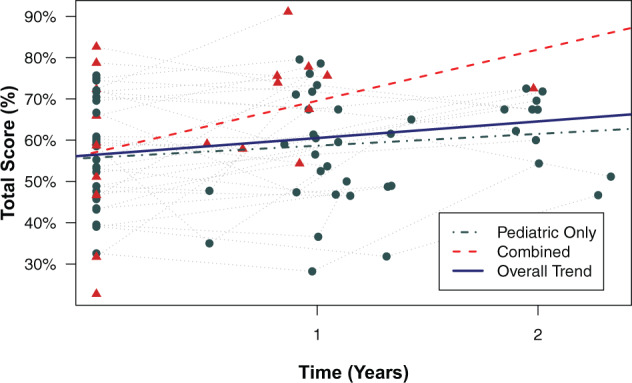
Longitudinal trends of overall test scores relative to initial test date (time zero). “Pediatric” (circles) refers to pediatric-only institutions, and “combined” (triangles) refers to pediatric hospitals within adult institutions.
DISCUSSION
Use of electronic health records and computerized physician order entry systems is becoming the standard of care in the Unites States, partly due to the Centers for Medicare and Medicaid Services’ Meaningful Use incentive program. HealthIT.gov reports that as of February 2015, over 90% of all eligible hospitals demonstrated meaningful use of certified health IT. Pediatric hospitals are lagging behind adult institutions in this regard at only 57%, but 90% of pediatric institutions are actively participating in the incentive program.19
With the increasing prevalence of CPOE systems in pediatric hospitals, more attention is being placed on the performance of the associated clinical decision support systems. Multiple studies looking at individual CPOE/CDS systems have shown decreases in medication prescription errors, potential adverse drug events, and actual ADEs after implementation.7,13,15,20 However, the effectiveness of CDS to identify actual unsafe scenarios has previously been shown to vary quite significantly among institutions, even those using the same EHR vendor.17 One descriptive study looking at CPOE implementation in a pediatric institution found an increased mortality rate after implementation; however, this may have been related less to the decision support aspect of CPOE than to the order entry and clinician workflow with the new system, particularly in critical care areas.21 Subsequent studies at other institutions looking at overall mortality rate found unchanged or even improved rates after CPOE implementation, perhaps having learned from the experience of other institutions.16,22 The Leapfrog CPOE evaluation tool allows institutions to evaluate their performance overall as well as to identify particular categories of decision support that may not be optimized in preventing high-impact, high-frequency safety problems.
In this study, we found that pediatric CPOE systems intercepted nearly two-thirds of medication errors using the Leapfrog evaluation tool. Results from testing pediatric CPOE systems from 2008 through the end of 2010 found higher rates of success at detecting ordering errors than was described in testing of adult CPOE systems during the same time frame.17 The average pediatric CPOE system was able to identify 62% of medication errors compared to 44.3% in the adult system. Although these tests are not directly comparable, as they contain different standardized orders and simulated patients for pediatric and adult populations, they do address the same major categories of clinical decision support with similar testing strategies.
Interestingly, we did not find academic affiliation, EHR vendor, or hospital type (pediatric-only vs combined) to be a significant predictor of performance on the Leapfrog test. However, because of our relatively smaller number of subjects (n = 41), this may be due to insufficient power to find such a difference. This is particularly true regarding EHR vendors; in 41 hospitals there were 9 different vendors, 5 of those with one hospital evaluated. However, eliminating vendors with 3 or fewer hospitals did not change the result. Regarding evaluation of decision support, linear regression between basic and advanced decision support scores showed a moderate positive relationship. Although not unexpected, this suggests that institutions that are making a significant commitment to improve basic decision support tools are also exploring more complex areas of clinical decision support.
Similar to the findings in the adult study, the category in which pediatric institutions performed best was identifying drug-allergy interactions, with over 99% of prescribing errors identified. Of particular importance to pediatric prescribing, the institutions tested performed well regarding both inappropriate single and cumulative dosing errors. Dosing is among the most critical sources of medication errors in the pediatric population, principally because of the need for weight- and age-based dosing that reflects the varied pharmacodynamics of children.4,7
One category that we postulate will become more important in the future is evaluation of CPOE/CDS for nuisance alerts. Many of the other categories are evaluated primarily on the sensitivity to recognize possible unsafe situations or errors. As we continue to build more advanced and comprehensive clinical support tools, it is important that we do not allow the pendulum to swing too far in the opposite direction, creating alert fatigue.23 One recent study at a UK hospital found that 89% of alerts were overridden by providers.24 Our study found that only 39% of test items in the nuisance category, on average, did not prompt an inappropriate alert, meaning that over 60% of the time for these medications, an alert so inconsequential that it is typically ignored is being displayed. The importance of tailoring interactions with the pediatric population to avoid nuisance alerts was recently underscored by an effort conducted by pediatric chief medical information officers to define a high-value set of pediatric-specific drug-drug interactions.25
One of our more unexpected findings was that time since EHR/CPOE implementation was not correlated positively with scores, either overall or within the basic/advanced decision support categories. We initially hypothesized that early adopters would have continued to develop decision support over the interval and would thus have superior scores. Instead, we found no relationship between time since implementation and the institution’s performance on initial Leapfrog testing.
However, we did find that after initiation of Leapfrog testing, hospitals improved on subsequent testing with a rate, on average, of 4 percentage points per year. It was notable that during our testing period, pediatric institutions improved at a significantly lower rate than the combined pediatric-adult institutions. We hypothesize that this may have been due to concern by pediatric institutions that existing CPOE decision support was primarily focused on adults rather than children, leading to reluctant adoption of these systems. Although it is difficult to determine whether there was a preexisting upward trend prior to testing, given the lack of association of scores with time since implementation, we believe that the scores and feedback provided to the institutions may be responsible for initiating these subsequent improvements. This adds credence to the belief that regular prospective testing and feedback with tools such as the Leapfrog pediatric CPOE evaluation tool is essential to continued improvement of CDS systems.26 A possible counterpoint to this is that standardized tests encourage institutions to “study for the test by taking it,” and this may falsely increase their scores on subsequent testing. However, because Leapfrog testing results provide categorical scores rather than specific question scores, and repeat testing may include different test items, improvement relies more on systemic changes than on spot fixes.
As we now look beyond simply meeting meaningful use requirements, there is an increased focus on how best to utilize EHRs and CPOE in operational systems to improve patient safety.27–30 In our study, we found that although the pediatric institutions tested are identifying over 60% of simulated ordering errors and are consistently improving, areas in need of significant improvement remain, particularly within the advanced clinical decision support areas.
Limitations of this study include the inherent sampling bias that is present with a voluntary testing tool. Our hospitals tended to be large, academic, pediatric-only institutions. The pediatric Leapfrog CPOE evaluation tool was only used in a small number of community hospitals and did not assess ordering for pediatric patients in nonpediatric facilities. According to weighted national estimates for hospitalizations of children 0–17 years of age gathered by the Agency for Healthcare Research and Quality’s H-CUP KID (Healthcare Cost and Utilization Program Kids’ Inpatient Database), nearly 70% of pediatric discharges are from non–children’s hospitals.31 Thus, evaluating nonpediatric hospitals using the pediatric evaluation tool will be important in the future. Our evaluations were also limited by the relatively smaller number of hospitals participating. In addition, these data reflect the state of CPOE/CDS systems in the period 2008–2010. We anticipate that, given the trends we observed, the current state of decision support for medication ordering will be advanced from the numbers we provide. Lastly, CPOE/CDS systems are themselves generating new issues that had not been anticipated (recently elaborated by Schiff et al.32), and future iterations of the Leapfrog tool will have to adapt to address these issues.
CONCLUSIONS
These findings provide a cross-sectional analysis of pediatric CPOE/CDS systems using the validated Leapfrog Group CPOE evaluation tool. We found that pediatric CPOE systems are able to intercept 62% of potential medication errors, on average, but vary widely among implementations. We also found that pediatric CPOE systems showed significant improvement in test scores of 4% per year with repeated testing using the Leapfrog tool, suggesting that repeated evaluations of CPOE/CDS systems may lead to improved ability to intercept potential medication errors.
CONTRIBUTORS
JDC, DCC, and CAL made significant contributions to the conception and design of the work and interpretation of results. MD, DCS, and DCC made significant contributions to the acquisition of data used for analysis. JDC performed data processing and data analysis. All authors contributed to drafting or revising the manuscript, approved the version to be published, and agree to be accountable for all aspects of the work.
FUNDING
This work was supported by National Library of Medicine grant number T15LM011271 and Agency for Healthcare Research and Quality grant number 1R01HS023696-01.
COMPETING INTERESTS
DCS and DCC both have partial employment at Pascal Metrics Inc. MD is employed by the Leapfrog Group.
REFERENCES
- 1. Institute of Medicine. To Err Is Human: Building a Safer Health System. In: LT Kohn, JM Corrigan, MS Donaldson, eds. To Err Is Human: Building a Safer Health System. Washington, DC; 2000. [Google Scholar]
- 2. Davis T. Paediatric prescribing errors. Arch Dis Childhood 2011;96(5):489–91. [DOI] [PubMed] [Google Scholar]
- 3. Fortescue EB, Kaushal R, Landrigan CP, et al. Prioritizing strategies for preventing medication errors and adverse drug events in pediatric inpatients. Pediatrics 2003;111(4 Pt 1):722–9. [DOI] [PubMed] [Google Scholar]
- 4. Kaushal R, Bates DW, Landrigan C, et al. Medication errors and adverse drug events in pediatric inpatients. JAMA 2001;285(16):2114–20. [DOI] [PubMed] [Google Scholar]
- 5. Koren G, Barzilay Z, Greenwald M. Tenfold errors in administration of drug doses: a neglected iatrogenic disease in pediatrics. Pediatrics 1986;77(6):848–49. [PubMed] [Google Scholar]
- 6. Walsh KE, Kaushal R, Chessare JB. How to avoid paediatric medication errors: a user's guide to the literature. Arch Dis Childhood 2005;90(7):698–702. [DOI] [PMC free article] [PubMed] [Google Scholar]
- 7. Holdsworth MT, Fichtl RE, Behta M, et al. Incidence and impact of adverse drug events in pediatric inpatients. Arch Pediatrics Adolesc Med 2003;157(1):60–5. [DOI] [PubMed] [Google Scholar]
- 8. Suresh G, Horbar JD, Plsek P, et al. Voluntary anonymous reporting of medical errors for neonatal intensive care. Pediatrics 2004;113(6):1609–18. [DOI] [PubMed] [Google Scholar]
- 9. Bates DW, Boyle DL, Vander Vliet MB, et al. Relationship between medication errors and adverse drug events. J Gen Intern Med 1995;10(4):199–205. [DOI] [PubMed] [Google Scholar]
- 10. Classen DC, Avery AJ, Bates DW. Evaluation and certification of computerized provider order entry systems. J Am Med Inform Assoc 2007;14(1):48–55. [DOI] [PMC free article] [PubMed] [Google Scholar]
- 11. Kilbridge PM, Welebob EM, Classen DC. Development of the Leapfrog methodology for evaluating hospital implemented inpatient computerized physician order entry systems. Qual Saf Health Care 2006;15(2):81–4. [DOI] [PMC free article] [PubMed] [Google Scholar]
- 12. Leung AA, Keohane C, Lipsitz S, et al. Relationship between medication event rates and the Leapfrog computerized physician order entry evaluation tool. J Am Med Inform Assoc 2013;20(e1):e85–90. [DOI] [PMC free article] [PubMed] [Google Scholar]
- 13. Potts AL, Barr FE, Gregory DF, et al. Computerized physician order entry and medication errors in a pediatric critical care unit. Pediatrics 2004;113(1 Pt 1):59–63. [DOI] [PubMed] [Google Scholar]
- 14. King WJ, Paice N, Rangrej J, et al. The effect of computerized physician order entry on medication errors and adverse drug events in pediatric inpatients. Pediatrics 2003;112(3 Pt 1):506–9. [DOI] [PubMed] [Google Scholar]
- 15. Walsh KE, Landrigan CP, Adams WG, et al. Effect of computer order entry on prevention of serious medication errors in hospitalized children. Pediatrics 2008;121(3):e421–7. [DOI] [PubMed] [Google Scholar]
- 16. Longhurst CA, Parast L, Sandborg CI, et al. Decrease in hospital-wide mortality rate after implementation of a commercially sold computerized physician order entry system. Pediatrics 2010;126(1):14–21. [DOI] [PubMed] [Google Scholar]
- 17. Metzger J, Welebob E, Bates DW, et al. Mixed results in the safety performance of computerized physician order entry. Health Affairs 2010;29(4):655–63. [DOI] [PubMed] [Google Scholar]
- 18. Hintze JL, Nelson RD. Violin Plots: a box plot-density trace synergism. Am Statis 1998;52(2):181–4. [Google Scholar]
- 19. Office of the National Coordinator for Health Information Technology. Hospital Progress to Meaningful Use by Size, Type, and Urban/Rural Location, Health IT Quick-Stat #5.2015[cited May 2016]. Available at: dashboard.healthit.gov/quickstats/pages/FIG-Hospital-Progress-to-Meaningful-Use-by-size-practice-setting-area-type.php. Accessed May 5, 2016. [Google Scholar]
- 20. Kazemi A, Ellenius J, Pourasghar F, et al. The effect of Computerized Physician Order Entry and decision support system on medication errors in the neonatal ward: experiences from an Iranian teaching hospital. J Med Syst 2011;35(1):25–37. [DOI] [PubMed] [Google Scholar]
- 21. Han YY, Carcillo JA, Venkataraman ST, et al. Unexpected increased mortality after implementation of a commercially sold computerized physician order entry system. Pediatrics 2005;116(6):1506–12. [DOI] [PubMed] [Google Scholar]
- 22. Del Beccaro MA, Jeffries HE, Eisenberg MA, et al. Computerized provider order entry implementation: no association with increased mortality rates in an intensive care unit. Pediatrics 2006;118(1):290–5. [DOI] [PubMed] [Google Scholar]
- 23. Carspecken CW, Sharek PJ, Longhurst C, et al. A clinical case of electronic health record drug alert fatigue: consequences for patient outcome. Pediatrics 2013;131(6):e1970–3. [DOI] [PubMed] [Google Scholar]
- 24. Jani YH, Barber N, Wong IC. Characteristics of clinical decision support alert overrides in an electronic prescribing system at a tertiary care paediatric hospital. Int J Pharm Pract 2011;19(5):363–66. [DOI] [PubMed] [Google Scholar]
- 25. Harper MB, Longhurst CA, McGuire TL, et al. Core drug-drug interaction alerts for inclusion in pediatric electronic health records with computerized prescriber order entry. J Patient Saf 2014;10(1):59–63. [DOI] [PubMed] [Google Scholar]
- 26. Wright A, Aaron S, Sittig DF. Testing electronic health records in the “production” environment: an essential step in the journey to a safe and effective health care system. J Am Med Inform Assoc 2016. [DOI] [PMC free article] [PubMed] [Google Scholar]
- 27. Institute of Medicine. Committee on Patient Safety and Health Information Technology. Health IT and Patient Safety: Building Safer Systems for Better Care. Washington, DC: National Academies Press; 2012. [PubMed] [Google Scholar]
- 28. Office of the National Coordinator for Health Information Technology. Health Information Technology Patient Safety Action & Surveillance Plan. 2013. Available at: https://www.healthit.gov/sites/default/files/safety_plan_master.pdf. Accessed June 1, 2016. [Google Scholar]
- 29. Sittig DF, Ash JS, Singh H. The SAFER guides: empowering organizations to improve the safety and effectiveness of electronic health records. Am J Manag Care 2014;20(5):418–23. [PubMed] [Google Scholar]
- 30. Office of the National Coordinator for Health Information Technology. SAFER Guides. 2014[cited May 27, 2016]. Available at: https://www.healthit.gov/safer/. Accessed May 5, 2016. [Google Scholar]
- 31. Agency for Healthcare Research and Quality. Weighted National Estimates for Children 0-17 Years from HCUP Kids' Inpatient Database. 2012. Available at:http://hcupnet.ahrq.gov/HCUPnet.jsp?Parms=H4sIAAAAAAA AAKtILE4sTPTzDDY08vZ0SctKS3NJykwqTioISUpMSkrNTE0OSswEwTQ4yEx LBQDnL6EnNgAAAAAAB88C4A3771705F6E6A21AD4D6F3BB34853B318. Accessed May 5, 2016. [Google Scholar]
- 32. Schiff GD, Hickman TT, Volk LA, et al. Computerised prescribing for safer medication ordering: still a work in progress. BMJ Qual Saf 2016;25(5):315–9. [DOI] [PubMed] [Google Scholar]