

Abstract
Introduction:
As per the National Family Health Survey (NFHS) 2015-16, 35.7% children below 5 years of age are underweight. In light of Malnutrition rates still remaining alarming in children, it becomes pertinent to elicit the factors that affect nutritional status of children. So, this study was undertaken.
Materials and Methods:
After obtaining ethical approval from institutional ethics committee, data were collected on a pretested questionnaire. Information from mothers of 1085 children attending Anganwadi center in an urban block of Patiala was collected and analyzed.
Results:
Among females, 35.85% were underweight, whereas the proportion for males was 28.68%. The proportion among immunized children who were underweight was 31.34%, whereas the proportion among unimmunized children was 38.91%. Those who received supplementary nutrition were also in more in numbers in normal weight range than those who did not.
Conclusion:
Gender, birth order, and immunization status of child are significantly associated with nutritional status. This study showed that prevalence of malnutrition was less among those who received supplementary nutrition as compared to ones who did not.
Keywords: Anganwadi, nutritional status, socio-demographic factors, underweight children
Introduction
India is the second most populous country having approximately 1.3 billion population and also is home to 190 million undernourished people––the highest in the world. Moreover, two of three preschool children in India are malnourished.[1,2] Malnutrition is defined as a pathological state resulting from a relative or absolute deficiency or excess of one or more essential nutrients.[3] Undernutrition is a condition which results from insufficient food eaten over an extended period of time.[4] As per World Health Organization (WHO) Report, approximately 45% of deaths among children under 5 years of age are linked to undernutrition,[3] as malnutrition presents with serious, long-term consequences impeding motor, sensory, cognitive, social, and emotional development.[5]
Although the concern of overweight children between the ages of 5 and 19 has augmented almost 10 times over the past 4 decades across the world, Indian children remain underweight. Only 1 in 10 Indian children aged 6–23 months get adequate diet and 35.7% of children below 5 years of age are underweight as per the National Family Health Survey (NFHS) 2015-16.[6]
Government of India started Integrated Child Development Services (ICDS) Scheme in 1975 so as to meet nutritional requirement of children of 0–6 years of age and lead to holistic development as the services provided under scheme include nonformal preschool education also along with provision of supplementary nutrition.
In light of Malnutrition rates still remaining alarming in children below 6 years of age, therefore, it becomes pertinent to elicit the factors that affect nutritional status of children. So, to estimate prevalence of undernutrition and sociodemographic factors responsible for it, this study was undertaken.
Materials and Methods
Study area
Urban ICDS Block of Patiala, Punjab (54 Anganwadi centers [AWCs]).
Study population
Registered Beneficiary children aged 0–6 years.
Study design
A cross-sectional observational community-based study.
Study period
One-year commencing from January 2, 2017 to December 31,2017.
Study sample
Applying formula N = 4pq/l2, where
P is the proportion of event in the population (27% of underweight children as per NFHS-3 data),
L is the margin of error (10% of p) = (0.1*0.27),
Q = 1–p (1–0.27) = 0.73, and
N = 4pq/l2
=4*0.27*0.73/.027*0.027 = 1081.48, rounded of to 1085.
Inclusion criteria
Registered beneficiary children aged 0–6 years whose parents gave consent to participate in the study.
Exclusion criteria
Children who were not available for two consecutive visits at the time of data collection.
Study tool
For assessing nutritional status of 0–6 year's children, weight for age was taken for every child included in the study. Weight was recorded using standard weighing scale and infant weighing scale as the case may be. For accuracy of weights, scales were calibrated from time to time to remove error and weight was recorded with minimal clothing.
Methodology
From the sampling frame of 222 AWCs by adopting systematic random sampling technique every 4th AWC was selected from urban block of Patiala, thus making a total of 54 AWCs. From each selected AWC, 20 registered beneficiaries (0–6 years) were selected by adopting simple random technique using lottery method.
Statistical analysis
Data were analyzed using Epi-info 7. Pearson Chi-square test was used to ascertain association between variables.
Ethical approval
Due clearance was obtained from the Institutional Ethics committee on 29.11.2016 and permission to conduct the study was taken from Program officer and Child Development Project Officer (CDPO) of the concerned ICDS block.
Results
Data showed that majority 510 (47.00%) of the mothers were in the age group of 26–30 years, followed by 459 (42.30%) in 21–25 years of age and 79.08% belonging to Hindu religion Tables 1, 2 and Figure 1.
Table 1.
Distribution of children according to their nutritional status in relation to their age (n=1085)
| Age groups (in months) | Nutritional status (according to ICDS growth chart) | Total | ||
|---|---|---|---|---|
| Normal | Moderately underweight | Severely underweight | ||
| 06-11 | 5 (62.50%) | 2 (25.00%) | 1 (12.50%) | 8 (0.74%) |
| 12-23 | 157 (68.26%) | 57 (24.78%) | 16 (6.96%) | 230 (21.20%) |
| 24-35 | 245 (67.68%) | 78 (21.55%) | 39 (10.77%) | 362 (33.36%) |
| 36-47 | 208 (67.31%) | 80 (25.89%) | 21 (6.80%) | 309 (28.48%) |
| 48-59 | 77 (65.25%) | 35 (29.66%) | 6 (5.09%) | 118 (10.88%) |
| 60-71 | 41 (70.69%) | 12 (20.69%) | 5 (8.62%) | 58 (5.34%) |
Table 2.
Distribution of children according to their nutritional status and educational status of their mothers (n=1085)
| Education of mother | Nutritional status (according to ICDS growth chart) | Total | ||
|---|---|---|---|---|
| Normal | Moderately underweight | Severely underweight | ||
| Illiterate | 294 (68.37%) | 104 (24.19%) | 32 (7.44%) | 430 (39.63%) |
| Primary | 191 (69.20%) | 62 (22.46%) | 23 (8.34%) | 276 (25.44%) |
| Middle | 103 (61.68%) | 48 (28.74%) | 16 (9.58%) | 167 (15.39%) |
| Matriculate | 123 (70.28%) | 39 (22.29%) | 13 (7.43%) | 175 (16.13%) |
| Graduate or above | 22 (59.46%) | 11 (29.73%) | 4 (10.81%) | 37 (3.41%) |
χ2=5.1708, df 8, P=0.7392 (nonsignificant)
Figure 1.

Distribution of children in relation to their age
Parity of mother, gender and immunization status of child, all these factors were found to be significantly associated with nutritional status of child [Table 3]. However nutritional status was not significantly associated with socio economic status of family and whether the child received supplementary nutrition or not [Figure 2].
Table 3.
Distribution of children according to their nutritional status and association with various factors (n=1085)
| Parity, no. of mothers, (%) | Nutritional status (according to ICDS growth chart) | |||
|---|---|---|---|---|
| Normal | Moderately underweight | Severely underweight | ||
| ONE, 371 (34.19%) | 242 (65.23%) | 93 (25.07%) | 36 (9.70%) | |
| TWO,533 (49.13%) | 365 (68.48%) | 121 (22.70%) | 47 (8.82%) | χ2=21.55, df 4, P<0.001 (HS) |
| ≥THREE, 181 (16.68%) | 126 (69.61%) | 50 (27.62%) | 5 (2.77%) | |
| Gender of child no. of mothers, (%) | ||||
| Male 516 (47.56%) | 368 (71.32%) | 116 (22.48%) | 32 (6.20%) | χ2=7.866, df 2, P=0.0196 (HS) |
| Female 569 (52.44%) | 365 (64.15%) | 148 (26.01%) | 56 (9.84%) | |
| Immunization up-to-date no. of mothers, (%) | ||||
| Yes 903 (83.23%) | 620 (68.66%) | 223 (24.70%) | 60 (6.64%) | χ2=10.374, df 2, P<0.01 (HS) |
| No182 (16.77%) | 113 (62.09%) | 41 (22.53%) | 28 (15.38%) | |
| SNP received, no. of mothers, (%) | ||||
| Yes 521 (48.02%) | 370 (71.02%) | 115 (22.07%) | 36 (6.91%) | χ2=5.6595, df 2, P=0.0590 (N S) |
| No 521 (48.02%) | 363 (64.36%) | 149 (26.42%) | 52 (9.22%) | |
HS: highly significant; NS: nonsignificant
Figure 2.
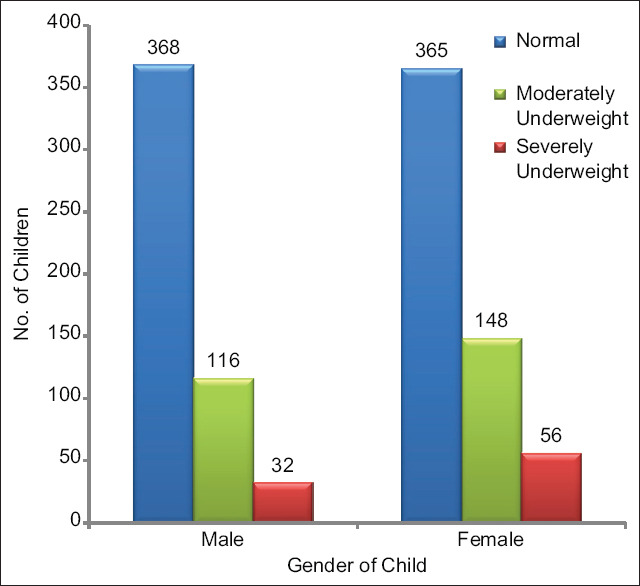
Distribution of children according to their nutritional status
Discussion
Nutrition of preschool children is of paramount importance as they are at greater risk of malnutrition because of the fact that growing period demands high intake of proteins and calories.[7] Also, this is the time for the foundation of life time health, strength, and intellectual vitality.[8] This study was thus undertaken to assess the nutritional status of 1085 (0–6 year) children attending AWCs, in an Urban block of Patiala during the calendar year 2017. It becomes imperative for a physician providing primary care to assess and understand factors affecting nutritional status among children so as to address these in an appropriate manner.
Maximum numbers of mothers (47%) in this study were between the ages of 26 and 30 years, followed by 42.3% in 21–25 years age group. A study conducted by Bhagat et al.[9] reported similar results, in which 70.7% belonged to the age group of 21–30 years.
In this study, it was observed that majority (79.8%) of beneficiaries belonged to Hindu religion contrary to predominance of Sikh religion in local population. Similar results were reported in different studies. Radhamani et al.[2] in Kerala found that 87% belonged to Hindu religion.
Maternal educational status has a major role in prevention of underweight among preschool children. In this study, it was found that 39.63% of mothers were illiterate, followed by 25.44% who were educated till 5th class. Educational status of mothers was not significantly associated with nutritional status of their children in this study (P = 0.73). Discordant studies in this aspect were by Anitha et al.[10] in Kerala and Stalin et al.[5] in Tamil Nadu which reported that majority, that is, 55.3% and 95%, had completed up to high school. The difference in figures could be due to high literacy rate in South India as compared to our state. Studies by Dhone et al.[11] and Jakhar et al.,[12] revealed that education of the mother was a significant variable in predicting nutritional status of children.
This study also observed that majority, 33.36%, of children were from the age group of 24–35 months followed by 28.48% in 36–47 months of age. Least proportion of children, that is, 0.74%, were seen in the age group of 6–11 months. However, the nutritional status of children was not associated with their age (P > 0.05). Discordant results from a study conducted by Dhone et al.[11] revealed that age was significantly associated with malnutrition.
Association of the nutritional status of children with parity of mothers was found to be significant (P < 0.05). Studies conducted by Swami et al.[13] in urban, rural, and slum areas of Chandigarh revealed that with increase in family size, the prevalence of malnutrition also significantly increased.
In this study, a significant association was observed between the gender of child and their nutritional status (P = 0.0196). Dhone et al.[11] in urban slum of Pune showed that undernutrition was significantly higher (P < 0.001) among boys than girls, which was contrary to our results. Other study conducted by Baghel et al.[14] revealed that female children were at higher risk of being undernourished similar to findings in this study.
The association of immunization status of children with their nutritional status was found to be statistically significant (P < 0.01). The study conducted Moluguri et al.[15] reported that 87.6% children were completely immunized.
This study showed that prevalence of malnutrition was less among those who received SNP as compared to ones who did not but association was found to be statistically nonsignificant in our study (P = 0.0590). However Joseph et al.[16] conducted a study in four districts of Kerala and found that proportion (15.0%) of underweight children was high in children who did not receive SNP as compared to the proportion (12.5%) of underweight children among those who received SNP (P < 0.05).
We found that gender of child, whether they were immunized or not, and birth order were significantly associated with nutritional status of child. ICDS services play a role in providing these services to the beneficiaries. Kshirsagar et al. also concluded in a similar manner stating that who were not under ambit of ICDS services, mortality, poor immunization status, and prevalence of undernutrition were high among those. They concluded by stating that Anganwadi is the best place for a mother to have good child growth and development, so there is need to stress upon better awareness generation regarding use of these services by community.[17]
Conclusion
Gender, birth order, and immunization status of child are significantly associated with nutritional status. Also, this study showed that prevalence of malnutrition was less among those who received supplementary nutrition as compared to ones who did not.
Declaration of patient consent
The authors certify that they have obtained all appropriate patient consent forms. In the form the patient(s) has/have given his/her/their consent for his/her/their images and other clinical information to be reported in the journal. The patients understand that their names and initials will not be published and due efforts will be made to conceal their identity, but anonymity cannot be guaranteed.
Financial support and sponsorship
Nil.
Conflicts of interest
There are no conflicts of interest.
References
- 1.6 years and below population of children. Available from: http://censusindiagovin/Census_Data_2001/India_at_glance/broadaspx .
- 2.Radhamani KV, Rajeev SV. A study on nutritional status of Anganwadi children in a rural area of North Kerala. Indian J Child Health. 2017;4:348–51. [Google Scholar]
- 3.Definition of Malnutrition. Available from: http://wwwwhoint/news-room/fact-sheets/detail/malnutrition .
- 4.Park K. Park's Textbook of Preventive and Social Medicine. 15th ed. M/s Banarsidas Bhanot; 2004. Malnutrition; p. 427. [Google Scholar]
- 5.Stalin P, Bazroy J, Dimri D, Singh Z, Senthilvel V, Sathyanarayanan S. Prevalence of underweight and its risk factors among under five children in a rural area of Kancheepuram District in Tamil Nadu, India. IOSR-J Dental Med Sci. 2013;3:71–4. [Google Scholar]
- 6.Only 1 In 10 Indian Children Aged 6-23 Months Gets Adequate Diet. Available from: http://wwwindiaspendcom/cover-story/only-1-in-10-indian- children-aged-6-23-months-gets-adequate-diet-41066 .
- 7.Goel MK, Mishra R, Gaur DR, Das A. Nutrition surveillance in 1-6 years old children in urban slums of a city in northern India. Internet J Epidemiol. 2007;5:1–4. [Google Scholar]
- 8.Jood S, Bishnoi S, Sehgal S. Nutritional status of rural pre-school children of Haryana State. Indian J Pediatr. 2000;67:189–96. doi: 10.1007/BF02723661. [DOI] [PubMed] [Google Scholar]
- 9.Bhagat VM. Availability and utilization of Anganwadi services in an adopted urban area of Wardha. Online J Health Allied Sci. 2016;14:1–4. [Google Scholar]
- 10.Anitha SS, Jayasree AK. Prevalence of underweight among preschool children attending anganwadi in Kannur district, Kerala, India. Int J Community Med Public Health. 2017;4:2361–5. [Google Scholar]
- 11.Dhone AB, Chitnis UB, Bhawalkar JS, Sudhir L. Epidemiological study of under nutrition among under five years children in an urban slum. Medical J DY Patil Vidyapeeth. 2012;5:110–3. [Google Scholar]
- 12.Jakhar P. Nutritional status of children in rural Haryana: A cross-sectional analysis. Indian J Matern Child Health. 2011;13:11. [Google Scholar]
- 13.Swami HM, Thakur JS, Bhatia SP, Singh K, Bhan VK, Bhatia V. National immunization day to assess nutritional status of underfives in Chandigarh. Indian J Pediatr. 2000;67:15–7. doi: 10.1007/BF02802627. [DOI] [PubMed] [Google Scholar]
- 14.Baghel AS, Kale S, Verma A, Chourasiya SK. Study of nutritional status of children attending Anganwadi centers of a district in central India. Natl J Community Med. 2018;9:546–55. [Google Scholar]
- 15.Moluguri A, Gayathry D, Gurnule S. A study on health and nutritional status of children in rural and urban ICDS projects in Karimnagar. Int J Community Med Public Health. 2019;6:1747–53. [Google Scholar]
- 16.Joseph JE, Singh M, Mathew S. Efficacy of the Integrated Child Development Service scheme in background of dietetic condition and development string in chosen district of Kerala State (India) Am J Adv Nurs Res. 2015;2:7–11. [Google Scholar]
- 17.Kshirsagar VY, Mohite RV. Impact of integrated child development services (ICDS) on morbidity status of children and knowledge, attitude, and practice of mothers towards ICDS: A comparative study. Indian J Child Health. 2019;6:69–73. [Google Scholar]