

Abstract
Aim:
To study the intraocular pressure (IOP) and tear production changes in uncomplicated pregnant women at term pregnancy and immediate postpartum.
Materials and methods:
The patients admitted in the Department of Obstetrics and Gynaecology for delivery were included in the study. A total of 106 participants who were at term uncomplicated pregnancy were selected according to the inclusion and exclusion criteria. They were subjected to type 1 Schirmer's testing and intraocular pressure measurement by Perkin's tonometer before and after delivery.
Result:
There was no significant pre- and postdelivery IOP difference between the different age groups (<30 and ≥30 years), mode of delivery, and parity. There was a statistically significant (P < 0.001) increase in mean tear production (Schirmer's test) after delivery, irrespective of age group, mode of delivery, and gravida status. However, no significant intergroup difference was observed.
Conclusion:
There was no significant change in IOP before and after delivery in uncomplicated pregnancies. However, a statistically significant increase in tear production was observed in the immediate postpartum period.
Keywords: Intra-ocular pressure change, tear production change, term pregnancy
Introduction
Delivery of an infant is one of the commonest and most important interventions at the primary healthcare level. Monitoring a few, but important parameters of the eyes in pregnant women may help in prevention and early management of ocular disorders such as glaucoma [due to raised intraocular pressure (IOP)] and dry eye disease (due to tear film deficiency). The current study highlights the importance of two basic, but important ocular parameters (IOP and tear film status), so that a small step at the primary care level may prevent a major ocular disorder in the future.
Pregnancy is characterized by changes in maternal hormone levels which are needed for proper development of fetus and normal delivery at term. The physiological effects of these hormones are not confined to the reproductive system and affect other organs including eye and its adnexae. Intraocular pressure and tear production are usually decreased in pregnancy. Many studies have documented these findings. However, no study has observed the effects on IOP and tear production in uncomplicated pregnant women at term pregnancy and immediate postpartum. This study focused on the effect of hormonal changes occurring just before and after delivery in term uncomplicated pregnancies and their possible effect on IOP and tear production.
Materials and Methods
The study was a hospital-based observational comparative study, conducted at the Department of Ophthalmology and Department of Obstetrics and Gynecology, at a tertiary care Institute in North India. The study adhered to the Declaration of Helsinki. It was conducted after obtaining the ethical clearance from the Institute Ethics Committee over a period of 6 months from June, 2019 to December, 2019. A total of 106 patients (212 eyes) at term pregnancy and admitted in the Department of Obstetrics and Gynaecology for delivery were included in the study. Participants were selected according to the following inclusion and exclusion criteria. The inclusion criteria included all pregnant women aged 21–38 years of uncomplicated term pregnancy admitted for delivery and willing to give written consent for the study.
Ocular exclusion criteria included patients with blepharitis, conjunctivitis, previous intraocular infection, any previous eye surgery, and eyelid conditions such as entropion and ectropion. Patients with a history of medications leading to dry eye, including antihistamines, decongestants, hormone replacement therapy, antidepressants, and drugs for high blood pressure, acne and birth control were also excluded. Systemic exclusion criteria included patients with history of tobacco or alcohol intake, any collagen diseases, diabetes, hypertension, glaucoma, rheumatoid arthritis, lupus, scleroderma, Sjogren's syndrome, thyroid disorders, and vitamin A deficiency. Patients with diseases like pregnancy-induced hypertension, vascular diseases, and antiphospholipid antibody (APLA) syndrome were also excluded from the study.
The sample size for this pilot study was estimated to be a minimum of 100 according to the expected admission rate, at the Institute. All the eligible participants were provided with patient information document and written consent was obtained. All patients underwent type 1 Schirmer's test (without topical anesthetic) at 5 minutes followed by at least ten minutes later for IOP measurement by Perkin's tonometer. Both the above antepartum test readings were taken within 48–72 hours before delivery/LSCS and the postpartum readings within 48–72 hours after delivery/LSCS, preferably between 10–11 AM, so as to decrease the diurnal variation factor. Fundus examination of both the eyes was also done, before and after delivery.
Procedure of Schirmer's test
The eye was mopped dry and the folded end of 35 mm long and 5 mm wide precalibrated (mm) Whatmann no. 41 paper was gently inserted at the junction between the lateral one-third and medial two-third of the lower fornix without touching the cornea. The extent of the wetting (mm) after 5 minutes using stop watch was recorded as the tear film production.
Procedure of IOP measurement
IOP measurement was done in both the eyes (right eye first as per convention). A drop of local anesthetic (tetracaine 0.5%) was instilled in the eye of the patient, followed after 1 minute by a drop of 0.5% sodium fluorescein dye. Thereafter, the intraocular pressure was measured twice, with the use of a standardized hand-held Perkins Tonometer (Perkins Tonometer Mk3, HS Clement Clarke International, Haag Streit UK Ltd. CE0120). The mean of the two values was taken as the final value. All IOP measurements were done by the same investigator to remove interobserver bias.
Statistical analysis
Data were coded and recorded in the MS Excel spreadsheet program. SPSS v23 (IBM Corp.) was used for data analysis. Descriptive statistics were elaborated in the form of means/standard deviations and medians/IQRs for continuous variables, and frequencies and percentages for categorical variables. Data were presented in a graphical manner wherever appropriate for data visualization using histograms/box-and-whisker plots/column charts for continuous data and bar charts/pie charts for categorical data.
Group comparisons for continuously distributed data were made using independent sample 't’ test when comparing two groups, and one-way ANOVA for more than two groups. A post hoc pairwise analysis was performed using Tukey's HSD test in case of one-way ANOVA. If data were not normally distributed, appropriate nonparametric tests in the form of Wilcoxon Test/Kruskal–Wallis test were performed for these comparisons.
The Chi-squared test was used for group comparisons for categorical data. In case the expected frequency in the contingency tables was found to be <5 for >25% of the cells, Fisher's Exact test was used instead. Paired variables which were continuously distributed were compared using Paired 't’ test when comparing two variables, and repeated measures ANOVA for comparing more than two variables. In case the variables were not continuously distributed, nonparametric tests in the form of Wilcoxon Signed Rank Test/Friedman Test were used.
Paired categorical variables were compared using the McNemar's test. The linear correlation between the two continuous variables was explored using Pearson's correlation (if the data were normally distributed) and Spearman's correlation (for non-normally distributed data). Statistical significance was kept at P < 0.05.
Results
The study included 212 eyes of 106 patients. The mean age (Years) of the study participants was 26.62 ± 4.47. 79 (74.5%) of the participants were aged <30 years, 27 (25.5%) of the participants were aged ≥30 years, 47 (44.3%) of the participants were primigravida, and 59 (55.7%) of the participants were multigravida. About 58 (54.7%) of the participants had normal vaginal delivery and 48 (45.3%) of the participants had lower segment cesarean section (LSCS). The obstetric history of the study participants is summarized in Table 1. Changes in mean IOP, with respect to age, gravida, and mode of delivery are detailed in Tables 2-5. The mean IOP (mmHg) decreased from 13.49 at the antepartum time point to 13.07 at the postpartum time point [Table 2]. This change was not statistically significant (Wilcoxon Test: V = 2662.5, P = 0.102). Figure 1 is a line diagram depicting the change in mean IOP (mmHg) over time.
Table 1.
Obstetric history of study participants.
| Clinical Features | Mean±SD/n (%) (n=106) |
|---|---|
| Age (Years) | 26.62±4.47 |
| Age | |
| <30 Years | 79 (74.5%) |
| ≥30 Years | 27 (25.5%) |
| Obstetric History | |
| Gravida 1 | 47 (44.3%) |
| Gravida 2 | 25 (23.6%) |
| Gravida 3 | 21 (19.8%) |
| Gravida 4 | 6 (5.7%) |
| Gravida 5 | 5 (4.7%) |
| Gravida 6 | 1 (0.9%) |
| Gravida 9 | 1 (0.9%) |
| Parity | |
| Primigravida | 47 (44.3%) |
| Multigravida | 59 (55.7%) |
| Mode of Delivery | |
| Normal vaginal delivery (NVD) | 58 (54.7%) |
| Lower segment caesarean section (LSCS) | 48 (45.3%) |
Table 2.
Assessment of change in mean IOP (mmHg) pre- and post -delivery (n=212)
| Time point | Mean IOP (mmHg) | Wilcoxon Test | |||
|---|---|---|---|---|---|
| Mean (SD) | Median (IQR) | Range | V | P | |
| Antepartum | 13.49 (2.60) | 13.00 (4.00) | 9.00-19.00 | ||
| Postpartum | 13.07 (2.50) | 13.00 (4.00) | 8.00-18.00 | 2662.5 | 0.102 |
| Absolute Change | −0.42 (2.36) | −1.00 (3.00) | −6.00-4.00 | ||
| Percent Change | −1.6% | −7.4% (24.4) | −38-44% | ||
Table 5.
Comparison of the two groups (Mode of delivery) in terms of change in mean IOP (mmHg) pre-and postdelivery (n=212)
| Mean IOP (mmHg) | Mode of Delivery | P for comparison of the two groups at each of the timepoints (Wilcoxon Test) | |||
|---|---|---|---|---|---|
| NVD | LSCS | ||||
| Mean (SD) | Median (IQR) | Mean (SD) | Median (IQR) | ||
| Antepartum | 13.21 (2.43) | 13.00 (4.00) | 13.82 (2.79) | 13.50 (4.25) | 0.295 |
| Postpartum | 13.03 (2.53) | 13.00 (4.00) | 13.10 (2.49) | 13.00 (4.00) | 0.939 |
| Absolute change | 0.17 (2.10) | 0.50 (2.75) | 0.72 (2.64) | 1.00 (3.50) | 0.157 |
| Percent change | 0.3% (15.7) | 2.9% (22.2) | 3.1% (20.0) | 8.7% (26.8) | 0.157 |
| P value for change in mean IOP (mmHg) over time within each group (Wilcoxon test) | 0.580 | 0.098 | |||
| Overall P Value for comparison of change in mean IOP (mmHg) over time between the two groups (Generalized Estimating Equations Method) | 0.241 | ||||
Figure 1.
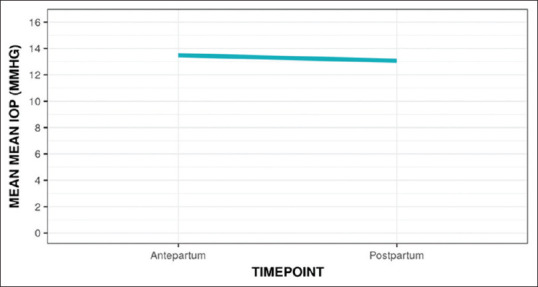
Line diagram depicting the change in mean IOP (mmHg) pre- and postdelivery
Table 3 depicts the change in IOP with age-distributed groups. In the <30 years age group, the mean IOP (mmHg) decreased from 13.67 at the antepartum time point to 13.22 at the postpartum time point (P = 0.123). In participants aged ≥30 years, the mean IOP (mmHg) decreased from 12.94 at the antepartum time point to 12.63 at the postpartum time point (P = 0.549). There was no significant difference in the mean IOP (mmHg) over time in both the groups (P = 0.787).
Table 3.
Comparison of the two groups (Age) in terms of change in mean IOP (mmHg) pre- and postdelivery (n=212)
| Mean IOP (mmHg) | Age | P for comparison of the two groups at each of the timepoints (Wilcoxon Test) | |||
|---|---|---|---|---|---|
| <30 Years | ≥30 Years | ||||
| Mean (SD) | Median (IQR) | Mean (SD) | Median (IQR) | ||
| Antepartum | 13.67 (2.69) | 13.00 (5.00) | 12.94 (2.28) | 13.00 (3.25) | 0.246 |
| Postpartum | 13.22 (2.55) | 13.00 (4.00) | 12.63 (2.36) | 13.00 (3.00) | 0.340 |
| Absolute change | 0.46 (2.37) | 1.00 (3.00) | 0.31 (2.37) | 1.00 (2.75) | 0.714 |
| Percent change | 1.7% (17.8) | 7.1% (24.5) | 1.1% (17.7) | 7.7% (22.3) | 0.714 |
| P value for change in mean IOP (mmHg) over time within each group (Wilcoxon test) | 0.123 | 0.549 | |||
| Overall P value for comparison of change in mean IOP (mmHg) over time between the two groups (Generalized Estimating Equations Method) | 0.787 | ||||
Table 4 depicts the change in IOP with gravida-distributed groups. The two groups did not differ in terms of mean IOP (mmHg) at any of the time points. In primigravida, the mean IOP (mmHg) decreased from 14.13 at the antepartum time point to 13.28 at the postpartum time point. This change was statistically significant (Wilcoxon Test: V = 672.0, P = 0.015). In multigravida, the mean IOP (mmHg) decreased from 12.97 at the antepartum time point to 12.90 at the postpartum time point. This change was not statistically significant (Wilcoxon Test: V = 665.0, P = 0.989). No significant difference was observed in the mean IOP (mmHg) over time in both the groups (P = 0.085).
Table 4.
Comparison of the two groups (Parity) in terms of change in mean IOP (mmHg) pre- and postdelivery (n=212)
| Mean IOP (mmHg) | Parity | P for comparison of the two groups at each of the time points (Wilcoxon Test) | |||
|---|---|---|---|---|---|
| Primigravida | Multigravida | ||||
| Mean (SD) | Median (IQR) | Mean (SD) | Median (IQR) | ||
| Antepartum | 14.13 (2.71) | 14.00 (5.00) | 12.97 (2.42) | 12.00 (3.75) | 0.033 |
| Postpartum | 13.28 (2.60) | 13.00 (4.50) | 12.90 (2.43) | 13.00 (3.50) | 0.484 |
| Absolute change | 0.85 (2.24) | 1.00 (3.00) | 0.08 (2.42) | 0.00 (3.75) | 0.071 |
| Percent change | 4.9% (15.8) | 9.1% (22.1) | -1.0% (18.8) | 0.0% (24.6) | 0.071 |
| P value for change in mean IOP (mmHg) over time within each group (Wilcoxon test) | 0.015 | 0.989 | |||
| Overall P value for comparison of change in mean IOP (mmHg) over time between the two groups (Generalized Estimating Equations Method) | 0.085 | ||||
Table 5 depicts change in IOP with mode of delivery-distributed groups. Based on the mode of delivery, the two groups did not differ in terms of mean IOP (mmHg) at any of the time points. In the NVD group, the mean IOP (mmHg) decreased from 13.21 at the antepartum time point to 13.03 at the postpartum time point. This change was not statistically significant (Wilcoxon Test: V = 694.5, P = 0.580). In the LSCS group, the mean IOP (mmHg) decreased from 13.82 at the antepartum time point to 13.10 at the postpartum time point. This change was not statistically significant (Wilcoxon Test: V = 636.5, P = 0.098). Also, there was no significant difference in the trend of mean IOP (mmHg) over time in both the groups (P = 0.241). Figure 2 is a line diagram depicting the change in mean IOP (mmHg) over time in the NVD and LSCS groups.
Figure 2.

Line diagram depicting the change in mean IOP (mmHg) pre- and postdelivery in the NVD and LSCS groups
The mean tear production changes (Schirmer's test) with respect to age, gravida, and mode of delivery are detailed in Tables 6–9. Table 6 depicts the mean tear production changes (Schirmer's test) over time. The paired Wilcoxon test was used to explore the difference in mean Schirmer's test values (mm) at the two time points. The mean Schirmer's test values (mm) increased significantly from 19.47 at the antepartum time point to 21.97 at the postpartum time point (Wilcoxon Test: V = 685.5, P = <0.001). Figure 3 is a line diagram depicting the pre- and postdelivery change in mean Schirmer's test (mm) over time.
Table 6.
Assessment of change in mean Schirmer’s test (mm) pre- and postdelivery (n=212)
| Timepoint | Mean Schirmer’s Test (mm) | Wilcoxon Test | |||
|---|---|---|---|---|---|
| Mean (SD) | Median (IQR) | Range | V | P | |
| Antepartum | 19.47 (6.06) | 20.00 (5.38) | 2.50-35.00 | ||
| Postpartum | 21.97 (5.30) | 22.50 (5.00) | 5.00-35.00 | ||
| Postpartum | 21.97 (5.30) | 22.50 (5.00) | 5.00-35.00 | 685.5 | <0.001 |
| Absolute change | 2.50 (3.93) | 2.50 (4.88) | -16.50-12.50 | ||
| Percent change | 19.8% (32.3) | 12.5% (27.0) | −73-200% | ||
Table 9.
Comparison of the two groups (mode of delivery) in terms of change in mean Schirmer’s test (mm) pre- and post -delivery (n=212)
| Mean Schirmer’s Test (mm) | Mode of Delivery | P for comparison of the two groups at each of the timepoints (Wilcoxon Test) | |||
|---|---|---|---|---|---|
| NVD | LSCS | ||||
| Mean (SD) | Median (IQR) | Mean (SD) | Median (IQR) | ||
| Antepartum | 19.59 (6.75) | 20.00 (6.50) | 19.33 (5.17) | 20.00 (5.00) | 0.951 |
| Postpartum | 22.40 (5.55) | 22.50 (5.00) | 21.45 (5.00) | 22.25 (6.25) | 0.437 |
| Absolute change | −2.81 (3.39) | −2.50 (3.50) | −2.11 (4.50) | −2.50 (5.00) | 0.591 |
| Percent change | −22.3% (33.3) | −11.8% (18.7) | −16.7% (31.2) | −12.5% (29.3) | 0.591 |
| P Value for change in mean Schirmer’s Test (mm) over time within each group (Wilcoxon test) | <0.001 | <0.001 | |||
| Overall P Value for comparison of change in Mean Schirmer’s Test (mm) over time between the two groups (Generalized Estimating Equations Method) | 0.372 | ||||
Figure 3.

Line diagram depicting the change in mean Schirmer's test values (mm) pre- and postdelivery
Table 7 depicts the comparison of the two groups according to age, in terms of change in mean Schirmer's test values (mm) before and after delivery. Upon comparison of groups in terms of age, the two groups did not differ in terms of mean Schirmer's Test values (mm) at any of the time points. In participants aged <30 Years, the mean Schirmer's Test values (mm) increased significantly from 19.76 at the antepartum time point to 22.12 at the postpartum time point (Wilcoxon Test: V = 383.0, P = <0.001). In participants aged ≥ 30 Years, the mean Schirmer's Test values (mm) increased significantly from 18.63 at the antepartum time point to 21.52 at the postpartum time point (Wilcoxon Test: V = 47.0, P = 0.001). However, there was no difference in the mean Schirmer's test values (mm) over time in both the groups (P = 0.609).
Table 7.
Comparison of the two groups (age) in terms of change in mean Schirmer’s test (mm) pre-and postdelivery (n=212)
| Mean Schirmer’s Test (mm) | Age | P for comparison of the two groups at each of the timepoints (Wilcoxon Test) | |||
|---|---|---|---|---|---|
| <30 Years | ≥30 Years | ||||
| Mean (SD) | Median (IQR) | Mean (SD) | Median (IQR) | ||
| Antepartum | 19.76 (6.50) | 20.00 (5.25) | 18.63 (4.54) | 20.00 (4.50) | 0.391 |
| Postpartum | 22.12 (5.28) | 22.50 (5.00) | 21.52 (5.46) | 22.50 (6.50) | 0.965 |
| Absolute change | −2.36 (3.49) | −2.50 (5.00) | −2.89 (5.05) | −3.50 (3.00) | 0.279 |
| Percent change | −19.5% (32.7) | −11.1% (28.3) | −20.5% (31.8) | −17.6% (17.4) | 0.279 |
| P value for change in Mean Schirmer’s Test (mm) over time within each group (Wilcoxon test) | <0.001 | 0.001 | |||
| Overall P value for comparison of change in | |||||
| Mean Schirmer’s Test (mm) over time between the two groups (Generalized Estimating Equations Method) | 0.609 | ||||
The comparison of the primigravida and multigravida groups in terms of change in mean Schirmer's test values (mm) over time is depicted in Table 8. In primigravida, the mean Schirmer's Test values (mm) increased significantly from 19.50 at the antepartum time point to 22.10 at the postpartum time point (Wilcoxon Test: V = 108.5, P = <0.001). In multigravida, the mean Schirmer's test values (mm) increased from 19.45 at the antepartum time point to 21.86 at the postpartum time point. However, there was no significant difference in mean Schirmer's Test values (mm) over time in both the groups (P = 0.808).
Table 8.
Comparison of the two groups (Parity) in terms of change in mean Schirmer’s test (mm) pre- and postdelivery (n=212)
| Mean Schirmer’s Test (mm) | Parity | P value for comparison of the two groups at each of the timepoints (Wilcoxon Test) | |||
|---|---|---|---|---|---|
| Primigravida | Multigravida | ||||
| Mean (SD) | Median (IQR) | Mean (SD) | Median (IQR) | ||
| Antepartum | 19.50 (6.92) | 20.00 (7.50) | 19.45 (5.34) | 20.00 (5.00) | 0.789 |
| Postpartum | 22.10 (5.51) | 22.00 (5.00) | 21.86 (5.18) | 22.50 (5.00) | 0.867 |
| Absolute change | −2.60 (3.40) | −2.50 (5.00) | −2.42 (4.33) | −2.50 (3.75) | 0.903 |
| Percent change | −19.6% (26.5) | −19.0% (32.5) | −19.9% (36.5) | −12.5% (19.9) | 0.903 |
| P value for change in Mean Schirmer’s Test (mm) over time within each group (Wilcoxon test) | <0.001 | <0.001 | |||
| Overall P value for comparison of change in Mean Schirmer’s Test (mm) over time between the two groups (Generalized Estimating Equations Method) | 0.808 | ||||
Table 9 depicts the comparison of the NVD and LSCS groups in terms of change in mean Schirmer's Test values (mm) before and after delivery. Upon comparison of the groups based on the mode of delivery, the two groups did not differ in terms of mean Schirmer's test values (mm) at any of the time points. In the NVD group, the mean Schirmer's test values (mm) increased significantly from 19.59 at the antepartum timepoint to 22.40 at the postpartum time point (Wilcoxon Test: V = 151.5, P = <0.001). In the LSCS group, the mean Schirmer's test values (mm) increased significantly from 19.33 at the antepartum timepoint to 21.45 at the postpartum timepoint (Wilcoxon Test: V = 189.0, P = <0.001). However, there was no significant difference in mean Schirmer's Test values (mm) before and after delivery in both the groups (P = 0.372). Figure 4 is a line diagram depicting the change in the mean Schirmer's test values (mm) pre- and postdelivery in the NVD and LSCS groups.
Figure 4.

Line diagram depicting the change in mean Schirmer's test values (mm) pre- and postdelivery in the NVD and LSCS groups
In summary, there was no significant pre- and postdelivery difference between the different age groups (<30 and >30 years) in terms of change in IOP. There was no significant difference between the NVD or LSCS groups in terms of change in IOP, before and after delivery. However, there was a mild statistically significant decrease in IOP in primigravida patients in the immediate postpartum period. There was no overall difference between the primigravida and multigravida groups for change in IOP, before and after delivery. There was a statistically significant increase in mean tear production (Schirmer's test), after delivery in all the groups. However, no significant difference was observed on Schirmer's test when intergroup comparison was done.
The current study shows that tear film production is increased in the immediate postpartum period, possibly due to the sudden drop in the estrogen levels postdelivery. This is in contrast to the increased prevalence of dry eye disease during pregnancy. The monitoring of IOP and tear film status may be desirable in the antepartum and postpartum period to prevent and manage disorders of the ocular surface (due to tear film abnormalities) and glaucoma (due to raised IOP).
Discussion
Hormonal changes in pregnancy are vital for proper fetal development and smooth delivery at term.[1,2] Physiological effects of these hormones also affect other organs including eye and its adnexae.[3] All parts of the eye from anterior segment to the posterior segment could be affected.[4,5]
Physiological ocular changes during pregnancy can be chloasma in cheek, subconjunctival hemorrhage, tear film composition alteration, decreased corneal sensation and increased corneal thickness, alteration in refractive power, increased lens thickness, and pituitary enlargement effects. Pathological changes like orbital carotid-cavernous hemangioma, blepharoptosis, Horner's syndrome, facial nerve palsy, worsening of diabetic retinopathy, serous retinal detachment, central serous chorioretinopathy, vascular changes, papilloedema, and ischemic optic neuropathy may also occur.
In the anterior segment, tear film and IOP are commonly affected. Studies have shown that IOP is usually decreased in pregnancy, which may be potentially beneficial for patients with glaucoma. However, various studies have shown that dry eye disease is more common in pregnancy.[6,7] Some of the consequences of dry eye disease like keratopathy may adversely affect vision.[5]
No study has been conducted till date, for determining the effect of IOP and tear production in term pregnancy and immediate post-partum. Through this pilot study, we have described tear film changes and IOP in term uncomplicated pregnancy just before and after delivery.
Goldich et al. studied ocular anterior segment changes in pregnant and nonpregnant women and observed that IOP was significantly lower in the pregnant group.[4] Atas and co-investigators also studied 54 pregnant ladies in the last trimester and found lower IOP in the study population.[8]
Several theories have been proposed for pregnancy-related ocular hypotension. One such theory is decreased episcleral venous pressure due to upregulation of aqueous humor drainage despite normal production.[9] This phenomenon is thought to be related to higher progesterone levels[9,10] and increased levels of nitric oxide (NO), endothelin-I, and eicosanoids.[11] Progesterone decreases IOP by antagonizing the endogenous corticosteroid hormone which has ocular hypertensive action,.[10] NO, endothelin-1, and eicosanoids cause vasodilation and consequently improved aqueous drainage.[11] Human chorionic gonadotrophin (HCG) hormone has a role in pregnancy-associated ocular hypotension.[12] In a study conducted in postmenopausal women with glaucoma, administration of HCG caused a reduction in IOP.[12] The same findings were replicated in an experimental study conducted on normal or ovariectomized rabbits, in which IOP was reduced after HCG administration.[10] HCG produces ocular hypotension by stimulating the production of cyclic adenosine monophosphate (cAMP) which in turn decreases aqueous humor production.[10]
The observed ocular hypotension is most likely due to the increased production of progesterone and NO during pregnancy. The ligament softening action of relaxin, an essential hormone required for child birth, may also be seen in the suspending ligaments of the eye coat, thereby reducing the rigidity of sclera with subsequent decrease in IOP.[13,14]
Our study demonstrated a mild but statistically (P < 0.001) significant increase in mean tear production (Schirmer's test), between the different age groups (<30 and > 30 years), between the NVD and LSCS groups, and between the primigravida and multigravida groups, before and after delivery. This may be due to sudden fall in estrogen levels in the immediate postpartum period.
Tear film changes during pregnancy have been previously investigated with consistent evidence that dry eye is more prevalent during pregnancy.[15] Ding and co-workers found that dry eye symptoms (DES) were more in pregnant rabbits.[15]
Research has found that there should be a balance between the prosecretory hormone (testosterone) and antisecretory hormone (oestrogen) for optimal functioning of meibomian glands,[16,17] as testosterone is responsible for the development and differentiation of this gland and estrogen promotes acinar cell death leading to reduction in gland size and decrease in secretions.[16,17] There is increased secretion of estrogen, progesterone, testosterone, and testosterone binding protein (TBP) in pregnancy, which causes the depletion of biologically active free testosterone.[18] The sharing of the same cellular receptor by free testosterone and high level of progesterone further aggravate the reduced prosecretory activity of testosterone on the meibomian glands.[17,19]
Some recent studies also recommend routine ocular checkup during pregnancy. Agrawal and co-workers found that there is a significant increase in the corneal curvature and corneal thickness along with a decrease in IOP, during pregnancy. They recommended that all pregnant women should have routine ocular examination and any changes that are noted should be addressed, keeping in mind the period of gestation.[20] Naderan has emphasized that pathological eye diseases should be differentiated from physiologic ocular changes, so as to establish an individualized treatment or preventive plan, which forms the mainstay of obstetric ophthalmology. He has also recommended a tailored approach of managing pregnant women with ocular disorders so that the ocular benefits of treatment to the mother should outweigh any potential harm to the fetus.[21]
We postulate that the hormonal changes occurring just before and after delivery do not significantly affect the IOP; however, a mild increase in tear production of the eyes takes place. The current study will add to our knowledge of important ocular changes occurring as a result of hormonal alterations, in the immediate prepartum and postpartum period. A limitation of the current study is that only single-time IOP measurements were done pre- and postdelivery, instead of diurnal IOP measurement.
Conclusion
Pregnancy is associated with several ocular changes. Of these, IOP and tear production are most important as fluctuations in these parameters may be harmful to the eyes. This study aimed to evaluate the IOP and tear production changes in the antepartum period and immediate postpartum, and whether there was any significant change in these parameters. We observed an insignificant change in IOP; however, there was a statistically significant increase in tear production in the postpartum period. This effect can be explained by a sudden drop in estrogen levels in the body in the postpartum period. The study shows that although there are no alarming changes in these parameters, a bird's eye watch on these parameters in pregnant women is desirable.
The outcome of this study is expected to create awareness on pregnancy-related ocular changes at term and facilitate early recognition and prompt treatment where necessary. Further studies are desirable to firmly establish these findings and also to examine the association between the concentrations of various maternal hormones, gestational age, IOP, and tear film function in pregnancy.
Declaration of patient consent
The authors certify that they have obtained all appropriate patient consent forms. In the form, the patients have given their consent for their images and other clinical information to be reported in the journal. The patients understand that their names and initials will not be published and due efforts will be made to conceal their identity, but anonymity cannot be guaranteed.
Financial support and sponsorship
Nil.
Conflicts of interest
There are no conflicts of interest.
References
- 1.Garg P, Aggarwal P. Ocular changes in pregnancy. Nepal J Ophthalmol. 2012;4:150–61. doi: 10.3126/nepjoph.v4i1.5867. [DOI] [PubMed] [Google Scholar]
- 2.Omoti AE, Waziri-Erameh JM, Okeigbemen VW. A review of the changes in the ophthalmic and visual system in pregnancy. Afr J Reprod Health. 2008;12:185–96. [PubMed] [Google Scholar]
- 3.Pilas-Pomykalska M, Czajkowskii J, Oszukowski P. Ocular changes during pregnancy. Ginekol Pol. 2005;76:655–60. [PubMed] [Google Scholar]
- 4.Goldich Y, Cooper M, Barkana Y, Tovbin J, Lee Ovadia K, Avni I, Zadok D. Ocular anterior segment changes in pregnancy. J Cataract Refract Surg. 2014;40:1868–71. doi: 10.1016/j.jcrs.2014.02.042. [DOI] [PubMed] [Google Scholar]
- 5.Akar Y, Yucel I, Akar ME, Uner M, Trak B. Long-term fluctuation of retinal sensitivity during pregnancy. Can J Ophthalmol. 2005;40:487–9. doi: 10.1016/S0008-4182(05)80011-0. [DOI] [PubMed] [Google Scholar]
- 6.Skare TL, Gehlen ML, Silveira DMG, Uema MMDS. Pregnancy and lacrimal dysfunction. Rev Bras Ginecol Obstet. 2012;34:170–4. doi: 10.1590/s0100-72032012000400006. [DOI] [PubMed] [Google Scholar]
- 7.Ding C, Lu M, Huang J. Changes of the ocular surface and aquaporins in the lacrimal glands of rabbits during pregnancy. Mol Vis. 2011;17:2847–55. [PMC free article] [PubMed] [Google Scholar]
- 8.Ataş M, Duru N, Ulusoy DM, Altınkaynak H, Duru Z, Açmaz G, et al. Evaluation of anterior segment parameters during and after pregnancy. Cont Lens Anterior Eye. 2014;37:447–50. doi: 10.1016/j.clae.2014.07.013. [DOI] [PubMed] [Google Scholar]
- 9.Pilas-Pomykalska M, Luczak M, Czajkowski J, Woznjak P, Oszwkowski Changes in intra ocular pressure during pregnancy. P Klin Oozna. 2004;106:238–9. [PubMed] [Google Scholar]
- 10.Ziai N, Ory SJ, Khan AR, Brubaker RF. ß -HCG, progesterone and aqueous dynamics during pregnancy. Arch Ophthalmol. 1994;112:801–6. doi: 10.1001/archopht.1994.01090180099043. [DOI] [PubMed] [Google Scholar]
- 11.Paramjyothi P, Lakshmi ANR, Surekha D. Physiological changes of intraocular pressure (IOP) in the second and third trimesters of normal pregnancy. J Clin Diagn Res. 2011;5:1043–5. [Google Scholar]
- 12.Sears ML, Mead A. A major pathway for the regulation of intraocular pressure. Int Ophthalmol Clin. 1983;6:201–5. doi: 10.1007/BF00141129. [DOI] [PubMed] [Google Scholar]
- 13.Phillips CI, Gore SM. Ocular hypotensive effect of late pregnancy with and without high blood pressure. Br J Ophthalmol. 1985;69:117–9. doi: 10.1136/bjo.69.2.117. [DOI] [PMC free article] [PubMed] [Google Scholar]
- 14.Ch EY, Moon JI. Intraocular pressure change in the pregnant glaucoma or ocular hypertension patients and normal women. Korean J Ophthalmol. 2004;45:1880. [Google Scholar]
- 15.Ding C, Chang N, Fong YC, Wang Y, Trousdale MD, Mircheff AK, et al. Interacting influences of pregnancy and corneal injury on rabbit lacrimal gland immunoarchitecture and function. Invest Ophthalmol Vis Sci. 2006;47:1368–75. doi: 10.1167/iovs.05-1034. [DOI] [PubMed] [Google Scholar]
- 16.Duarte MCB, Pinto NT, Moreira H, Moreira ATR, Wasilewski D. Total testosterone level in postmenopausal women with dry eye. Arq Bras Oftalmol. 2007;70:465–9. doi: 10.1590/s0004-27492007000300014. [DOI] [PubMed] [Google Scholar]
- 17.Kanova N, Bicikova M. Hyperandrogenic states in pregnancy. Physiol Res. 2011;60:243–52. doi: 10.33549/physiolres.932078. [DOI] [PubMed] [Google Scholar]
- 18.Rivarola MA, Forest MG, Migeon CJ. Testosterone, androstenedione and dehydroepiandrosterone in plasma during pregnancy and at delivery: Concentration and protein binding. J Clin Endocrinol Metab. 1968;28:34–40. doi: 10.1210/jcem-28-1-34. [DOI] [PubMed] [Google Scholar]
- 19.Choi JR, Levine D, Finberg H. Luteoma of pregnancy: Sonographic findings in two cases. J Ultrasound Med. 2000;19:877–81. doi: 10.7863/jum.2000.19.12.877. [DOI] [PubMed] [Google Scholar]
- 20.Agrawal N, Agarwal LT, Lavaju P, Chaudhary SK. Physiological ocular changes in various trimesters of pregnancy. Nepal J Ophthalmol. 2018;10:16–22. doi: 10.3126/nepjoph.v10i1.21685. [DOI] [PubMed] [Google Scholar]
- 21.Naderan M. Ocular changes during pregnancy. J Curr Ophthalmol. 2018;30:202–10. doi: 10.1016/j.joco.2017.11.012. [DOI] [PMC free article] [PubMed] [Google Scholar]